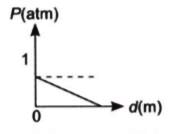
A body brought into the sea from the surface. Which of the following graphs represents correctly the variation of the pressure P on the body with increase in the depth d? [1 atmospheric pressure ≈105Nm−2]
A
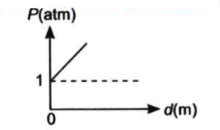
B
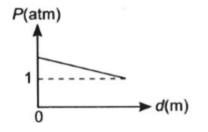
C
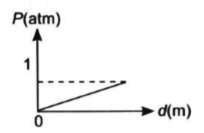
D
Video Solution
Text Solution
The correct Answer is:A
The pressure below the sea surface increases with increase in depth and has a value of 1 atmospheric over the surface.
|
Updated on:21/07/2023
Related Playlists
Knowledge Check
- Question 1 - Select One
Which of the following x-t graphs represents the distance-time variation of a body released from the top of a buiding?
A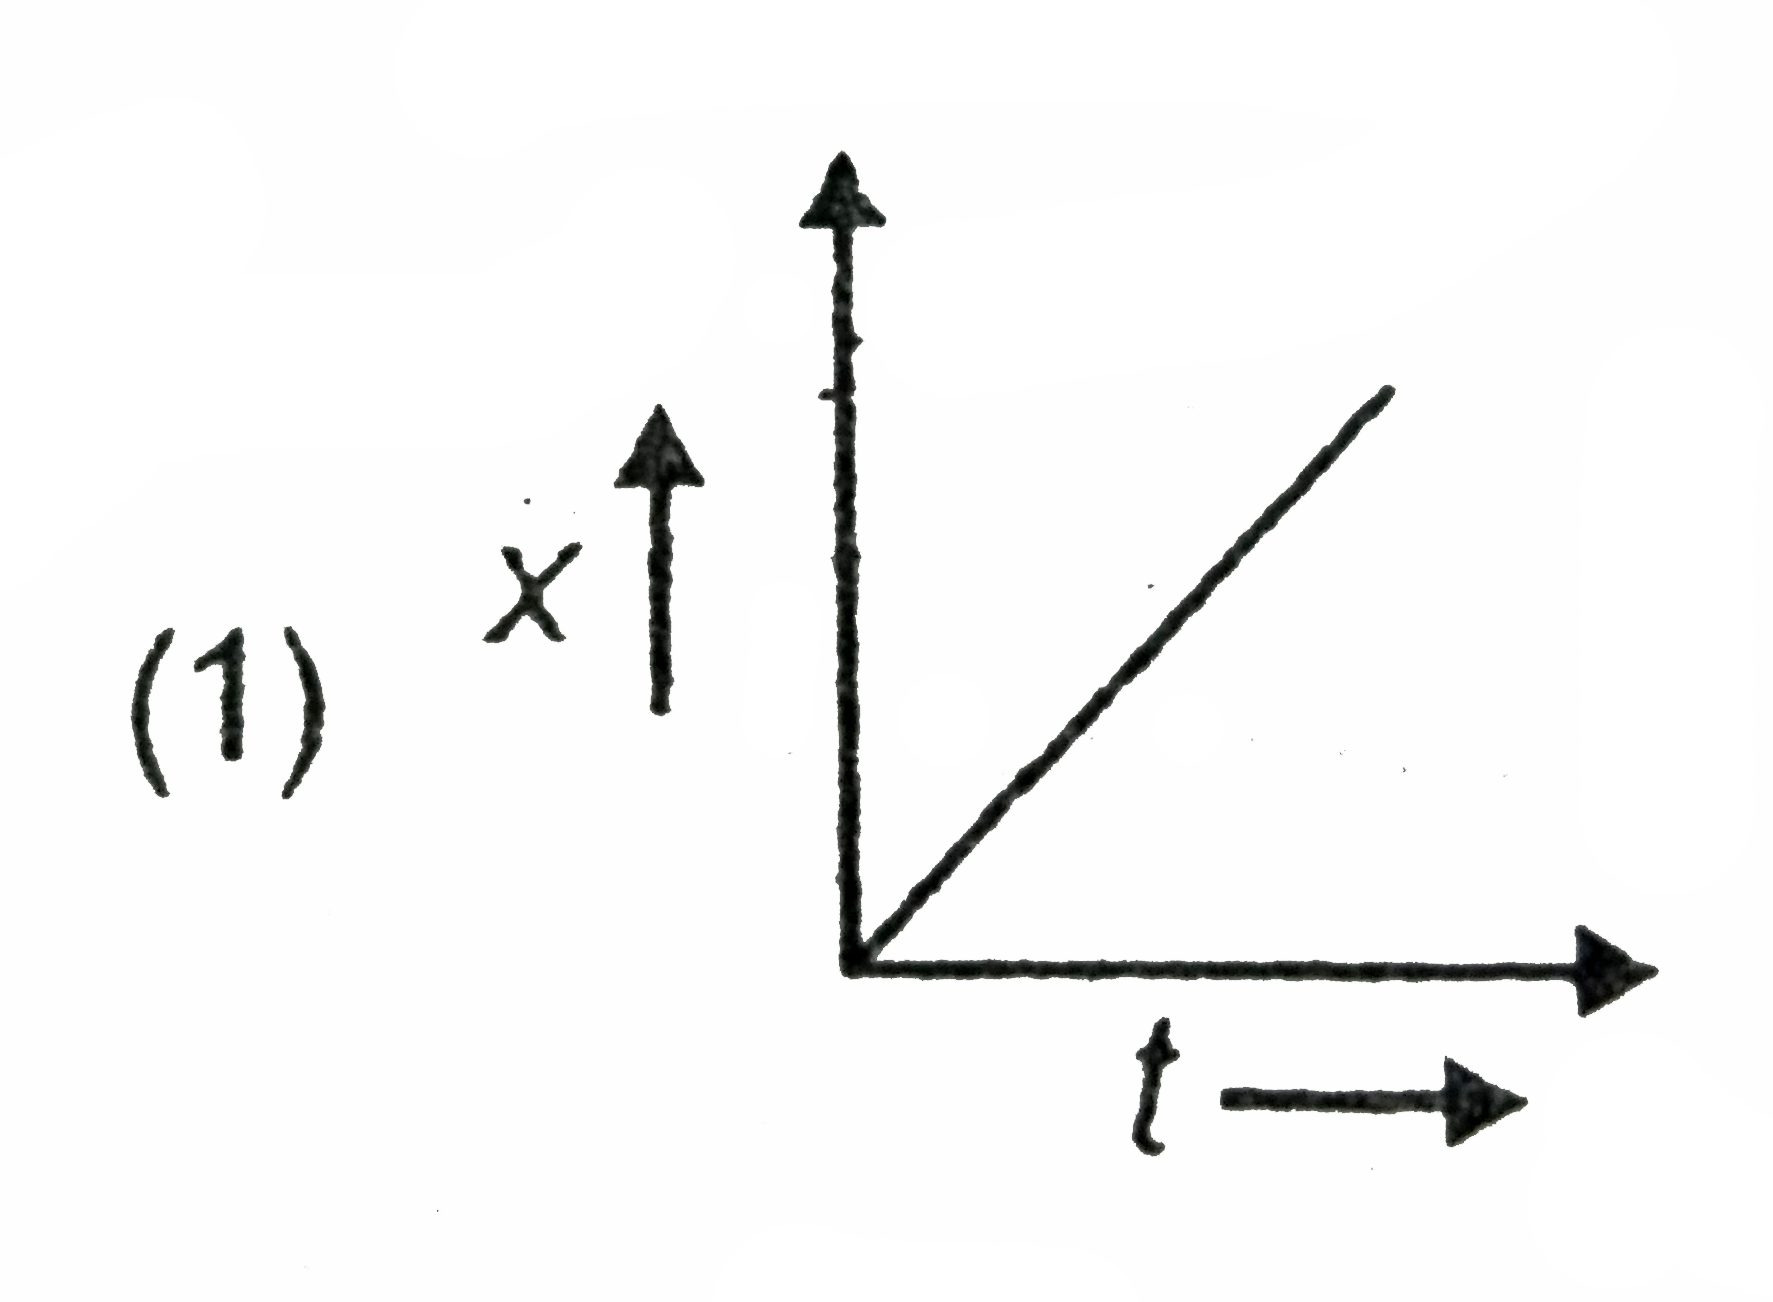 B
B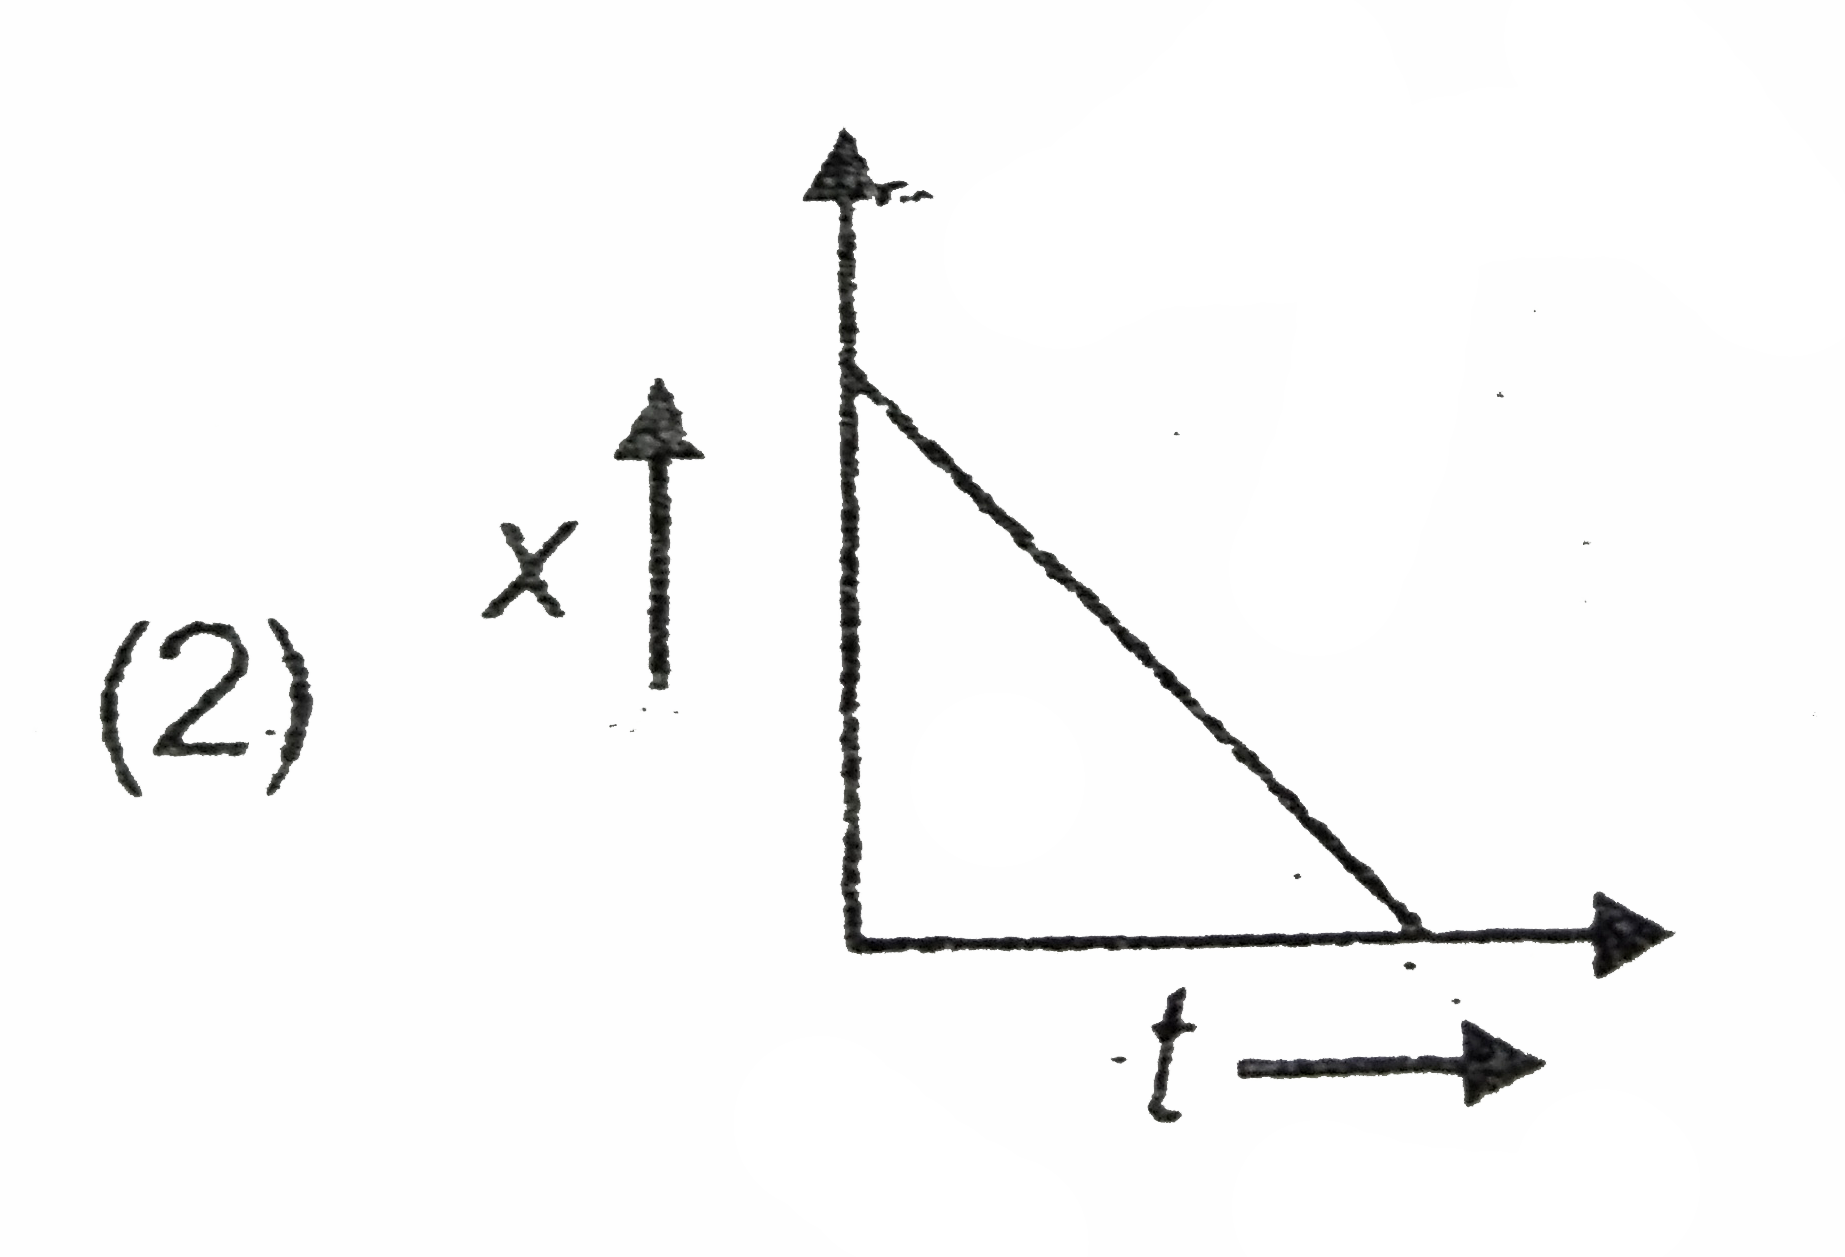 C
C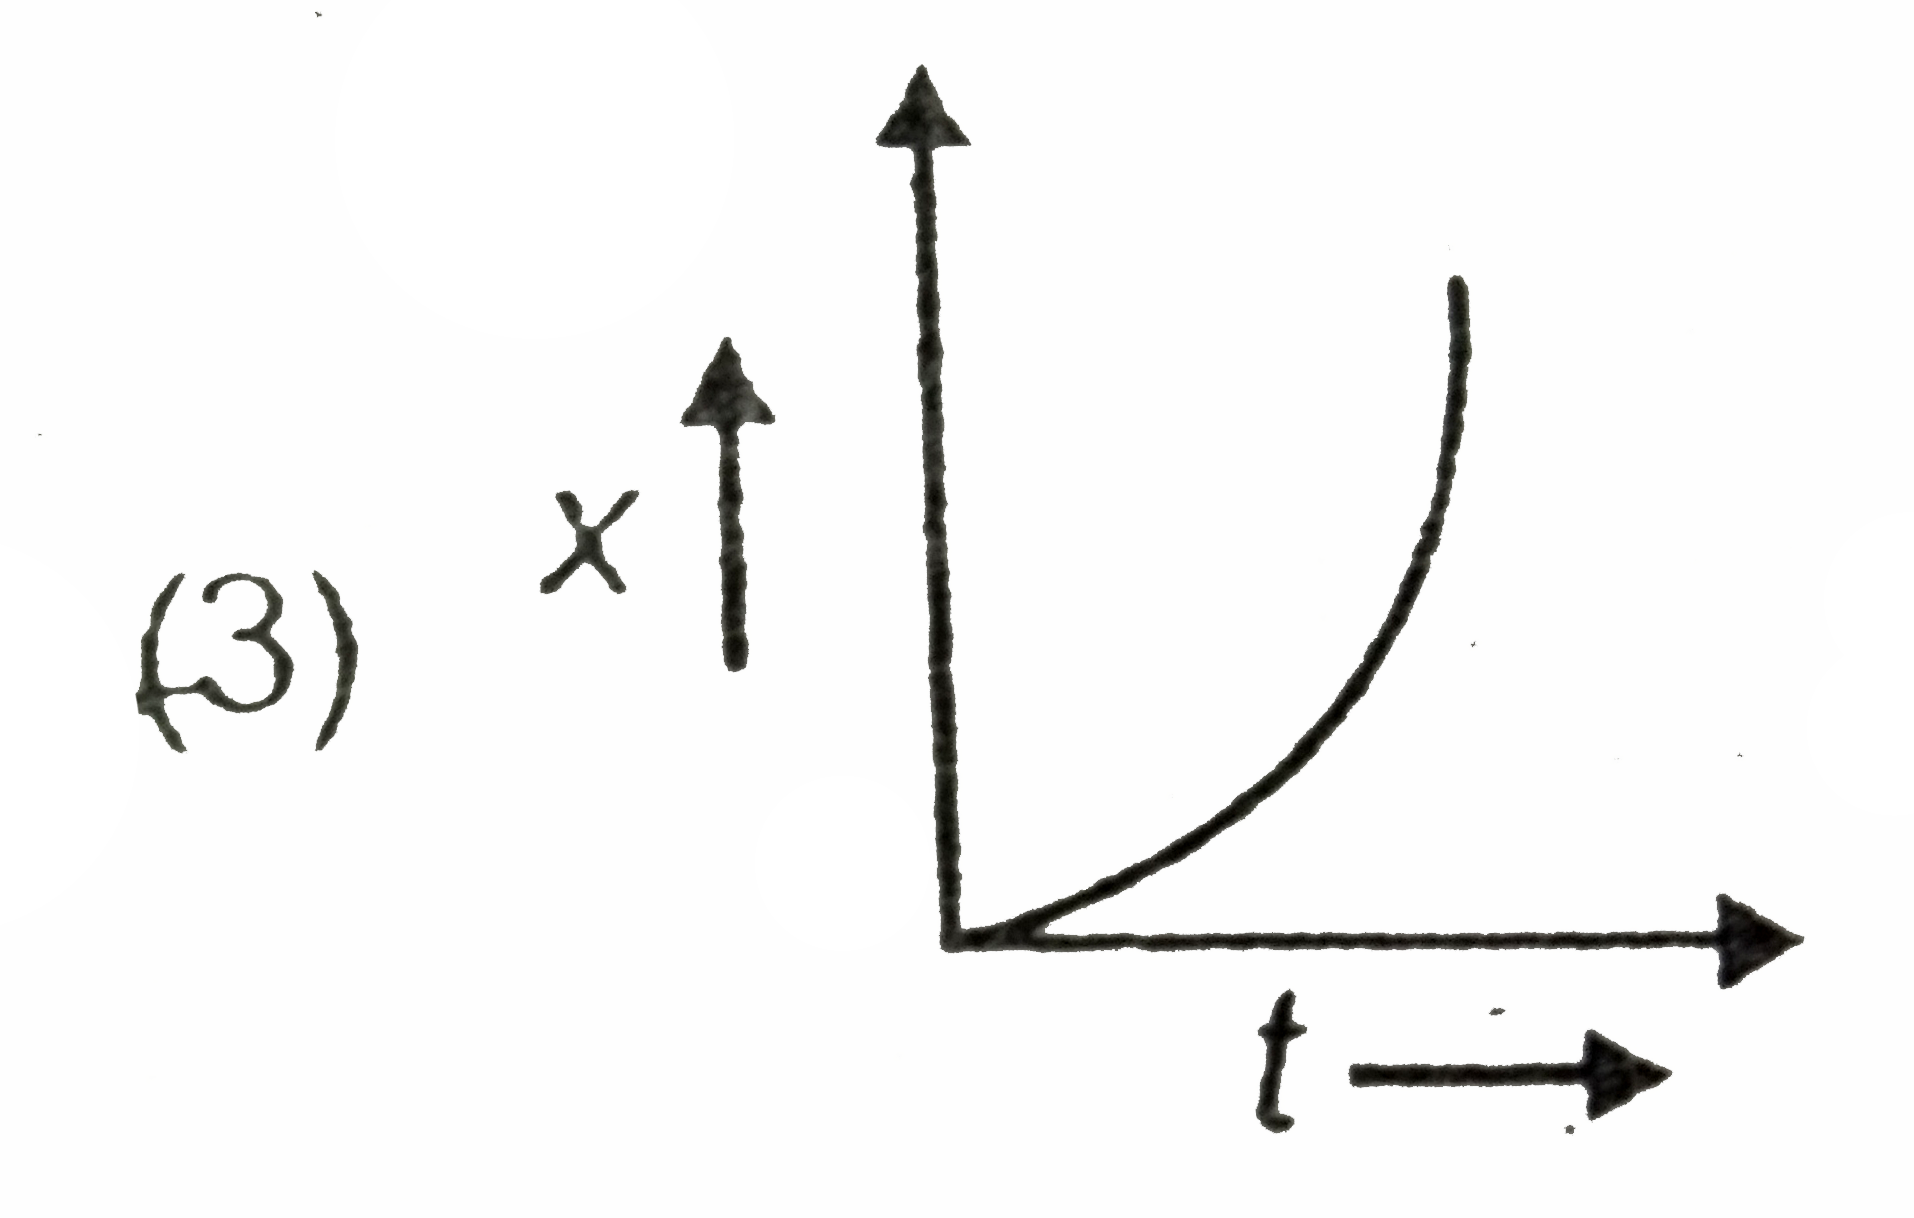 D
D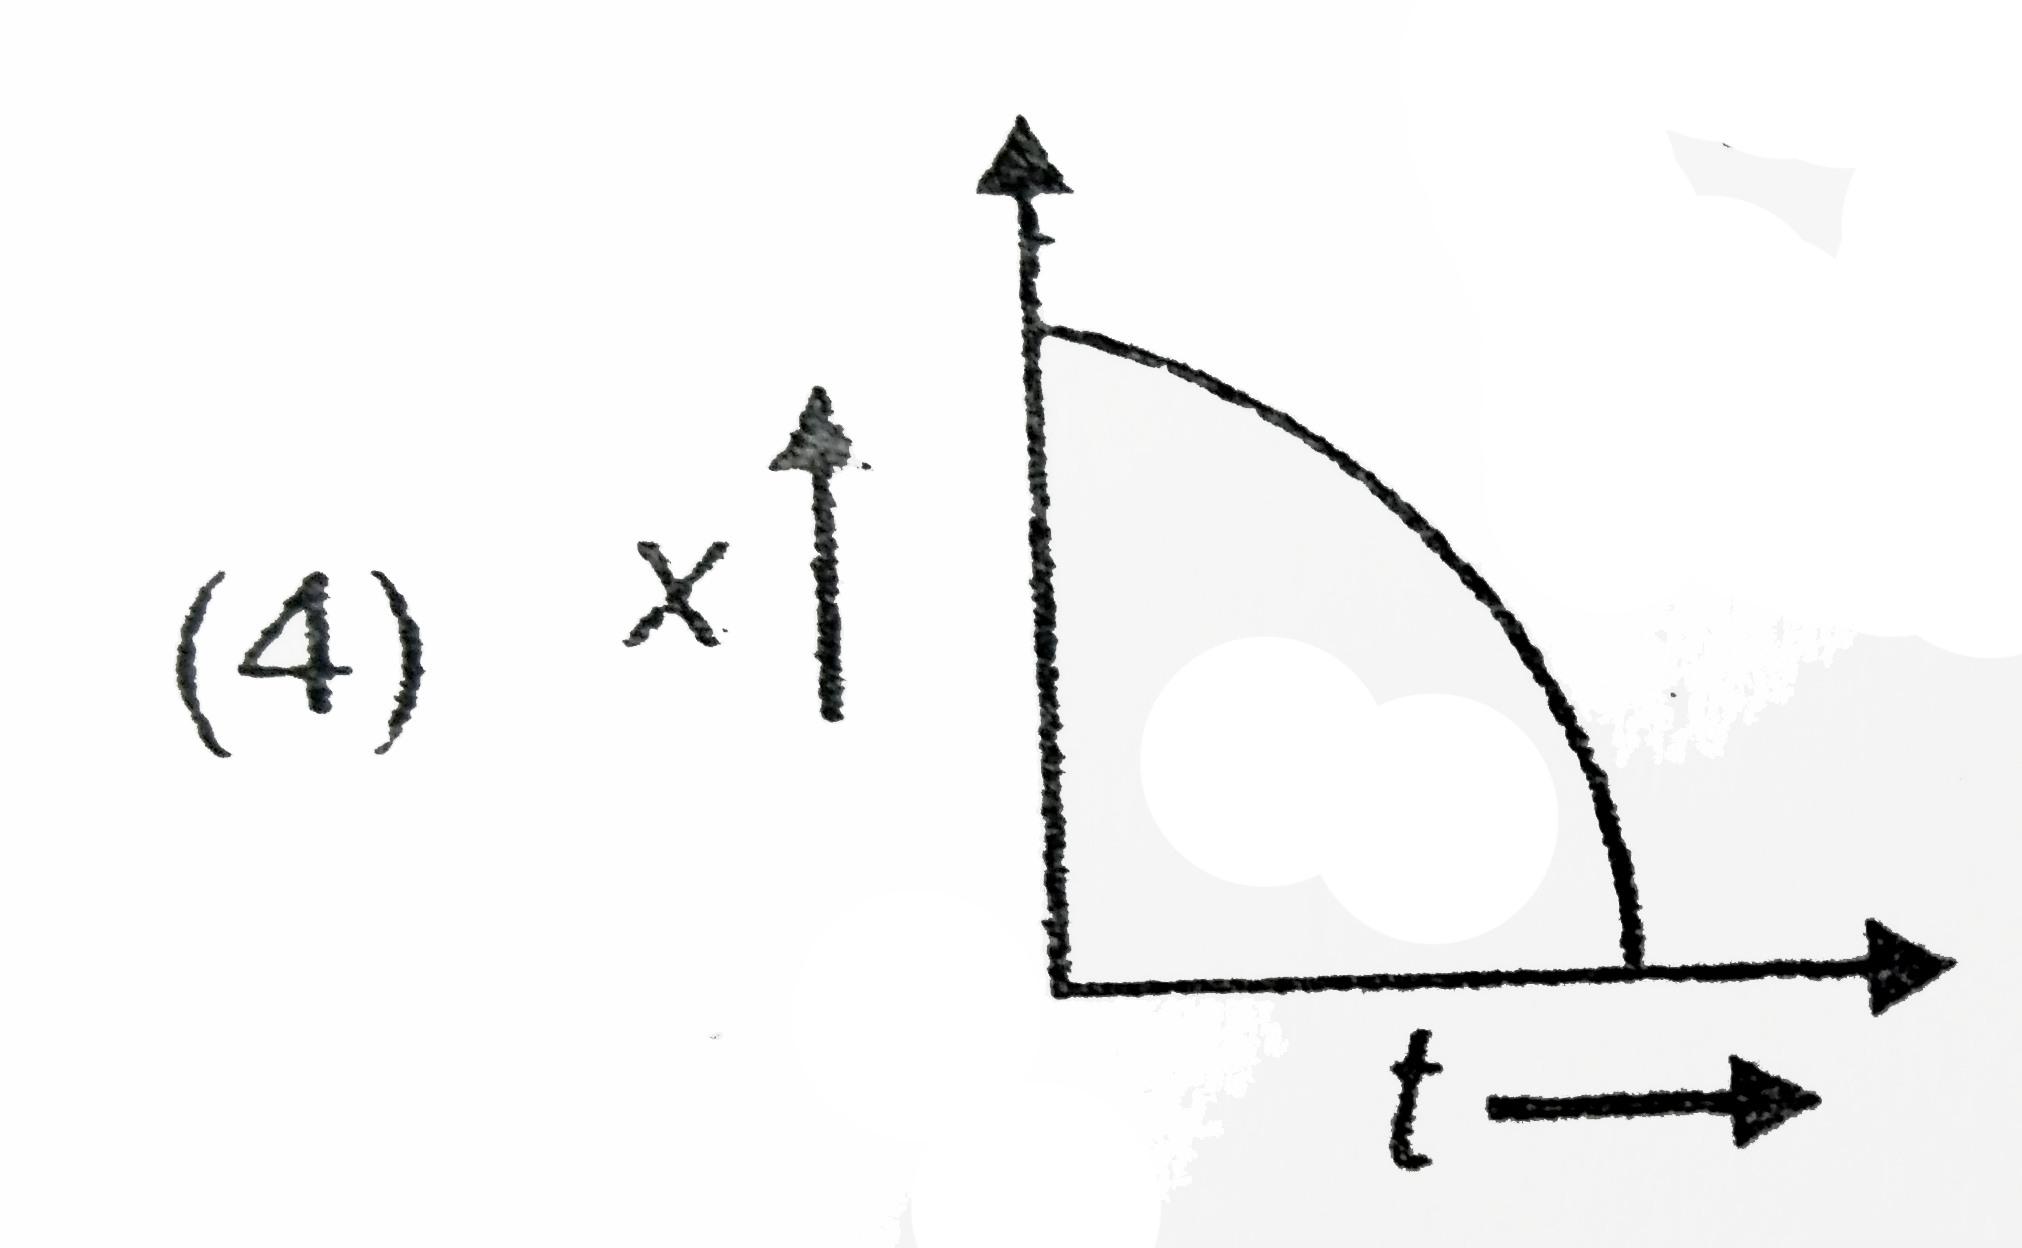
- Question 1 - Select One
Which of the following graphs represents correctly the variations of 0.5mv2max with the intensity of incident radiations of a constant frequency ?
A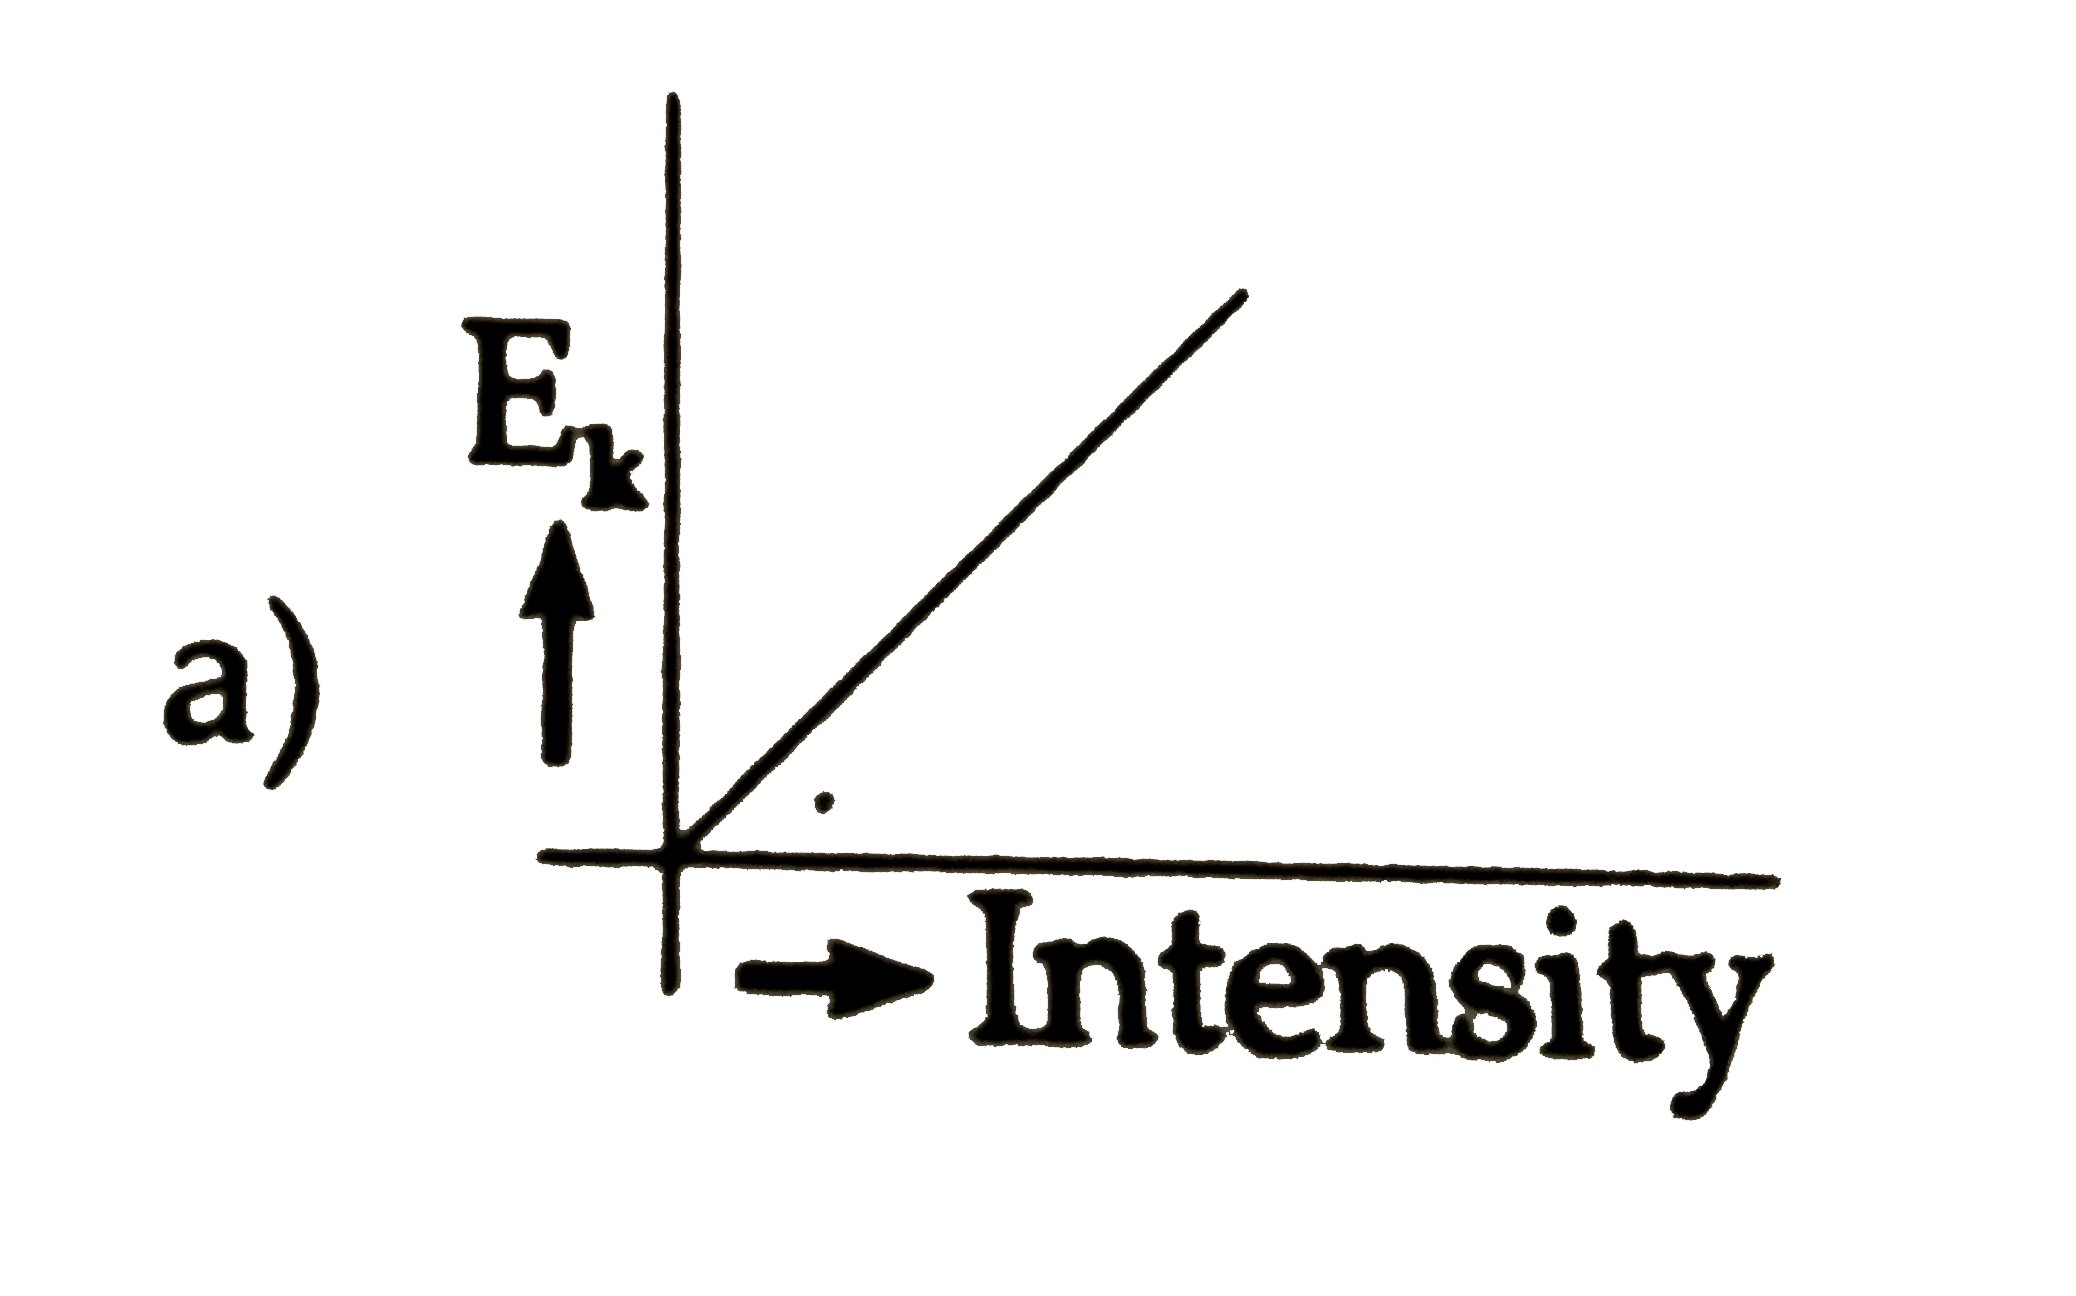 B
B C
C D
D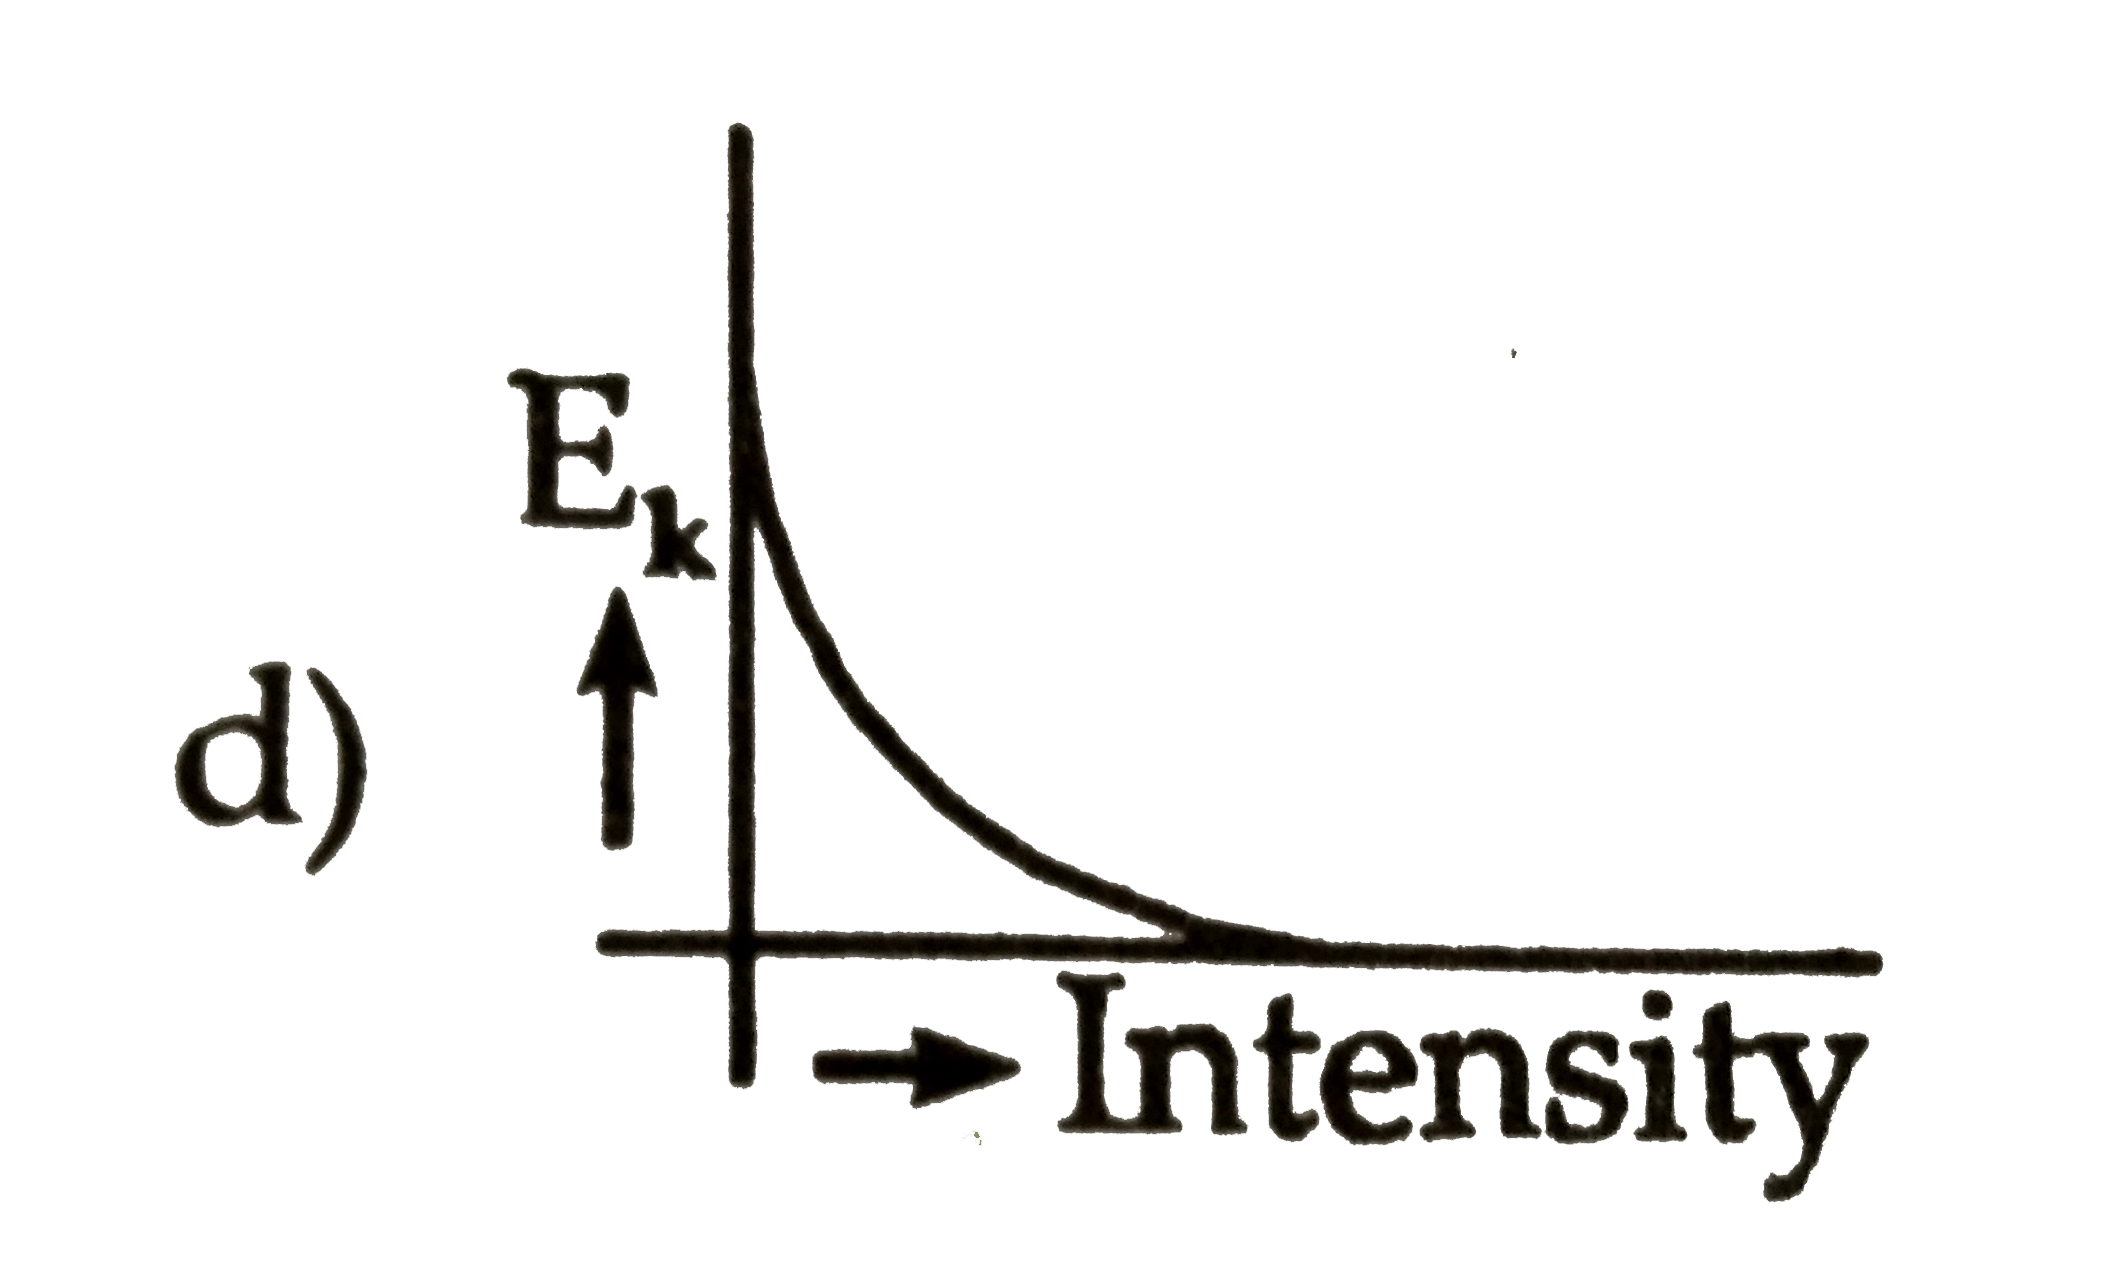
- Question 1 - Select One
Which of the following graphs shows the variation of acceleration due to gravity g with depth h from the surface of the earth ?
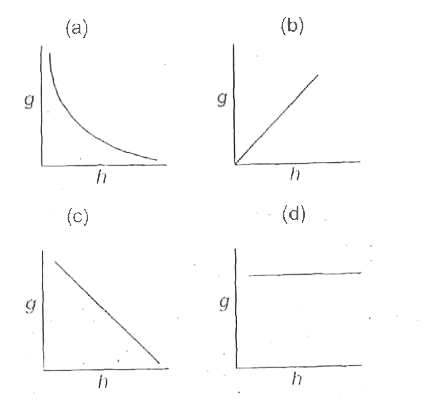 A(a)B(b)C(c )D(d)
 - Question 1 - Select One
A body nis thrown vertically upward. Which of the following graphs correctly/represents the velocity of the body with time?
A B
B C
C D
D
- Question 1 - Select One
A body moves from rest with a constant ac- celeration. Which of the following graphs represents the variation of its kinetic energy (E) with distance travelled (x)?
A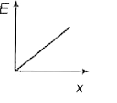 B
B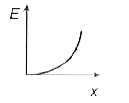 C
C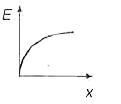 D
D
- Question 1 - Select One
A body moves from rest with a constant acceleration. Which one of the following graphs represents the variation of its kinetic energy K with the distance travelled x?
A B
B C
C D
D
- Question 1 - Select One
A body moves from rest with a constant acceleration. Which one of the following graphs represents the variation of its kinetic energy K with the distance travelled x?
A B
B C
C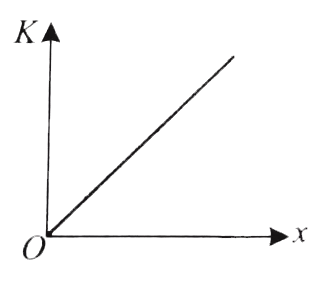 D
D
- Question 1 - Select One
Which of the following graph represents the variation of amount of chemisorption of a gas by a solid with temperature under constant pressure?
A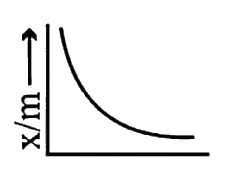 B
B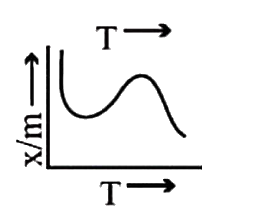 C
C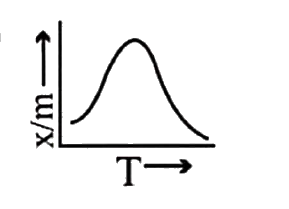 D
D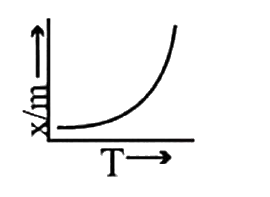
- Question 1 - Select One
Which of the following graphs correctly represents the variation of β=−(dVdP)/V with P for an ideal gas at constant temperature
A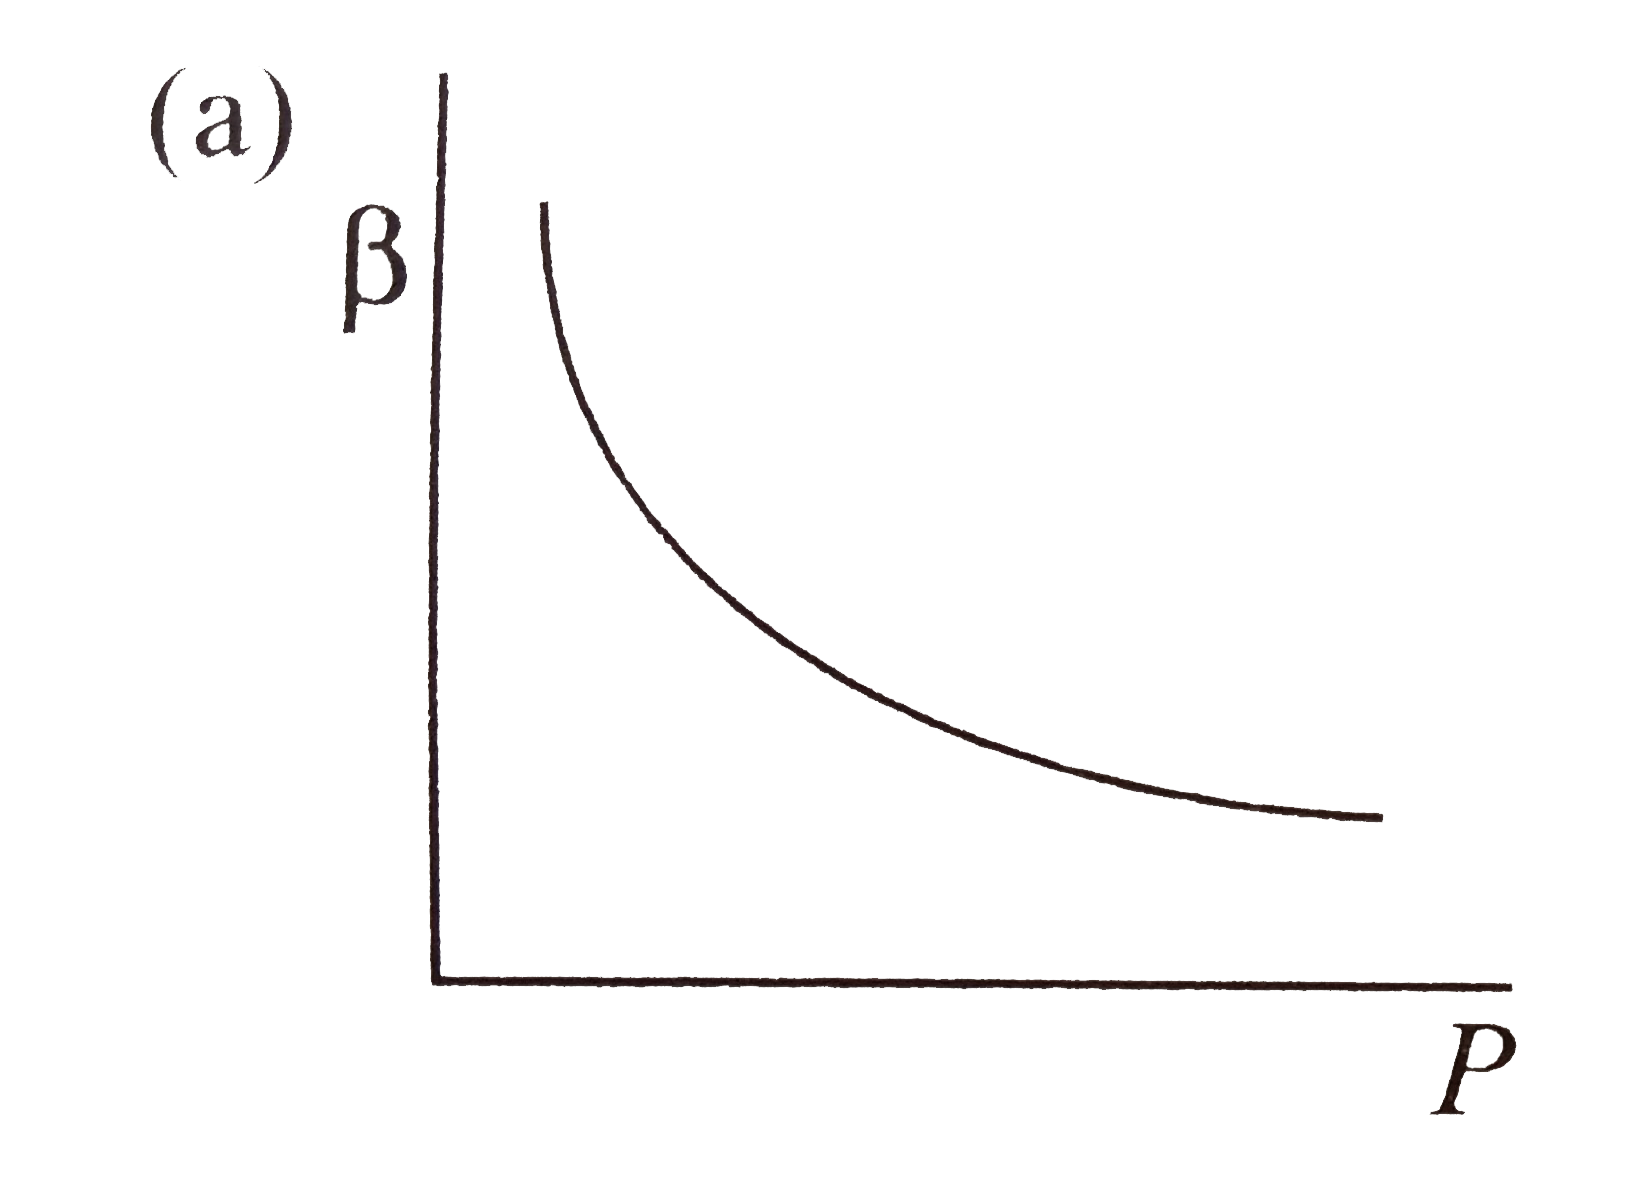 B
B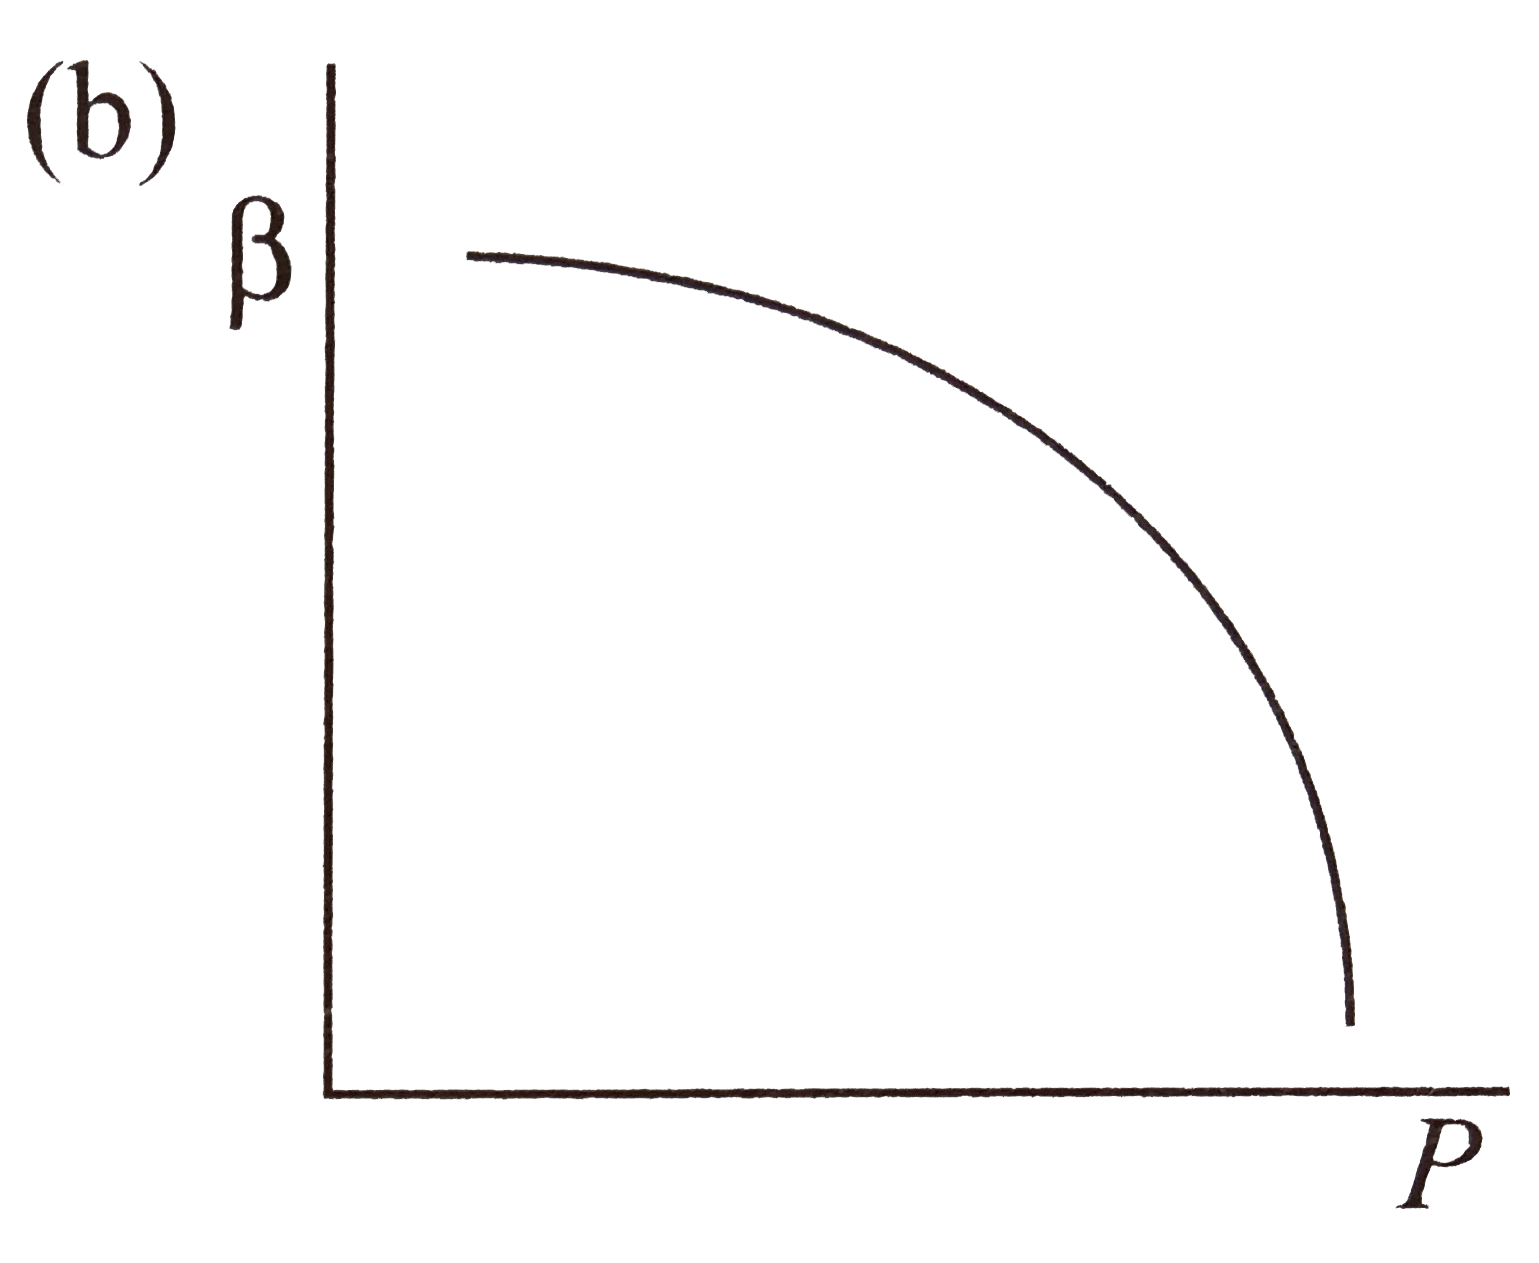 C
C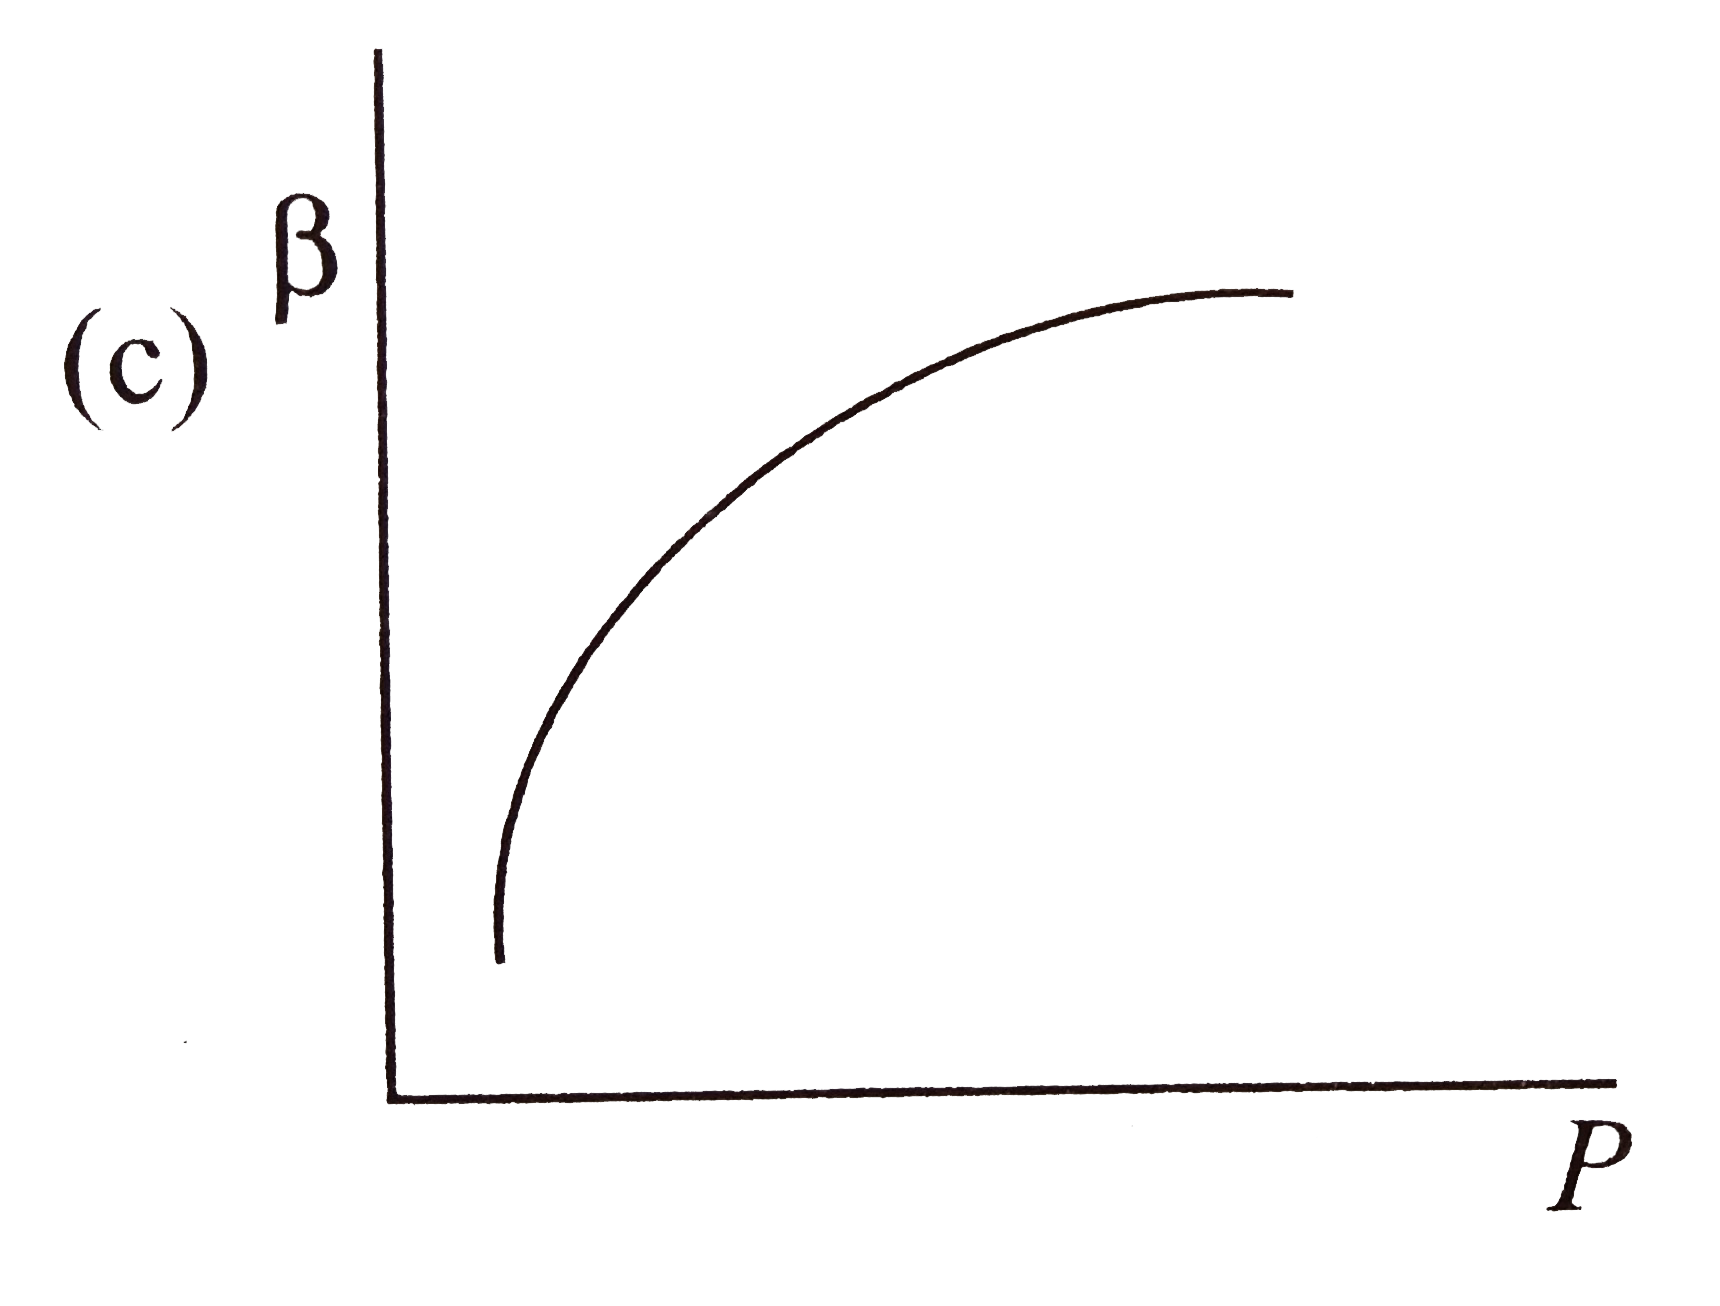 D
D