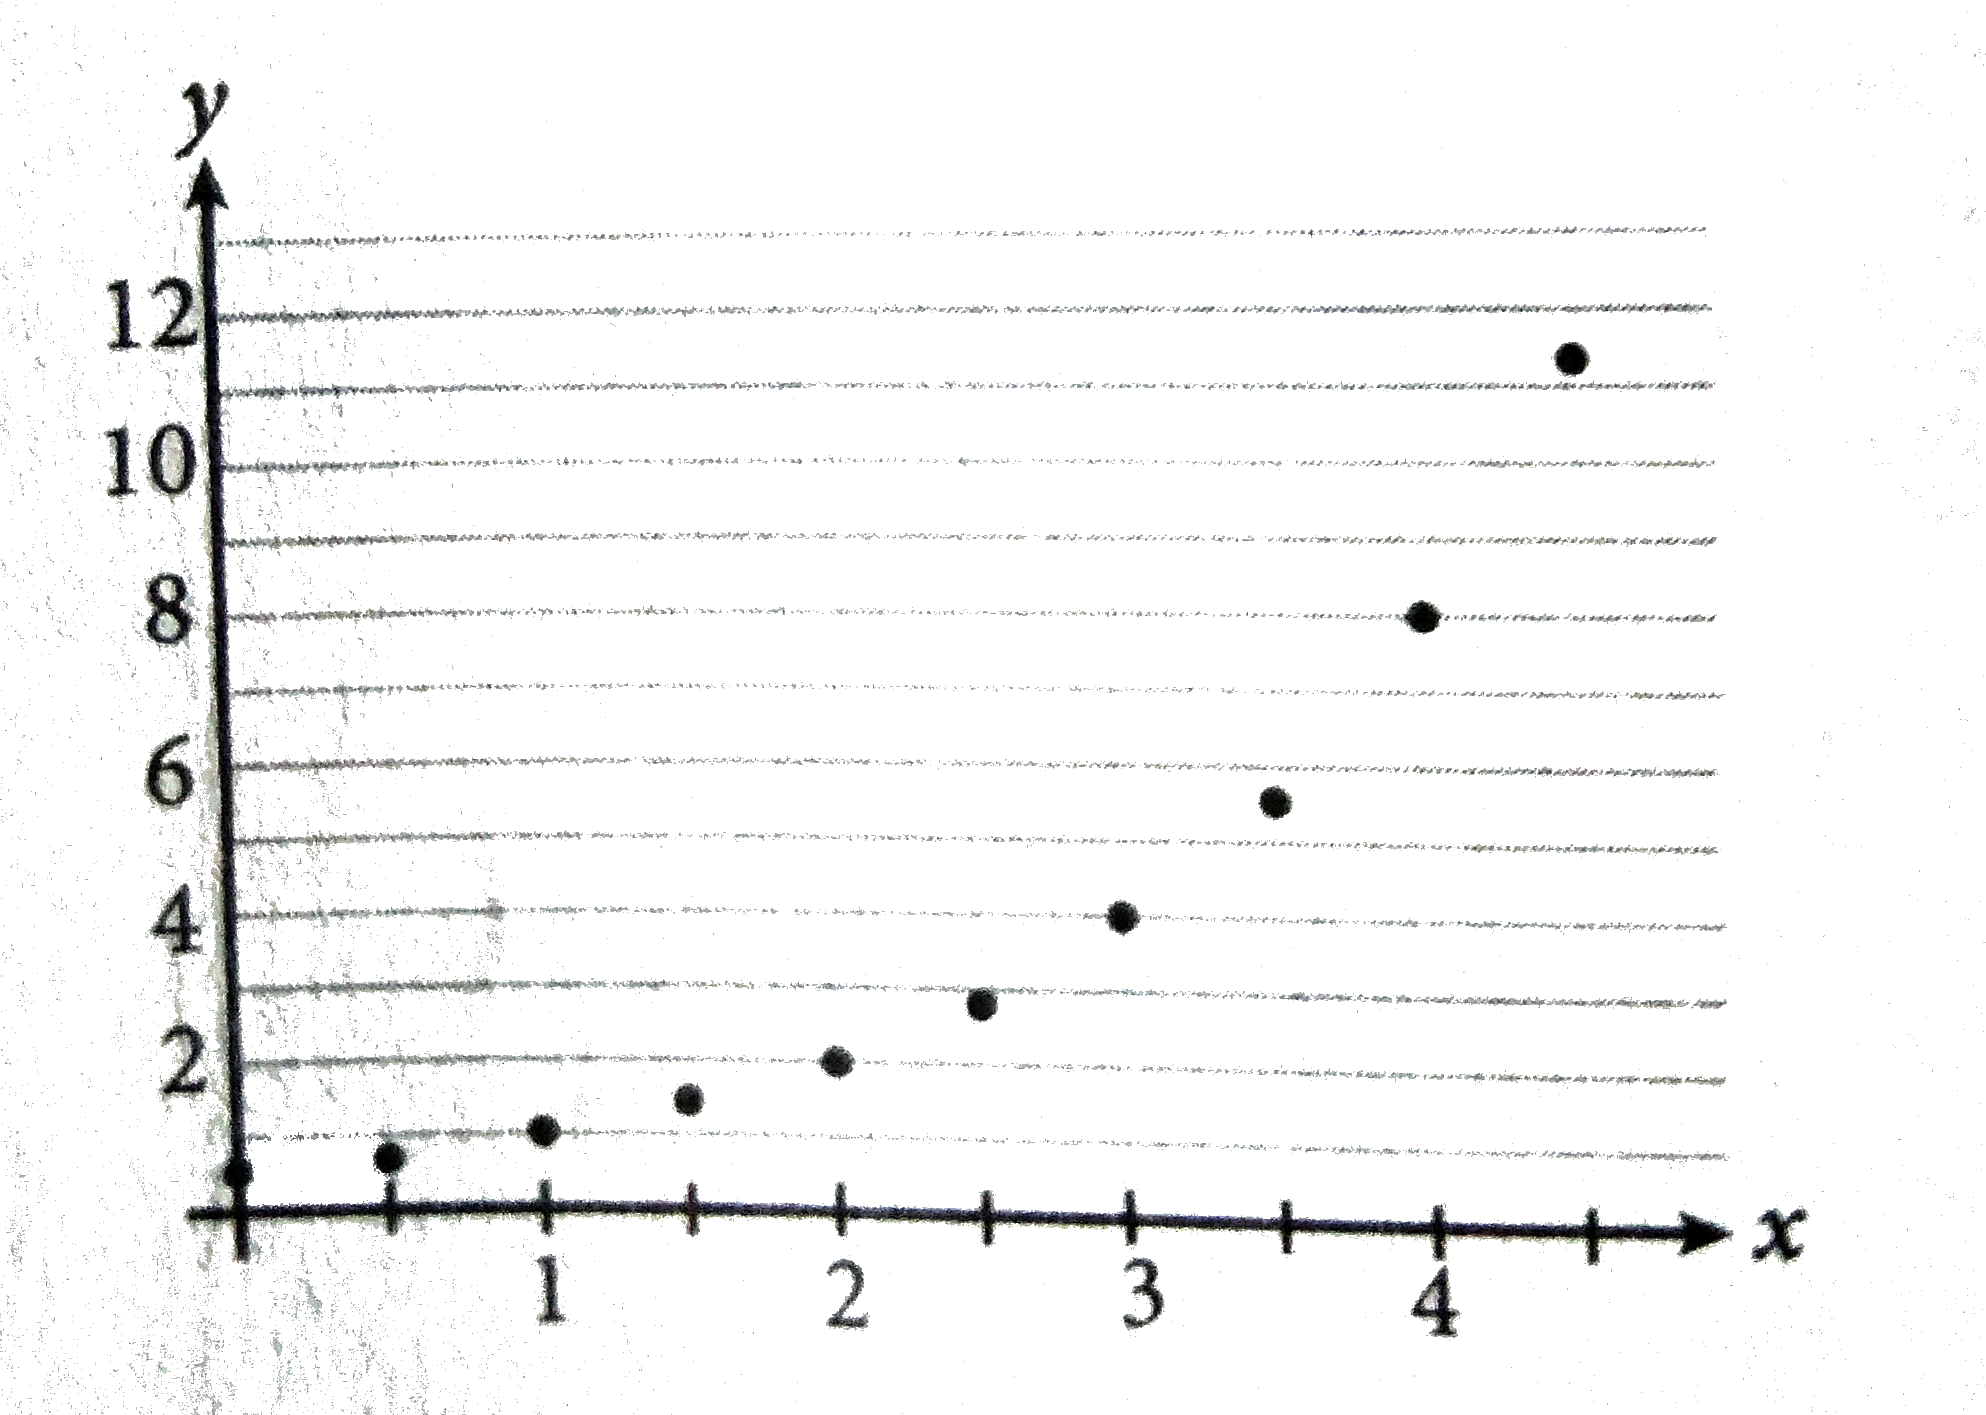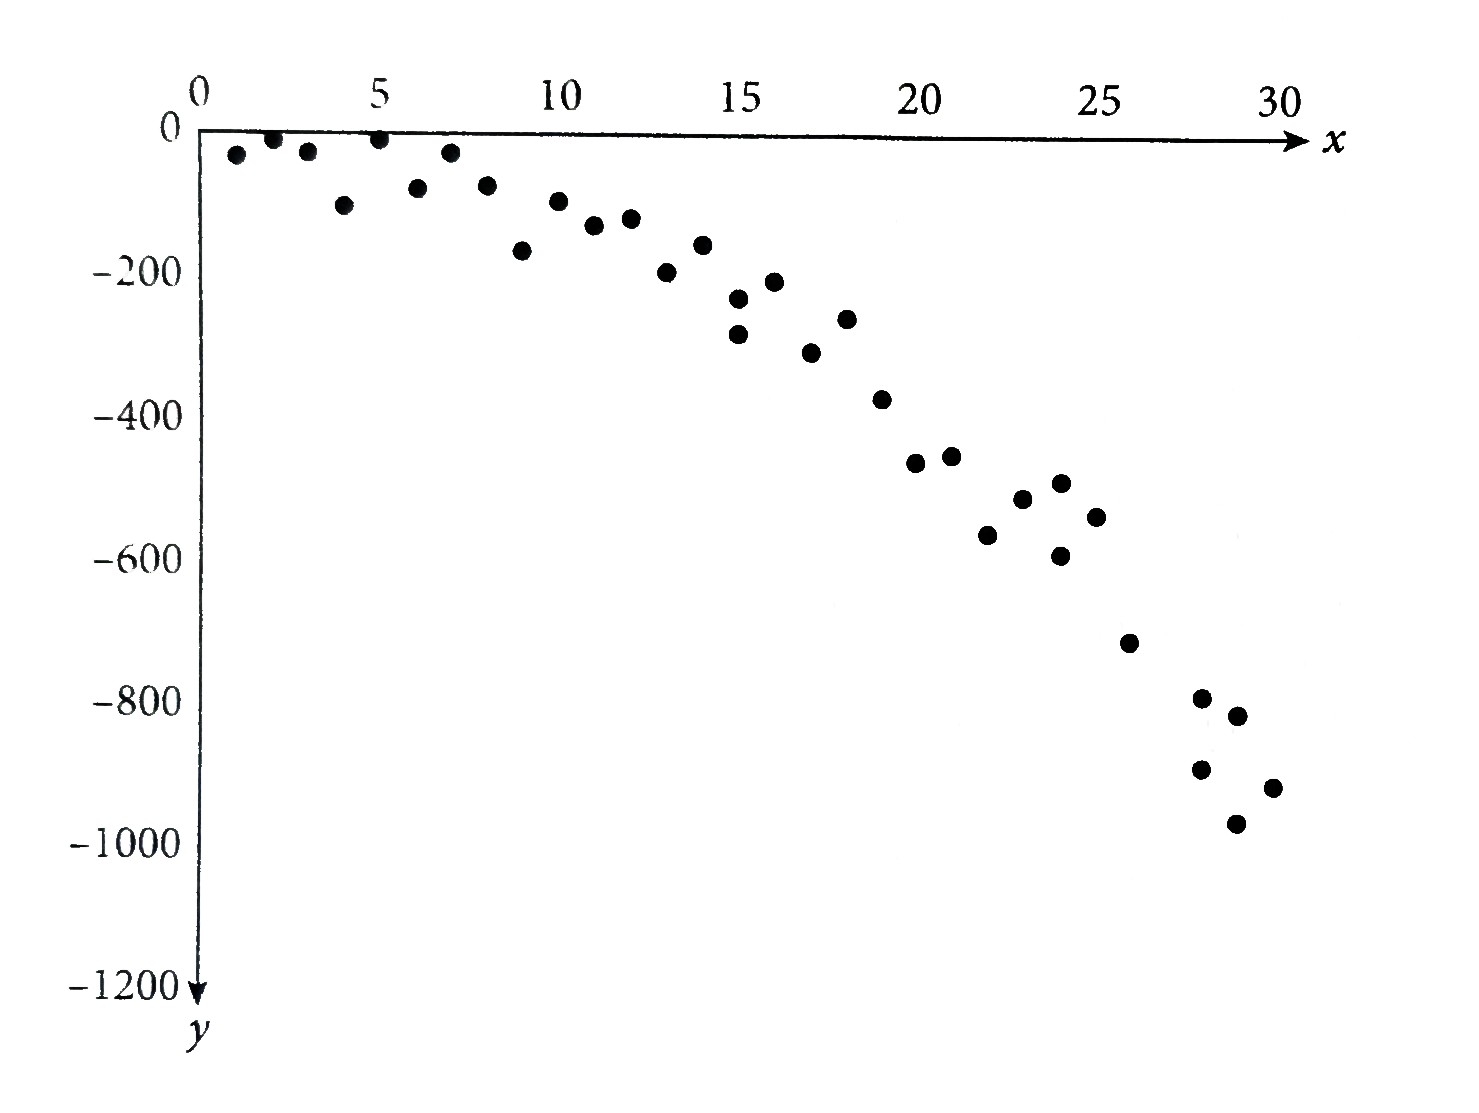
For which of the following values of a and b does the equation y=axb model the data in the scatterplot above ?
a<0,b<0
a<0,b>0
a>0,b<0
a>0,b>0
The correct Answer is:B
The shape of the data is concave down with an increasingly negative slope as x incrreases. The y-values of the data are negative, which indicates a<0. Eliminate (C ) and (D). As x increases, the magnitude of the y-valueds increases. This incdicates b>0. Note if b<0, the y-values would approach 0 as x increases. Thus, (B) is correct.
Topper's Solved these Questions
- BOOK - KAPLANCHAPTER - SCATTERPLOTSEXERCISE - TRY ON YOUR OWN20videos
SCATTERPLOTS
- BOOK - KAPLANCHAPTER - SCATTERPLOTSEXERCISE - LINE OF BEST FIT1videos
SCATTERPLOTS
- BOOK - KAPLANCHAPTER - SAT MATH: TIMING ANS SECTION MANAGEMENT STRATEGIESEXERCISE - TRY ON YOU OWN5videos
SAT MATH: TIMING ANS SECTION MANAGEMENT STRATEGIES
- BOOK - KAPLANCHAPTER - SYSTEMS OF LINEAR EQUATIONSEXERCISE - NUMBER OF POSSIBLE SOLUTIONS1videos
SYSTEMS OF LINEAR EQUATIONS
Similar Questions
Knowledge Check
- Question 1 - Select One
Which of the following values of b satisfies the equation 4,500=900b?
A0.2B5C90D405 - Question 2 - Select One
In the equation above, k is a constant. For which of the following values f k does the equation have at least one re3al solution ?
A2B3C4D5 - Question 3 - Select One
y=3
y=ax2+b
In the system of equations above, a and b are constants. For which of the following values of a and b does the system of equations have exactly two real solutions?Aa = −2, b = 2Ba = −2, b = 4Ca = 2, b = 4Da = 4, b = 3
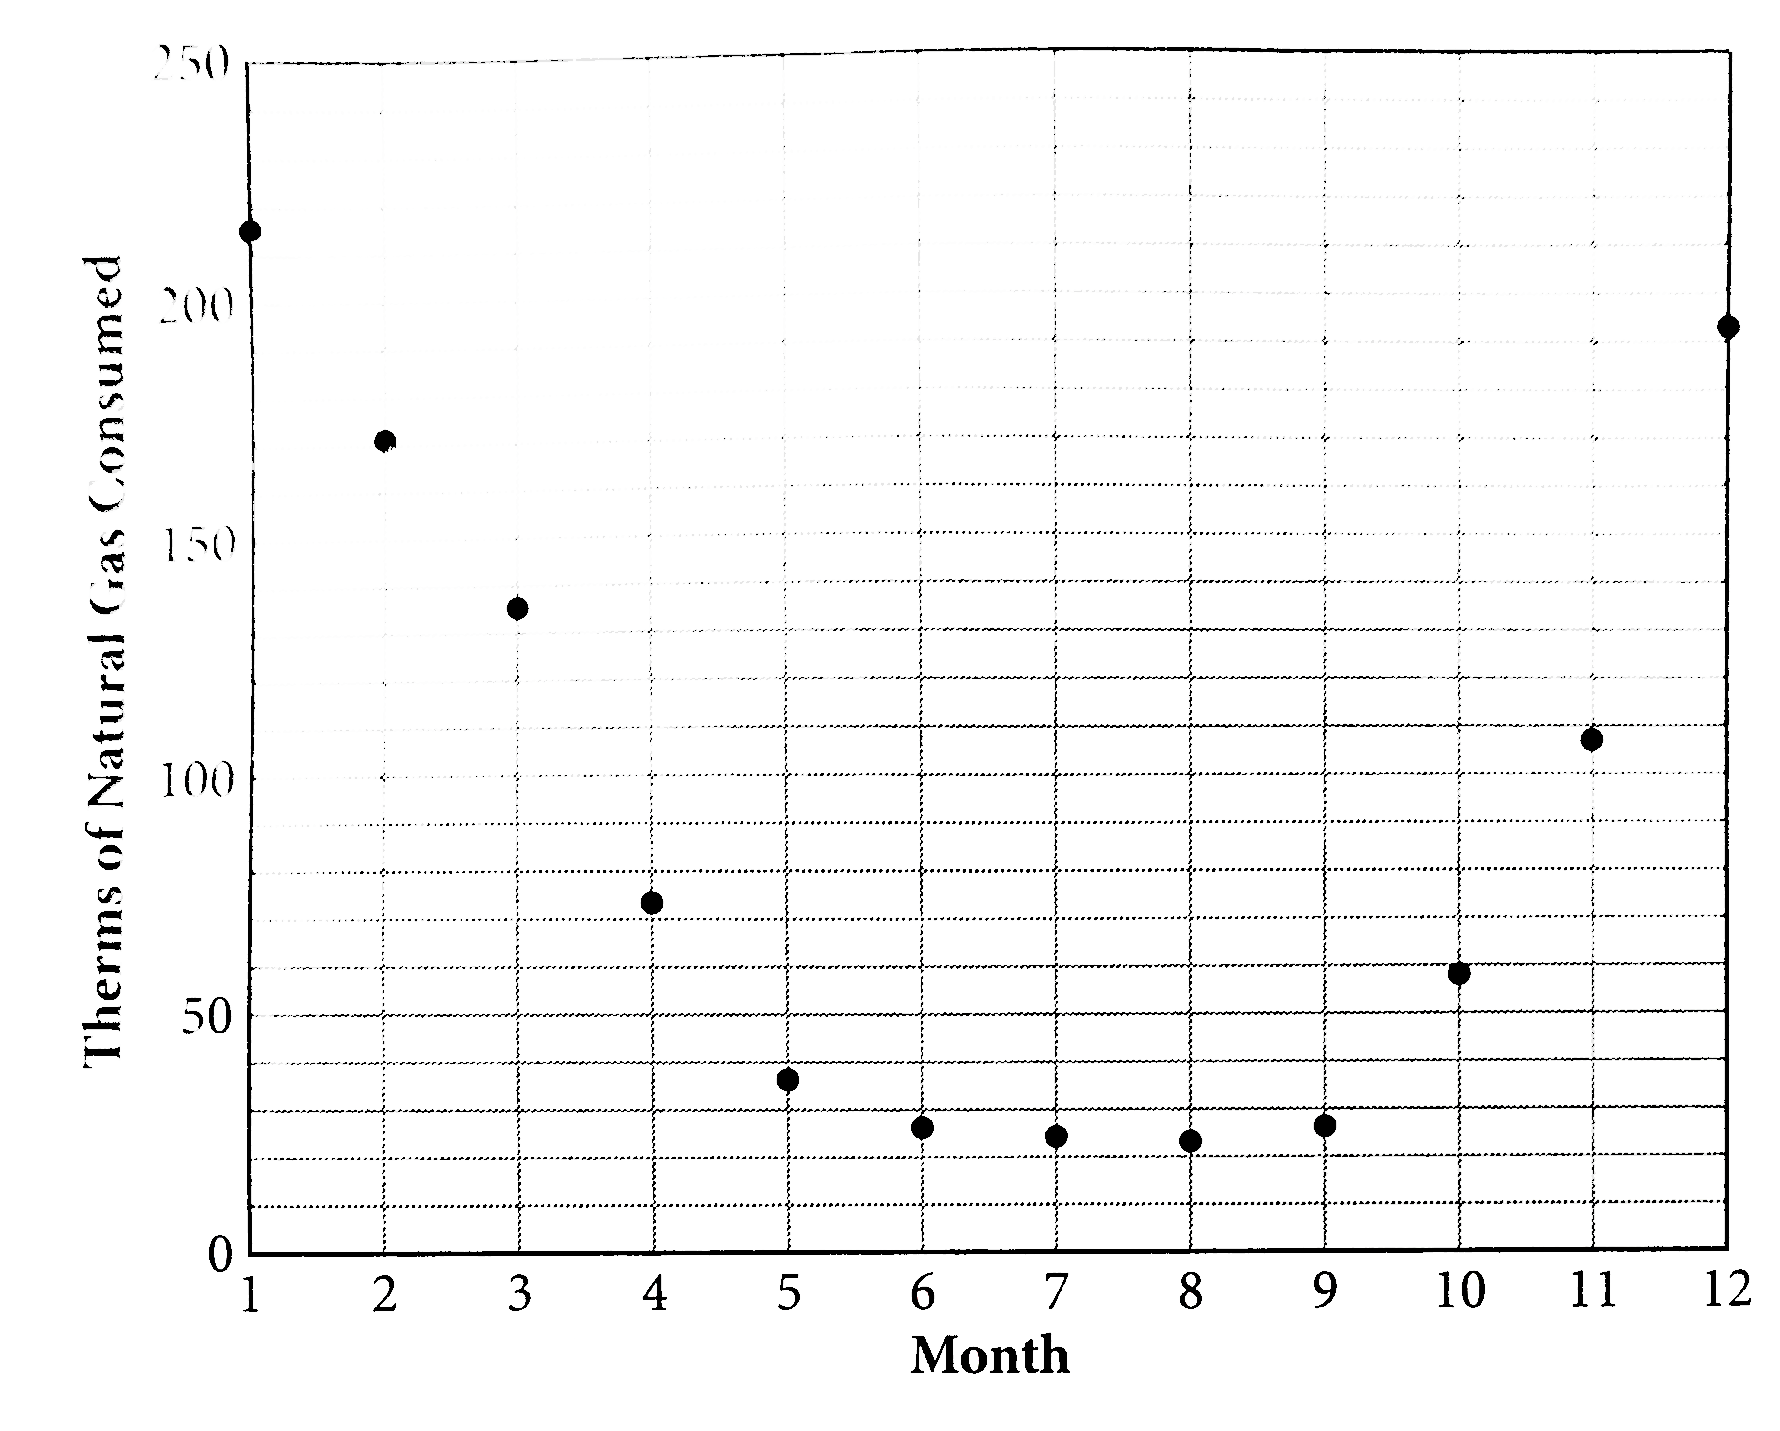
The scatterplot above shows the avrage therms of naturela gas used by residential constomeers over a 12-month period. Of the following equations, which best models the data in the scatterplot ?View SolutionThe scatterplot below compares the average gasoline prices I Boston, per gallon, to the average gasoline prices across the United States, per gallon, during a one-year period from 2017 to 2018.
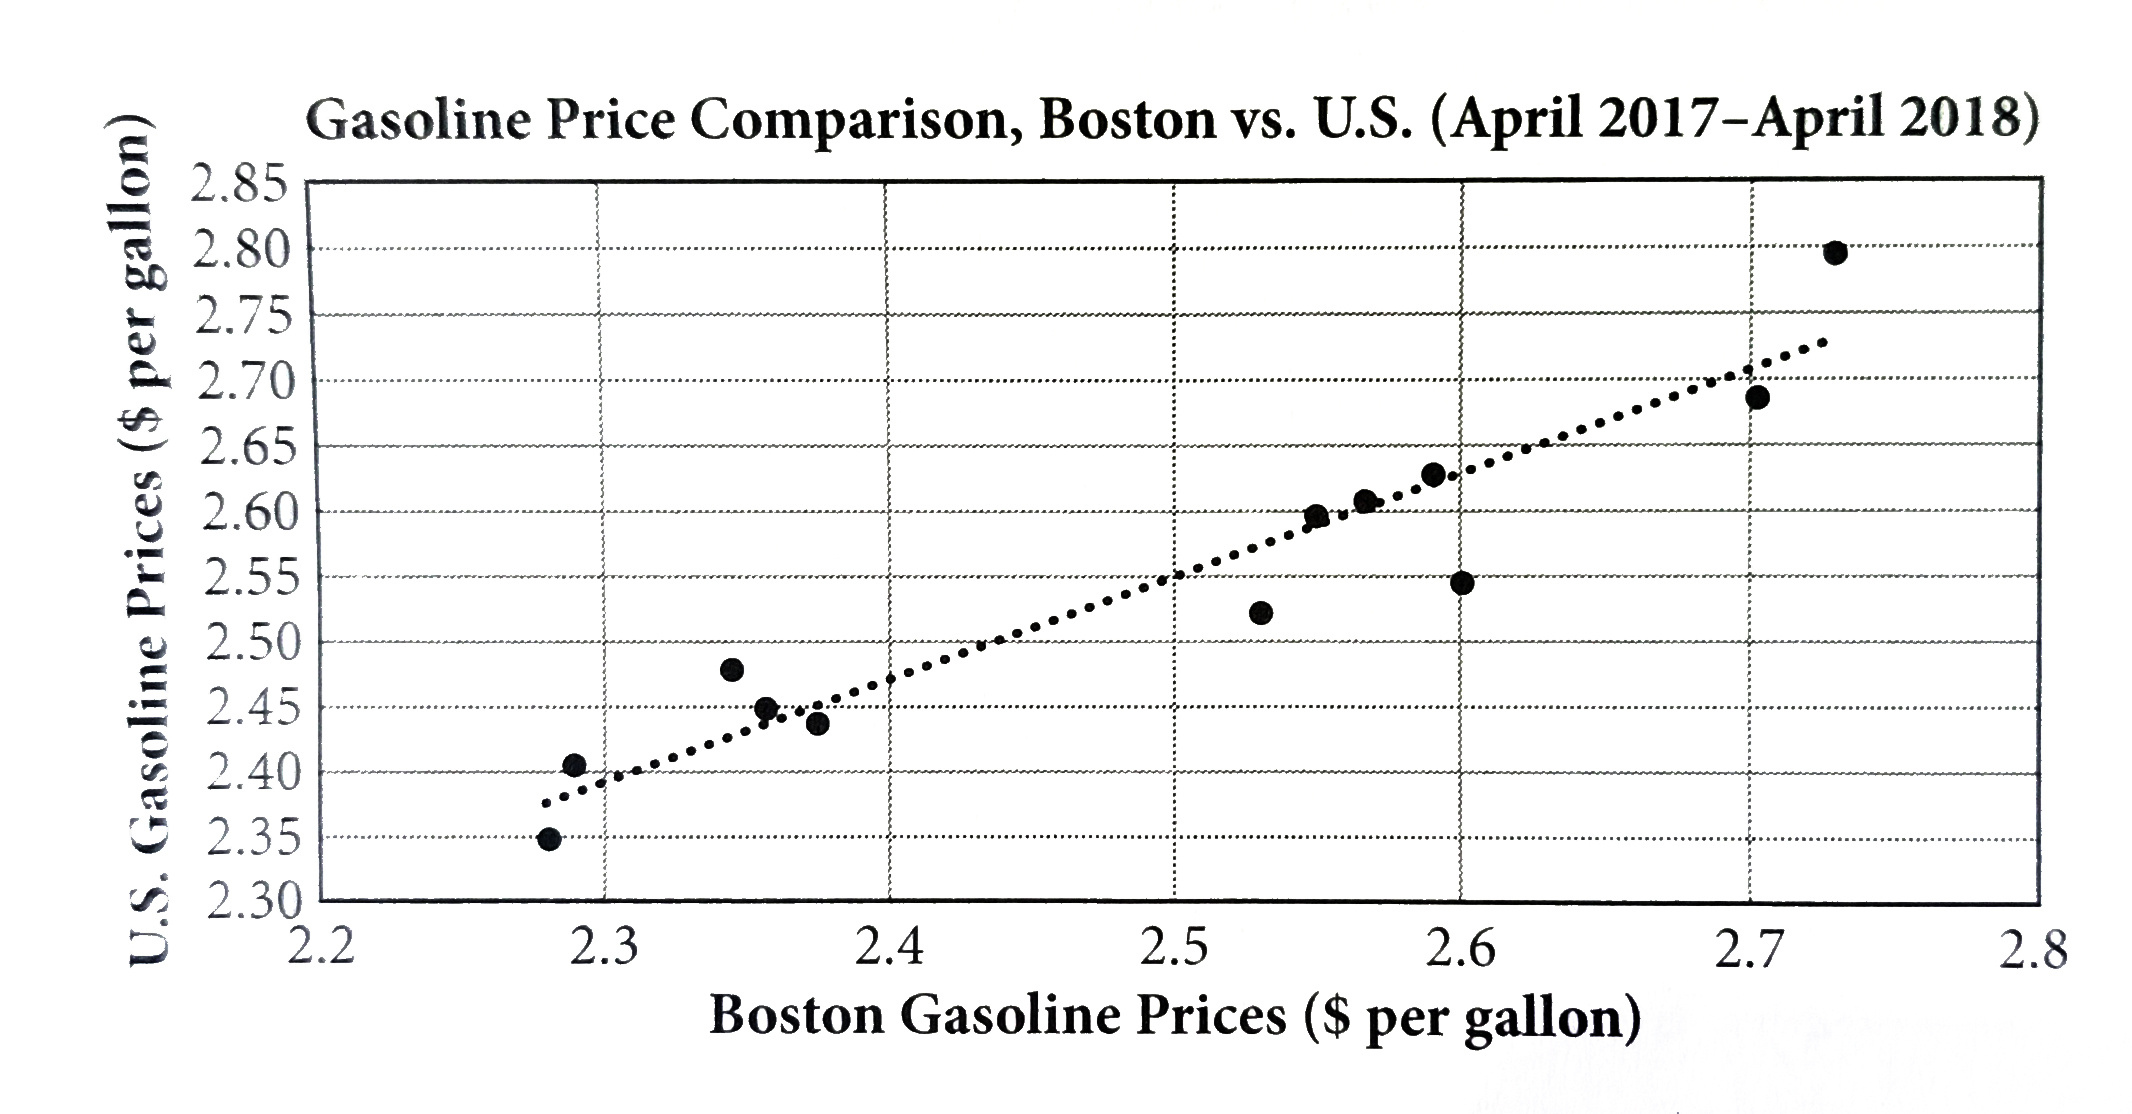
Of the following equations, whihc best modeles the data in the scatterplot ?View SolutionThe scatterplot below shows the amount of electric energy generated, in millions of megawatt-hours, by nuclear sources over a 10‑year period.
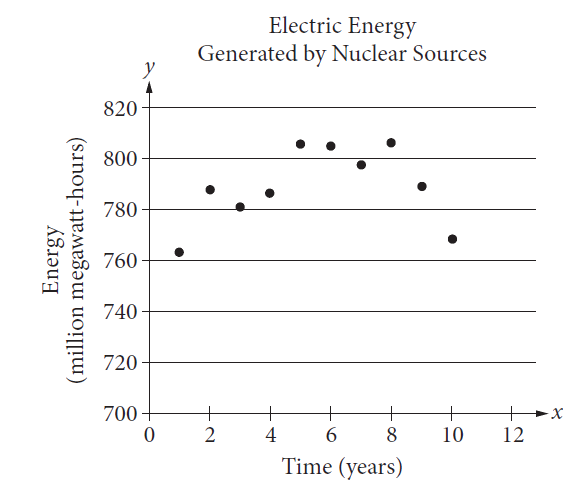
Of the following equations, which best models the data in the scatterplot?View Solution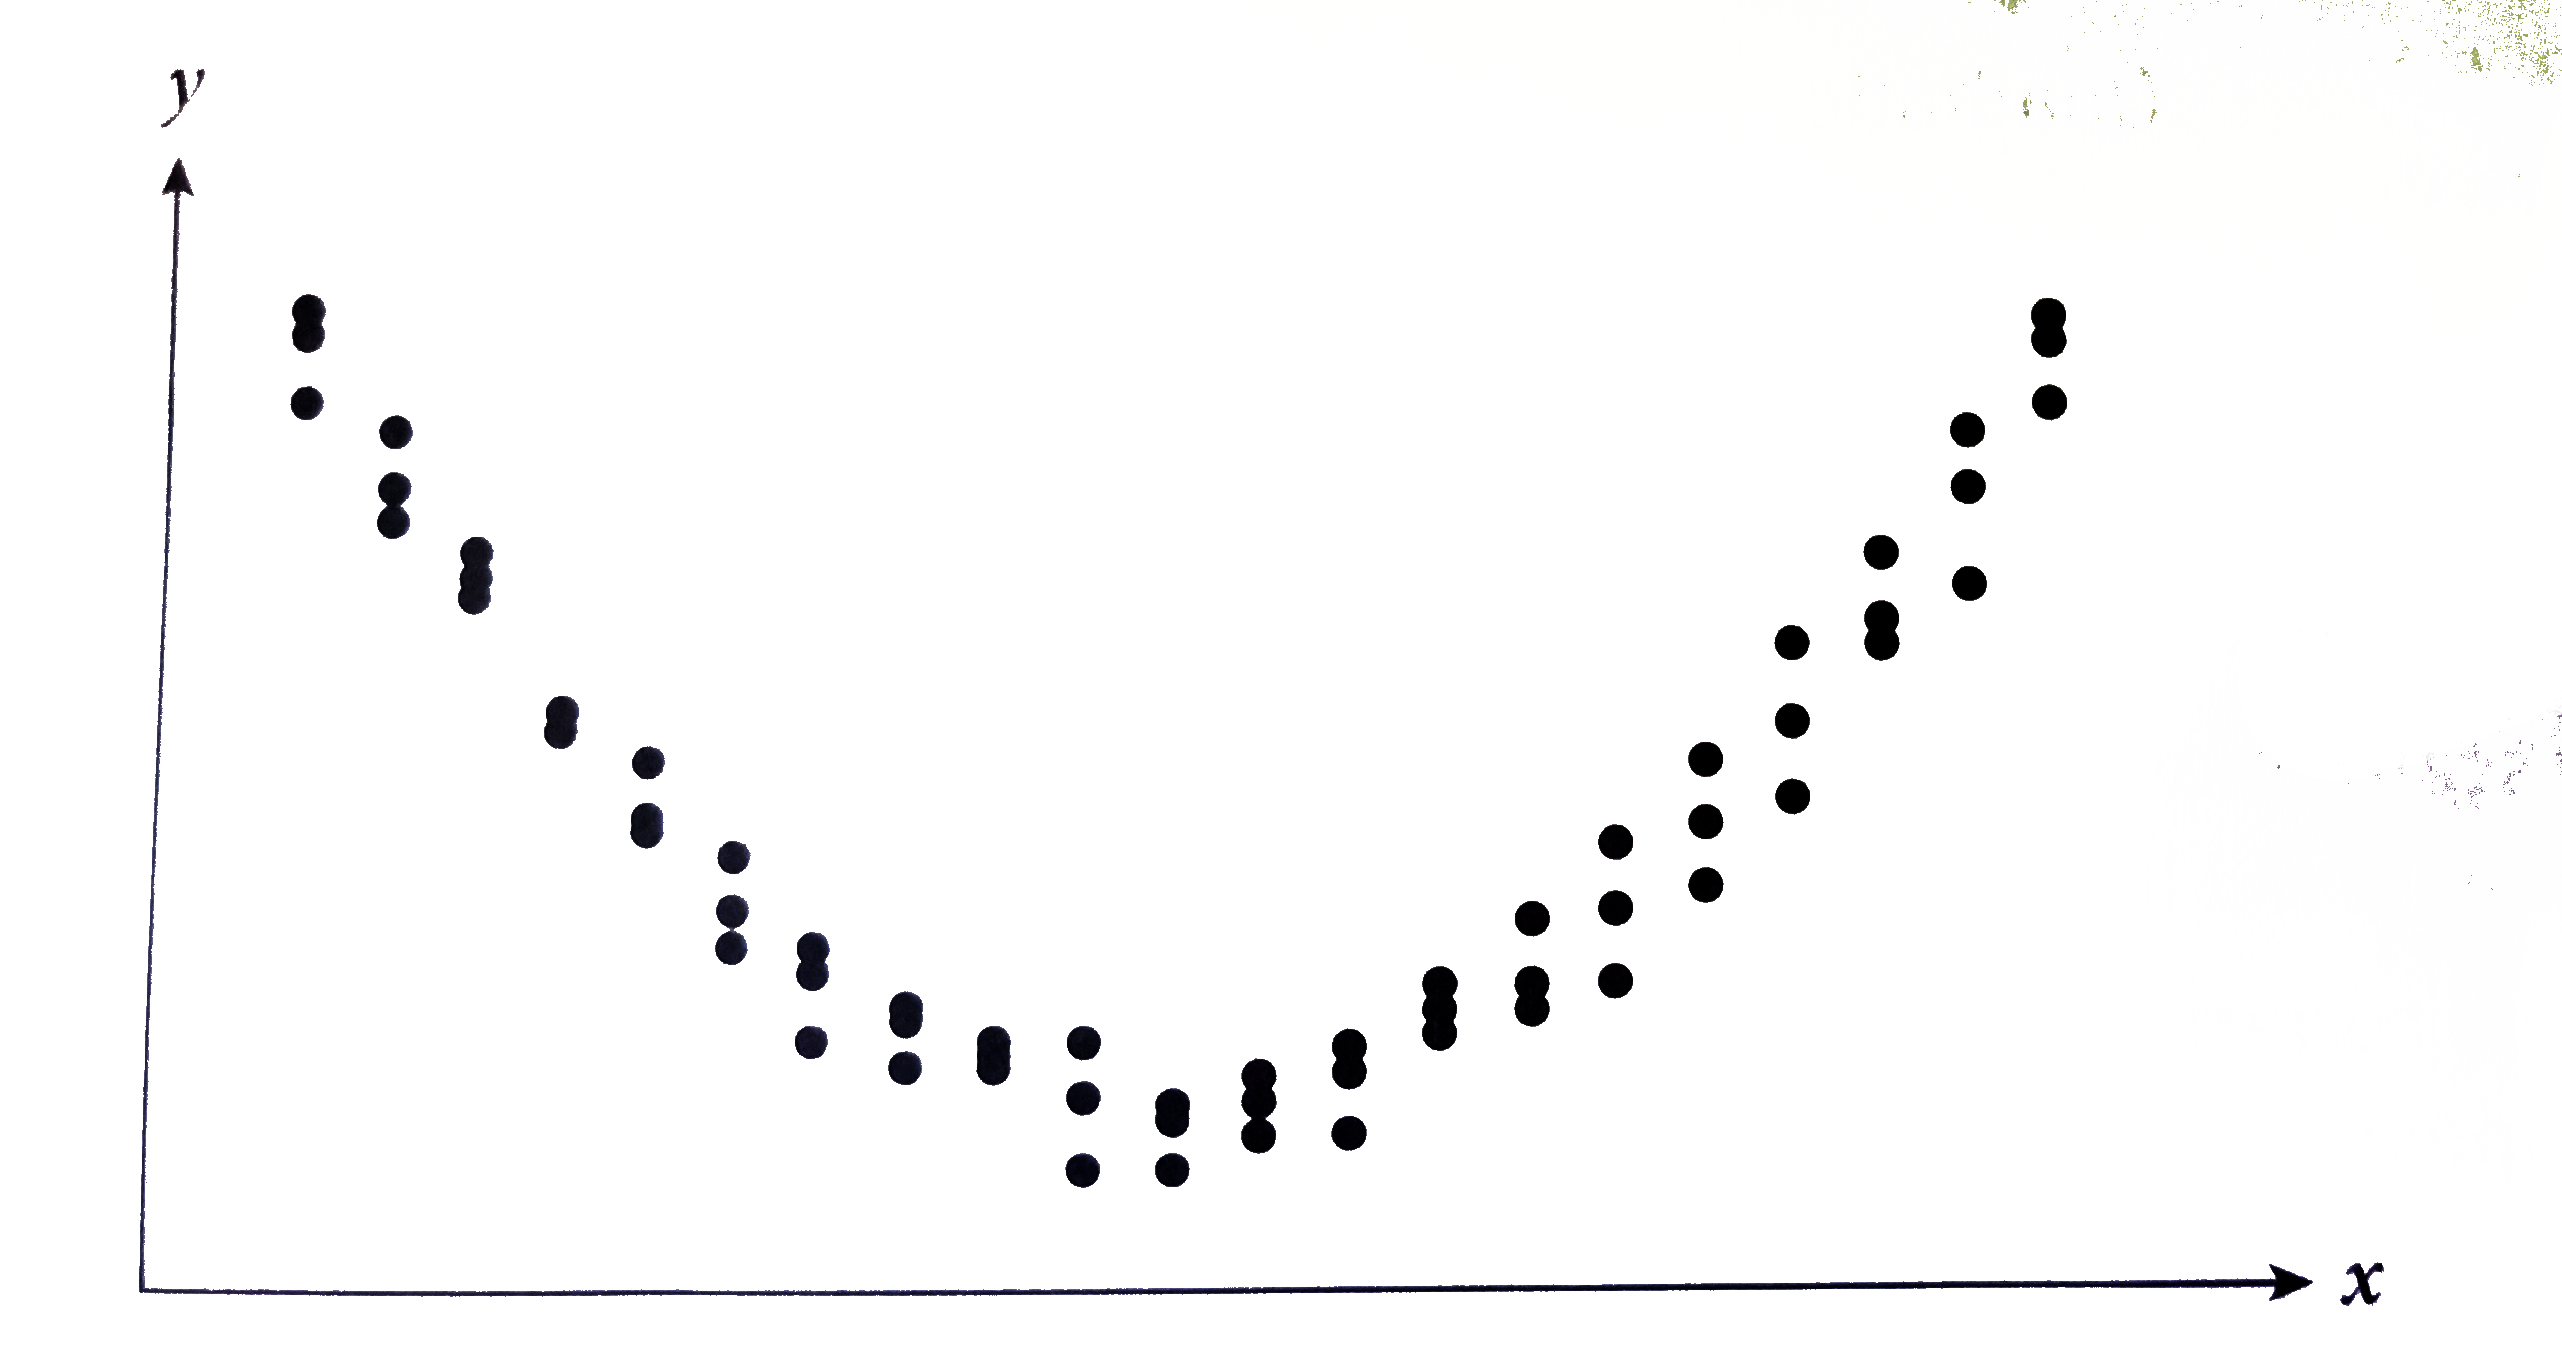
Given that a,b, and c are constants and that a>0, which of the following is the equation for the line of best fit for the above scatterplot ?View SolutionWhich of the following is best modeled using a linear regression equation, y=ax+b, where a<0?
View Solution


