(##KPL_SAT_PRD_PLS_C09_E01_006_Q01.png" width="80%">
Scientists measured the concentration of an exprerimental medication in blood samples over time. If a quadratic function is used to model the data, which of following best explains th meaning of the vertex ?
The average maximum medicine concentration in the blood sample is 7.5 units.
The average maximum medicine concentration is more than 20 units.
The average maximum medicine concentration in the blood samples occurs around 2.5 minutes.
The average maximum medicine concentration in the blood sample occurs bgetween 5 and 10 minutes.
The correct Answer is:D
To solve the question about the meaning of the vertex in the context of a quadratic function modeling the concentration of an experimental medication in blood samples over time, we will follow these steps:
1. Understanding the Quadratic Function:
- A quadratic function is typically represented in the form f(x)=ax2+bx+c, which graphs as a parabola. The vertex of this parabola represents either a maximum or minimum point depending on the direction it opens (upwards or downwards).
Hint: Recall that the vertex of a parabola can indicate the maximum or minimum value of the function.
2. Identifying the Context:
- In this scenario, the scientists are measuring the concentration of a medication over time. The concentration of the medication is expected to rise to a peak (maximum) and then fall, which suggests that the parabola opens downwards.
Hint: Think about how medication concentration might behave over time—usually, it increases to a peak and then decreases.
3. Finding the Vertex:
- The vertex of the quadratic function in this context represents the point in time when the concentration of the medication in the blood is at its highest.
Hint: The vertex will give you the time at which the concentration is maximized.
4. Analyzing the Given Options:
- The options provided in the question need to be evaluated based on the information derived from the vertex.
- The vertex indicates the maximum concentration of the medication, which is approximately 2.6 units, occurring between 5 to 10 minutes.
Hint: Compare the options to the information about the vertex to determine which one accurately reflects the maximum concentration and the time it occurs.
5. Selecting the Correct Answer:
- The correct interpretation of the vertex is that it indicates the average maximum concentration of the medication in the blood occurs around 5 to 10 minutes. Therefore, option D is the most appropriate answer.
Hint: Look for the option that aligns with both the maximum concentration value and the time frame indicated by the vertex.
Final Answer:
The average maximum medicine concentration in blood occurs around 5 to 10 minutes (Option D).
- A quadratic function is typically represented in the form f(x)=ax2+bx+c, which graphs as a parabola. The vertex of this parabola represents either a maximum or minimum point depending on the direction it opens (upwards or downwards).
- In this scenario, the scientists are measuring the concentration of a medication over time. The concentration of the medication is expected to rise to a peak (maximum) and then fall, which suggests that the parabola opens downwards.
- The vertex of the quadratic function in this context represents the point in time when the concentration of the medication in the blood is at its highest.
- The options provided in the question need to be evaluated based on the information derived from the vertex.
- The vertex indicates the maximum concentration of the medication, which is approximately 2.6 units, occurring between 5 to 10 minutes.
- The correct interpretation of the vertex is that it indicates the average maximum concentration of the medication in the blood occurs around 5 to 10 minutes. Therefore, option D is the most appropriate answer.
The average maximum medicine concentration in blood occurs around 5 to 10 minutes (Option D).
Topper's Solved these Questions
- BOOK - KAPLANCHAPTER - SCATTERPLOTSEXERCISE - TRY ON YOUR OWN20videos
SCATTERPLOTS
- BOOK - KAPLANCHAPTER - SCATTERPLOTSEXERCISE - LINE OF BEST FIT1videos
SCATTERPLOTS
- BOOK - KAPLANCHAPTER - SAT MATH: TIMING ANS SECTION MANAGEMENT STRATEGIESEXERCISE - TRY ON YOU OWN5videos
SAT MATH: TIMING ANS SECTION MANAGEMENT STRATEGIES
- BOOK - KAPLANCHAPTER - SYSTEMS OF LINEAR EQUATIONSEXERCISE - NUMBER OF POSSIBLE SOLUTIONS1videos
SYSTEMS OF LINEAR EQUATIONS
Similar Questions
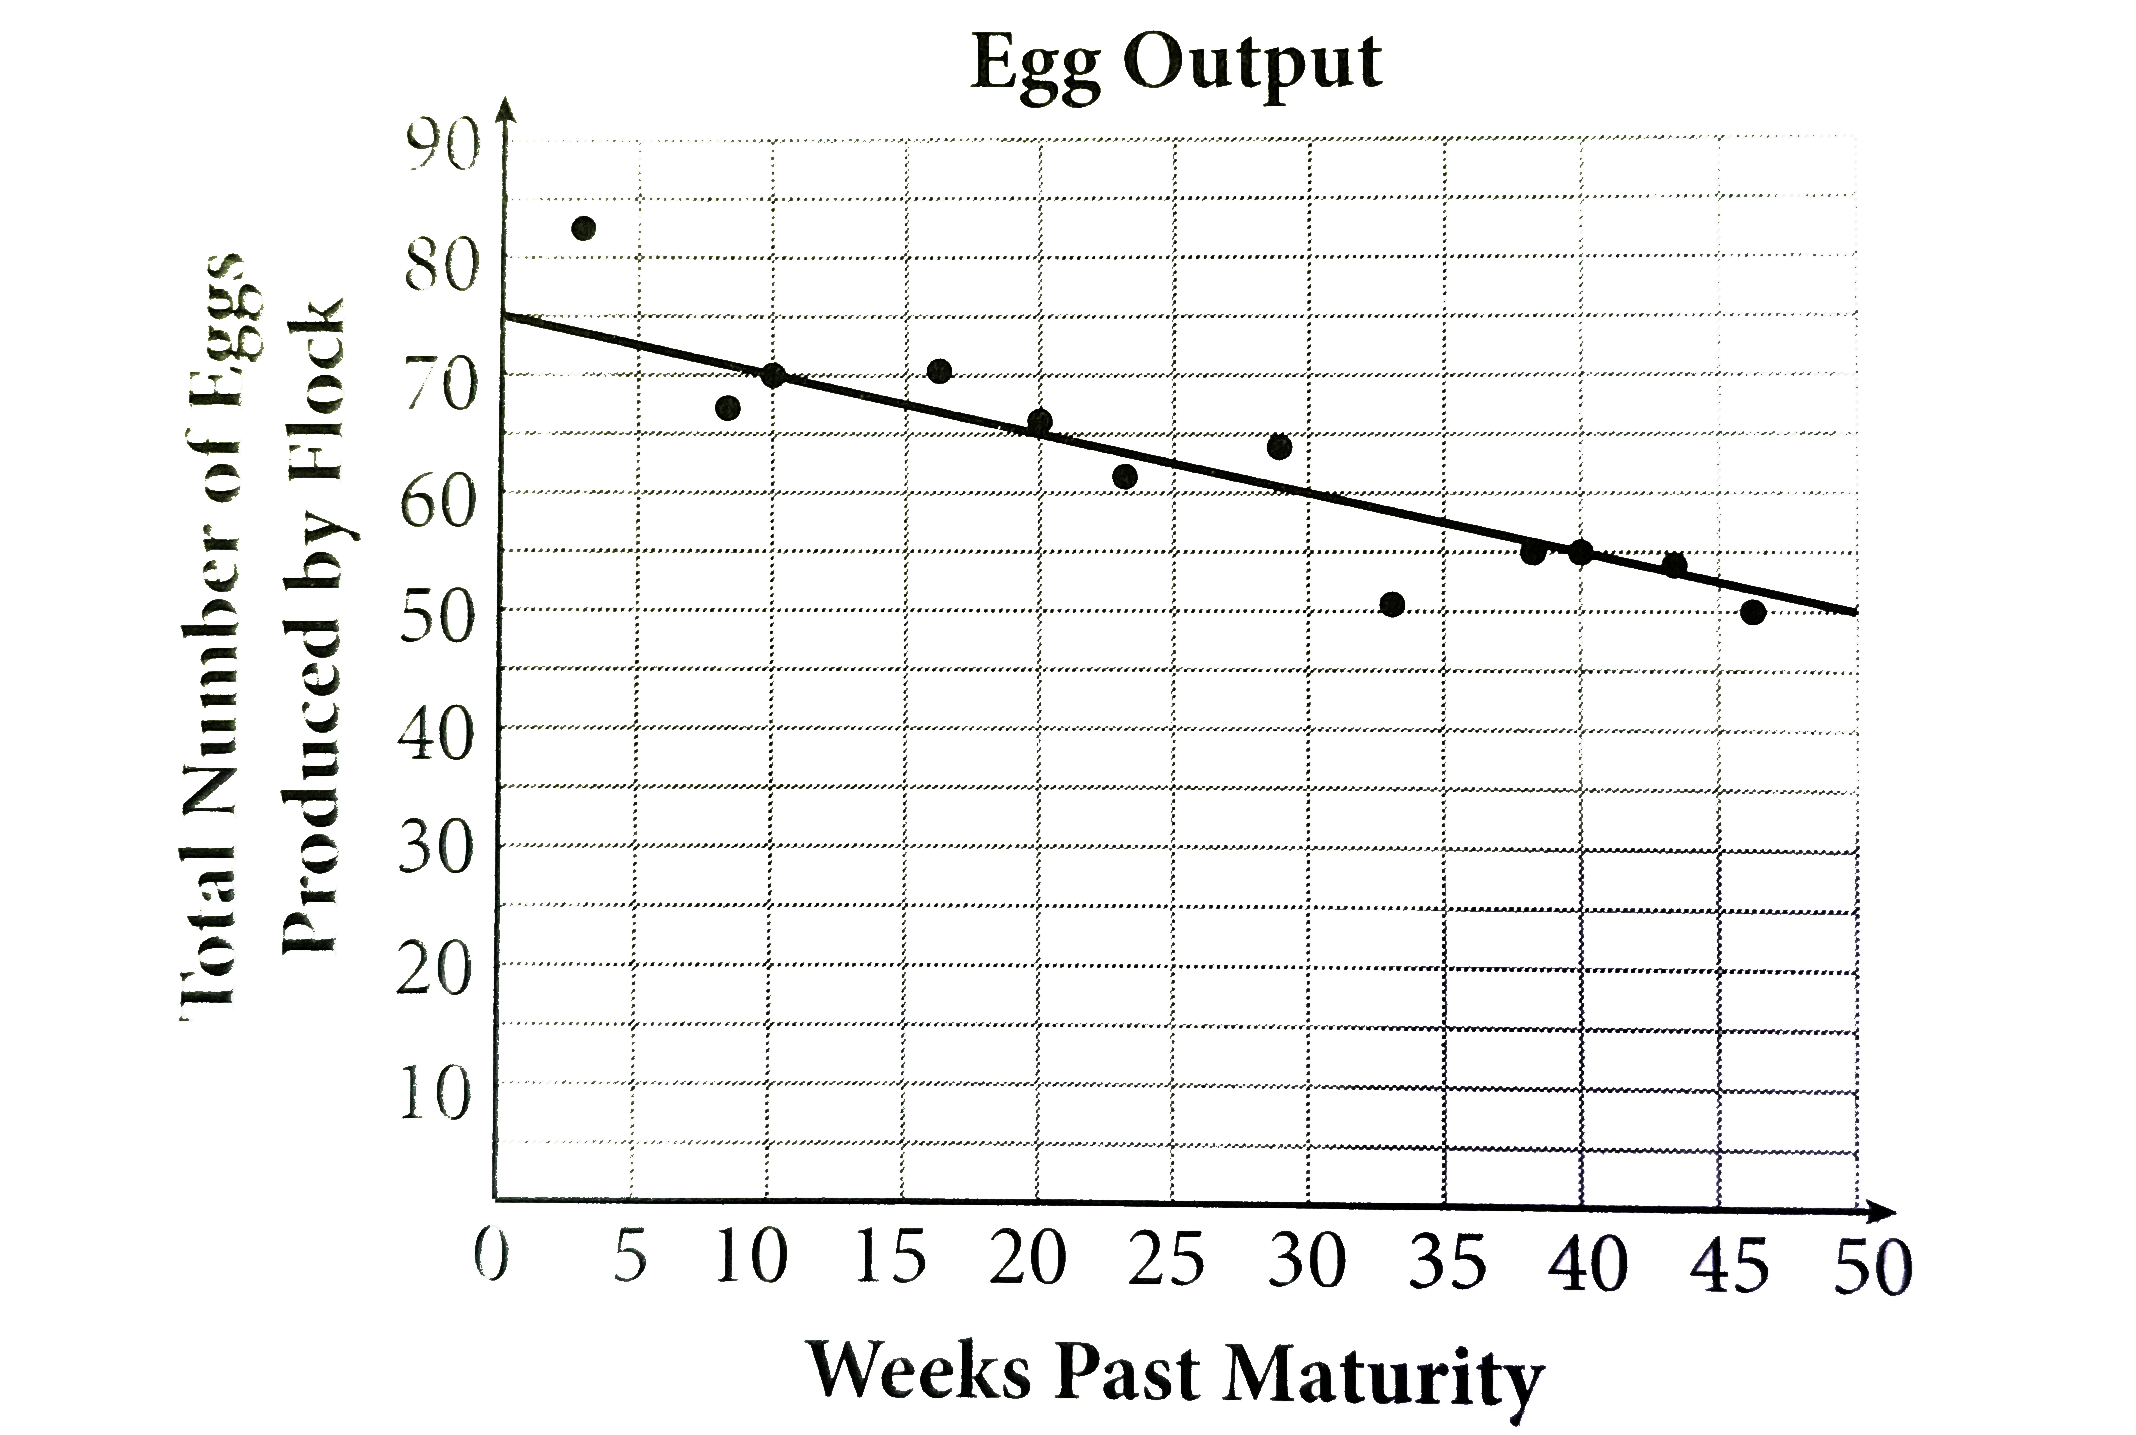
Most chickens reach maturity and begin laying eggs at around 20 weeks of age. From this point forward, however, as the chicken ages,its eges its egg production decreases. A farmer was given a flock of 100 chickens (all of which were the same age) and asked to meaure daily egg output for the entire flock at random intervals starting at maturity until the chickens were 70 weeks old. The data are recorded in the scatteplot below and the line of best fit has been drawn.

Based on the line of bast fit, what is the predicted number of eggs that will be produced by the flock when it is 33 weeks past maturity ?01:50View Solution
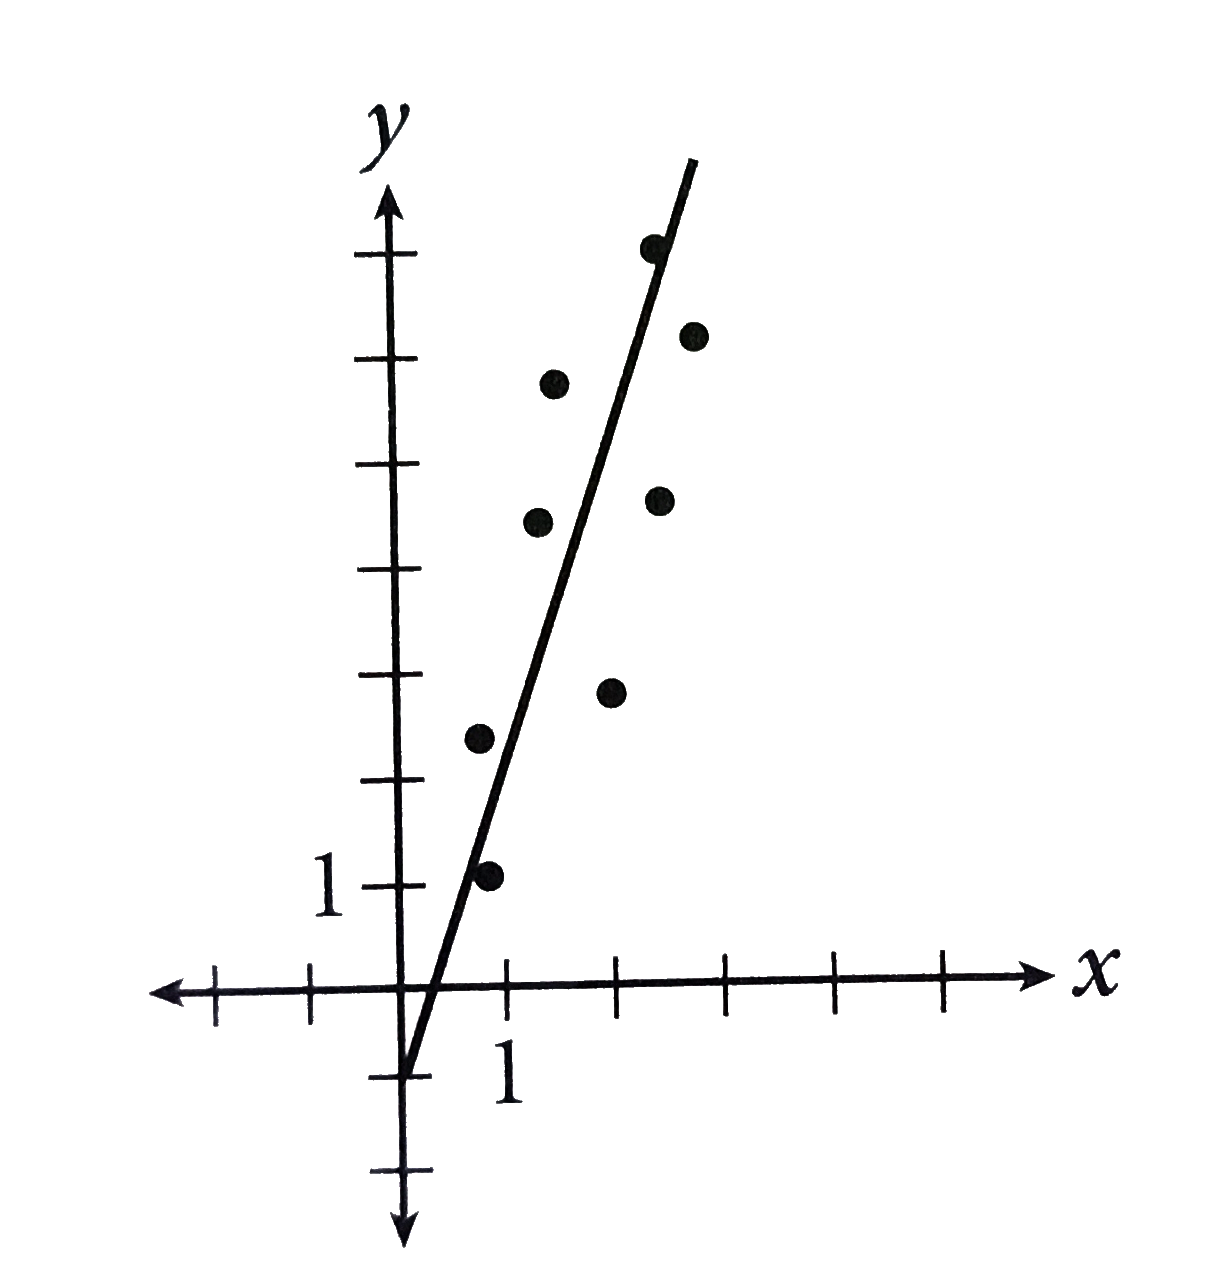
Which of the following equation corresponds to the line of best fit for the data set shown above ?01:05View SolutionIf 79x−16x=13+12, what is the value of x ?
View Solution{5x−3y=106y=kx−42
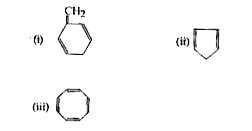
In the system of linear equations above, k represents a constant. If the system of equations has no solution, what is the value of 2k?View Solutionइनमें कौन से निकाय ऐरोमैटिक नहीं हैं ? कारण स्पष्ट कीजिए
 View Solution
The data in which of the following scatterplots would be best modeled by a quadratic function in which the x2 term has a negative coefficient?
View SolutionFind the mean about the mean for the following data .
(##VIK_MAT_IIA_QB_C08_SLV_003_Q01.png" width="80%">View SolutionFind the mean deviation from the median for the following data
(##VIK_MAT_IIA_QB_C08_SLV_004_Q01.png" width="80%">View SolutionFind the mean deviation about the mean for the following data
(##VIK_MAT_IIA_QB_C08_SLV_005_Q01.png" width="80%">View SolutionFind the mean deviation about the mean for the following data
(##VIK_MAT_IIA_QB_C08_SLV_007_Q01.png" width="80%">View SolutionFind the variance and standard deviation of the following data
(##VIK_MAT_IIA_QB_C08_SLV_009_Q01.png" width="80%">View SolutionFind the mean deviation from the mean of the following data using step deviation method
(##VIK_MAT_IIA_QB_C08_SLV_013_Q01.png" width="80%">View Solution(NAV_ALB_HIN_PHY_XI_C14A_E03_031_Q01.png" width="80%">
View Solution(#FIITJEE_PHY_MB_02_C01_SLV_052_Q01.png" width="80%">
02:43View SolutionMatch the following columns .
(##KPK_AIO_BIO_XI_C20_E05_015_Q01.png" width="80%">View Solution

