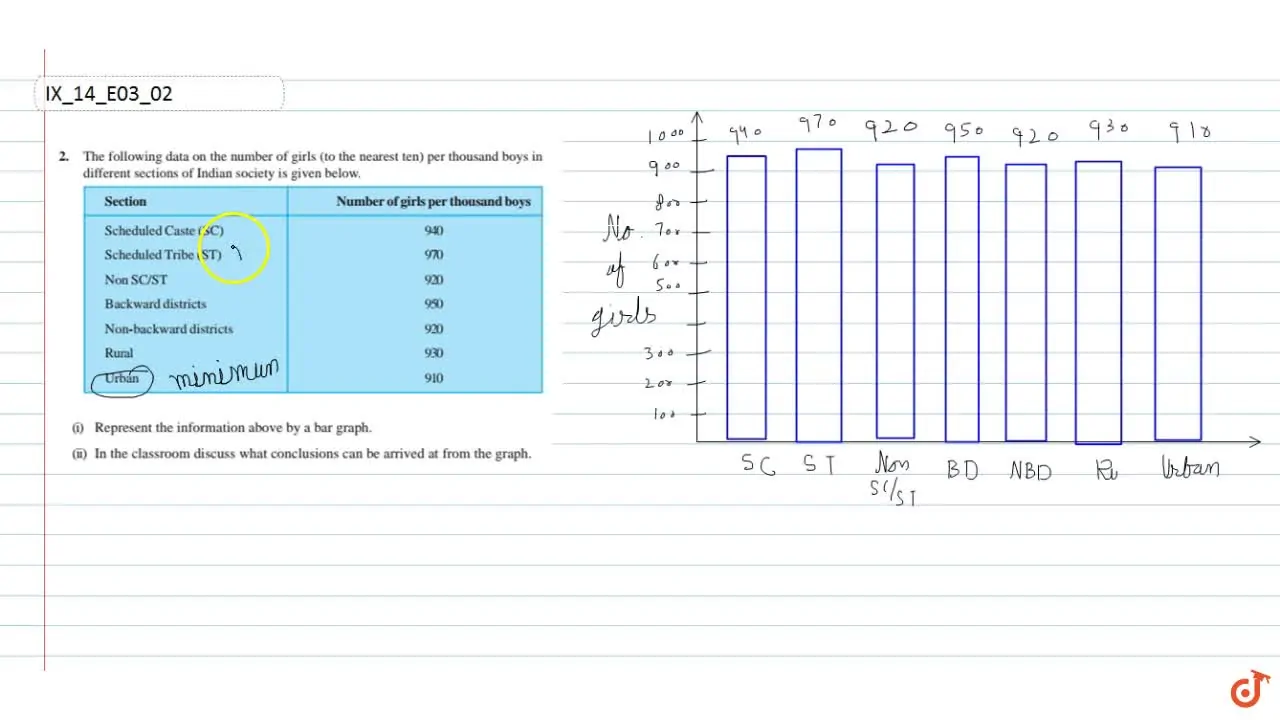
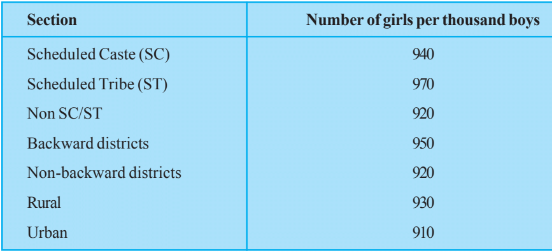
The following data on the number of girls (to the nearest ten) per thousand boys in different sections of Indian society is given below.
(i) The above data can be represented on a bar graph as below:
Represent the ‘section’ on the x-axis and the number of girls per thousand boys on the y-axis.
We will select a scale of 1 unit = 100 girls for the y-axis as the max value does not exceed 1000.
We will maintain equal width for all the bars on the x-axis and also maintain equal gaps in between the bars.
Point to note:
The values variations occur mostly in the range of 900-970.
The values are the same until 900.
Hence to make the variations more visible and distinct and for a better study of the graph, we can keep the starting value on the y-axis as ‘900’ with a scale of 1 unit as ‘10’ and reconstruct the graph.
(ii) It can be observed from the graph that:
The number of girls per thousand boys represented in the graph is maximum for Scheduled Tribe (ST).
The number of girls per thousand boys represented in the graph is lowest for urban.
The number of girls per thousand boys are higher in rural area than in urban.
The number of girls per thousand boys are also higher in backward districts than in non-backwards.
Related Playlists
- BOOK - NCERTCHAPTER - STATISTICSEXERCISE - EXERCISE 14.12videos
STATISTICS
- BOOK - NCERTCHAPTER - STATISTICSEXERCISE - Exercise 14.29videos
STATISTICS
- BOOK - NCERTCHAPTER - QUADRILATERALSEXERCISE - SOLVED EXAMPLES8videos
QUADRILATERALS
- BOOK - NCERTCHAPTER - SURFACE AREAS AND VOLUMESEXERCISE - EXERCISE 13.810videos
SURFACE AREAS AND VOLUMES
Similar Questions
Estimate the numbers to the nearest thousands and find the difference (45963 - 28577).
View SolutionFind the estimated difference of 93125−76036 to the nearest ten thousands.
View SolutionRound each whole number to the given place.
632 to the nearest tenView SolutionRound each whole number to the given place.
394 to the nearest tenView SolutionRound each whole number to the given place.
1096 to the nearest tenView SolutionThe following bar chart represents the birth rate (per thousand) of six different countries. Study the bar chart and answer the question given below.
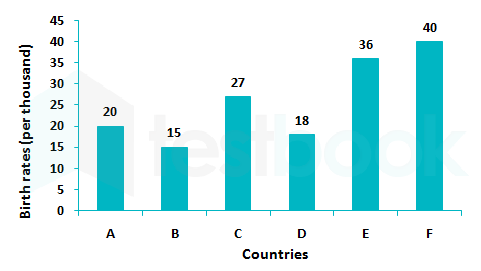
The birth rate of Country E is what per cent of the birth rate of Country A?View SolutionThe following bar chart represents the birth rate (per thousand)of six different countries. Study the bar chart and answer the question given below.
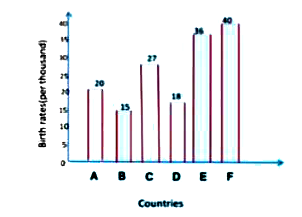
The birth rate of Country E is what per cent of the birth rate of Country A ?View SolutionFollowing are the data about the number of men and women in different age groups in a society. Present the information in the form of a two-way table.
 View Solution
Refer the following data table and answer the question.
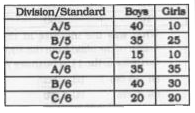
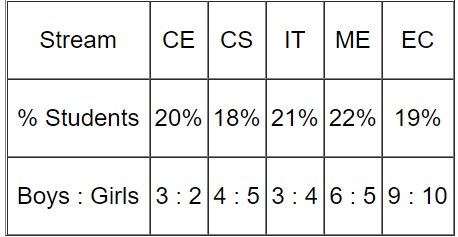
What is the ratio of boys to girls?View SolutionIF the data about the number of girls enrolled in the various streams is represented by a pie chart, what is the central angle of the sector representing the number of girls in the ME stream, to the nearest whole degree.
 View Solution

