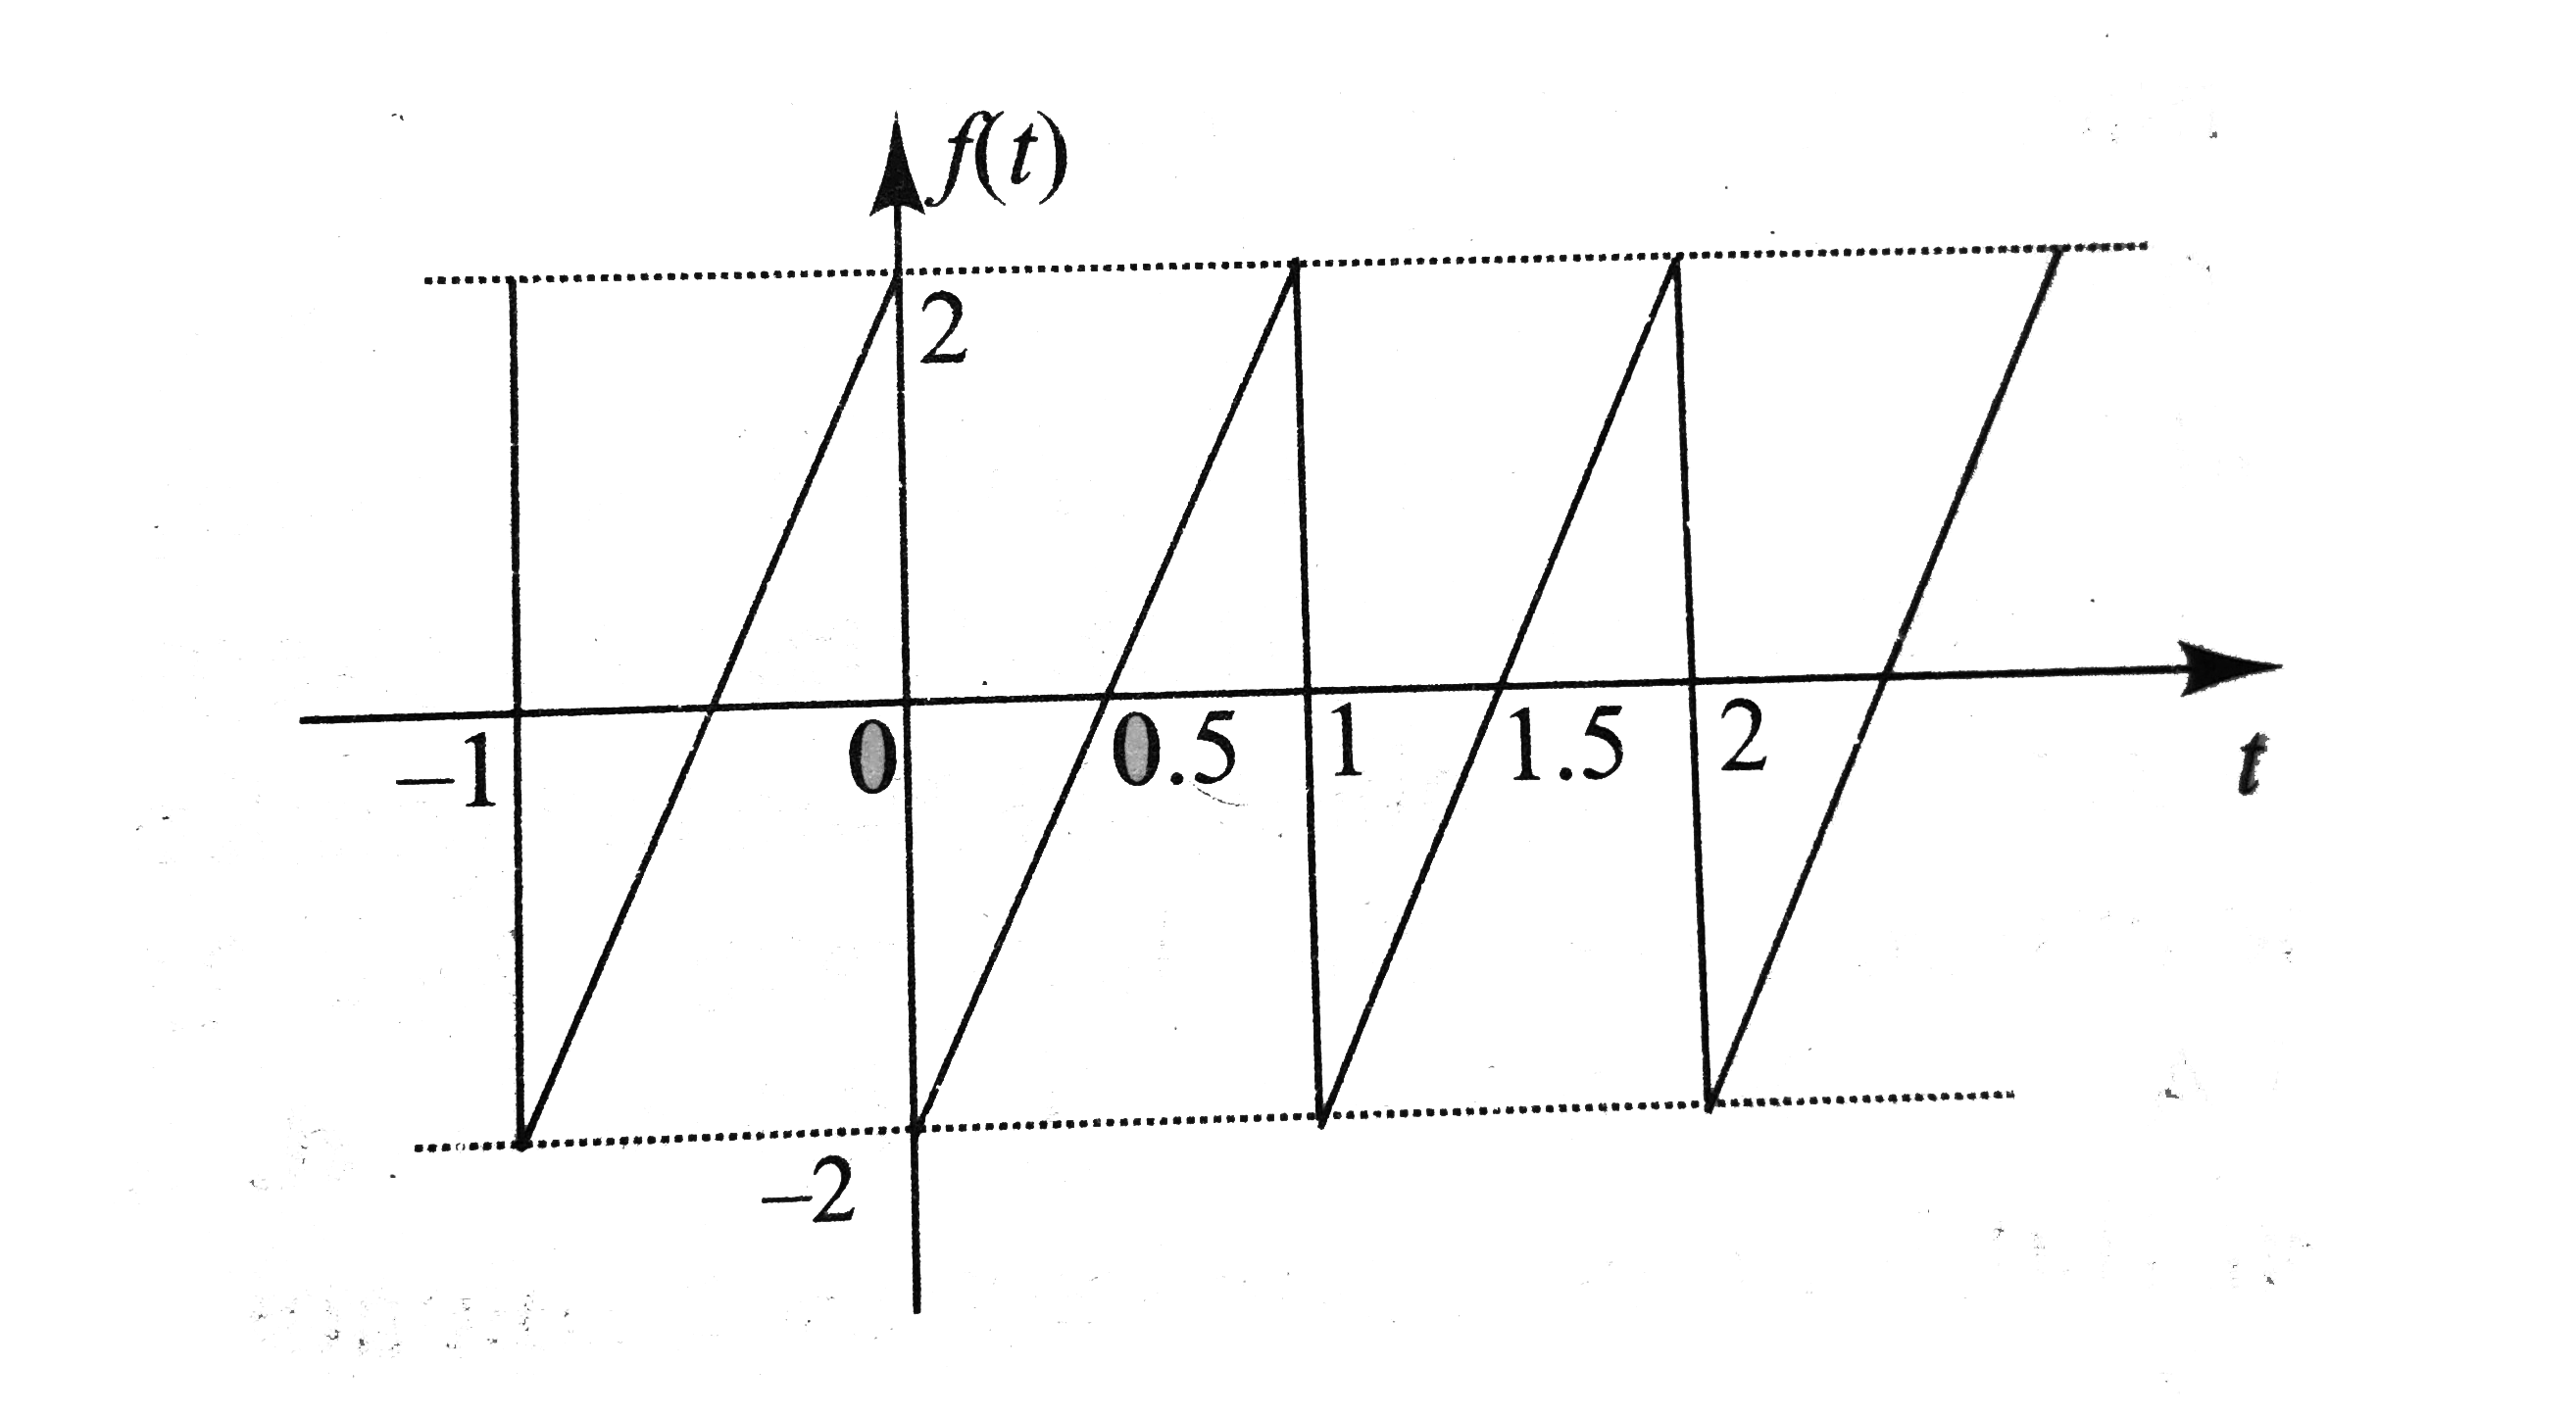
Find the r.m.s. and average values of the saw tooth waveform shown in Fig..
The required values can be found by using either graphical method or analytical method. Graphical Method The average value can be found by averaging the function from t = 0 to t = 1 in parts as given below : Average value of fNow area of a right-angled triangle = 1/2 × base × altitude. Hence area of the triangle during t = 0 to t = 0.5 second isA1 = 1/2 x Δt x -2 = 1/2 x 1/2 x - 2 = - 1/2Similarly area of the triangle from t = 0.5 to t = 1 second isA2 = 1/2 x Δt x +2 = 1/2 x 1/2 x 2 = 1/2Net area from t = 0 to t = 1.0 second is A1 + A2 = -1/2 + 1/2 = 0Hence average value of f t over one cycle is zero. For finding the r.m.s. value we will first square the ordinates of the given function and draw a new plot for f2t as shown in Fig. It would be seen that the squared ordinates from a parabola.Area under parabolic curve = 1/3 × base × altitude. The area under the curve from t = 0 tot = 0.5 second is ; A1 = 1/3Δt x 22 = 1/3 x 1/2 x 4 = 2/3Similarly for t = 0.5 to t = 1.0 secondA2 = 1/2Δt x 4 = 1/3 x 1/2 x 4 = 2/3Total area = A1 + A2 = 2/3 + 2/3 = 4/3 r.m.s. value∴ r.m.s. value = 4/3 = 1.15 Analytical Method The equation of the straight line from t = 0 to t = 1 in Fig. is f t = 4 t − 2; f 2 t = 16 t 2 − 16 t + 4Average value
Related Solutions
Find the rms and the average values of the saw tooth waveform shown in fig.
 .View Solution
Find the rms and the average values of the saw tooth waveform shown in fig.
 .View Solution
Find the rms and the average values of the saw tooth wave form shown in fig.
View SolutionFind (a) the average and (b) mis value for the Saw tooth voltage of peak value Vas shown in the figure
View SolutionThe average value for the saw-tooth voltage of peak value of V_(0) over half the cycle as shown in figure is
View SolutionFind the periodic potential waveform shown in the figure. average value
View SolutionRms value of the saw-tooth voltage of peak value V_(0) as shown in-
View SolutionThe r.m.s. value of potential difference V shown in Fig. is
View SolutionFind the aveage for the saw-tooth voltage of peak value from to as shown in figure.
 View Solution
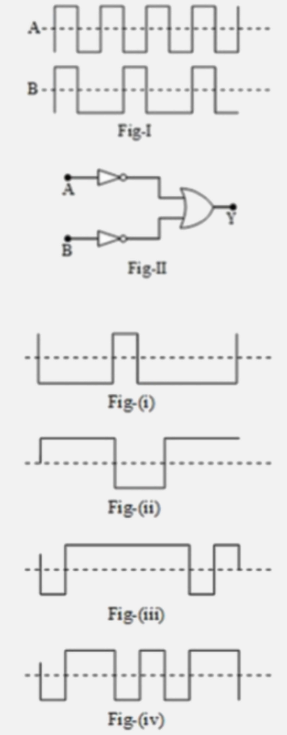
Input waveforms A and B as shown in Fig-l are applied to the combination of gates as shown in Fig-ll. Which of the waveforms shown in Fig.(i) to (iv) correctly represents the output waveform?
View SolutionInput waveforms A and B as shown in Fig-l are applied to the combination of gates as shown in Fig-ll. Which of the waveforms shown in Fig.(i) to (iv) correctly represents the output waveform?
 View Solution
Input waveforms A and B as shown in Fig-l are applied to the combination of gates as shown in Fig-ll. Which of the waveforms shown in Fig.(i) to (iv) correctly represents the output waveform?
 View Solution
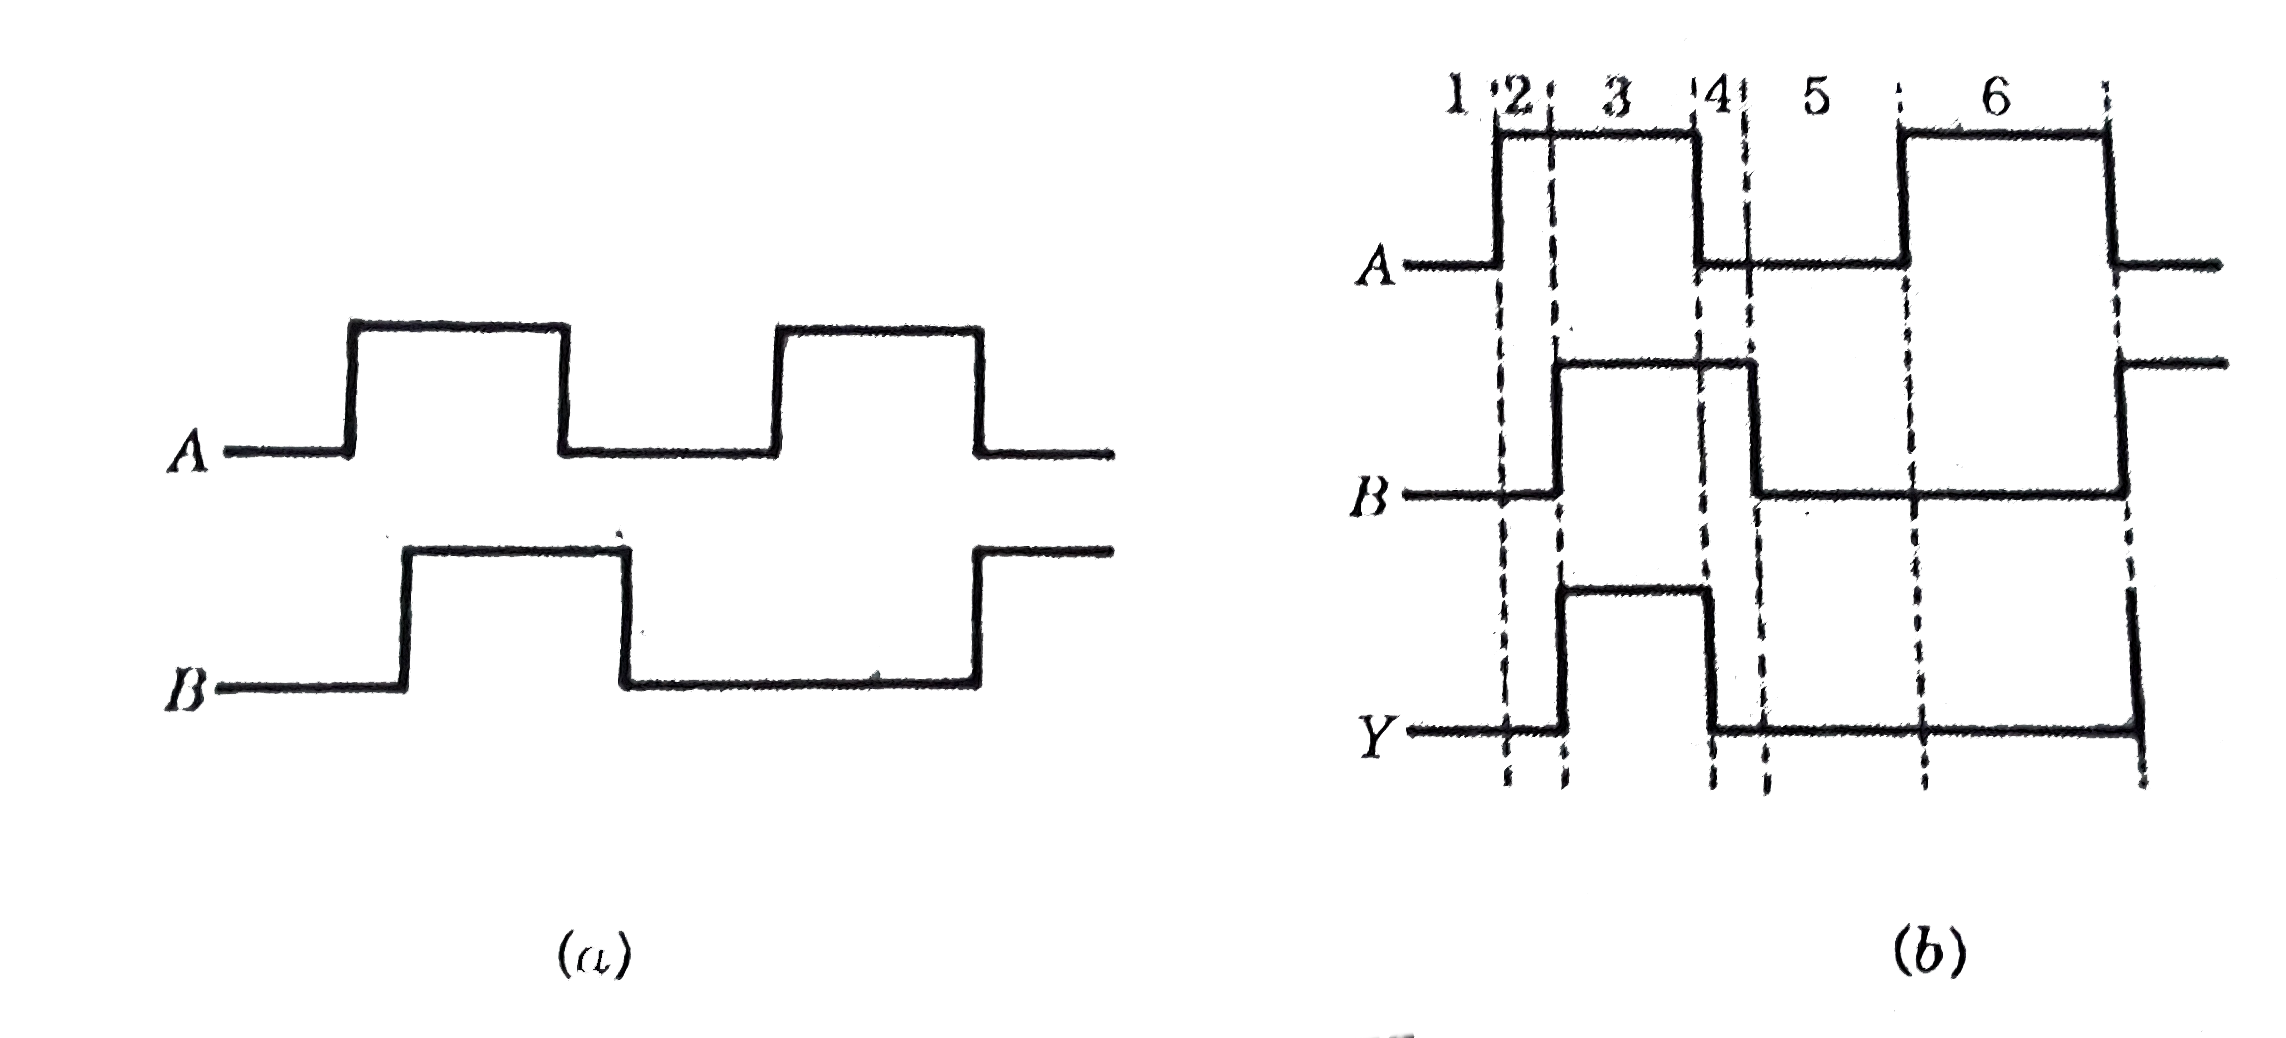
Two input waveforms and shown in fig (a) are applied to an AND gate.Write the output waveform.
 View Solution
Which of the two waveforms shown in Figure has a higher average value?
View SolutionThe average current in terms of for the waveform shown is
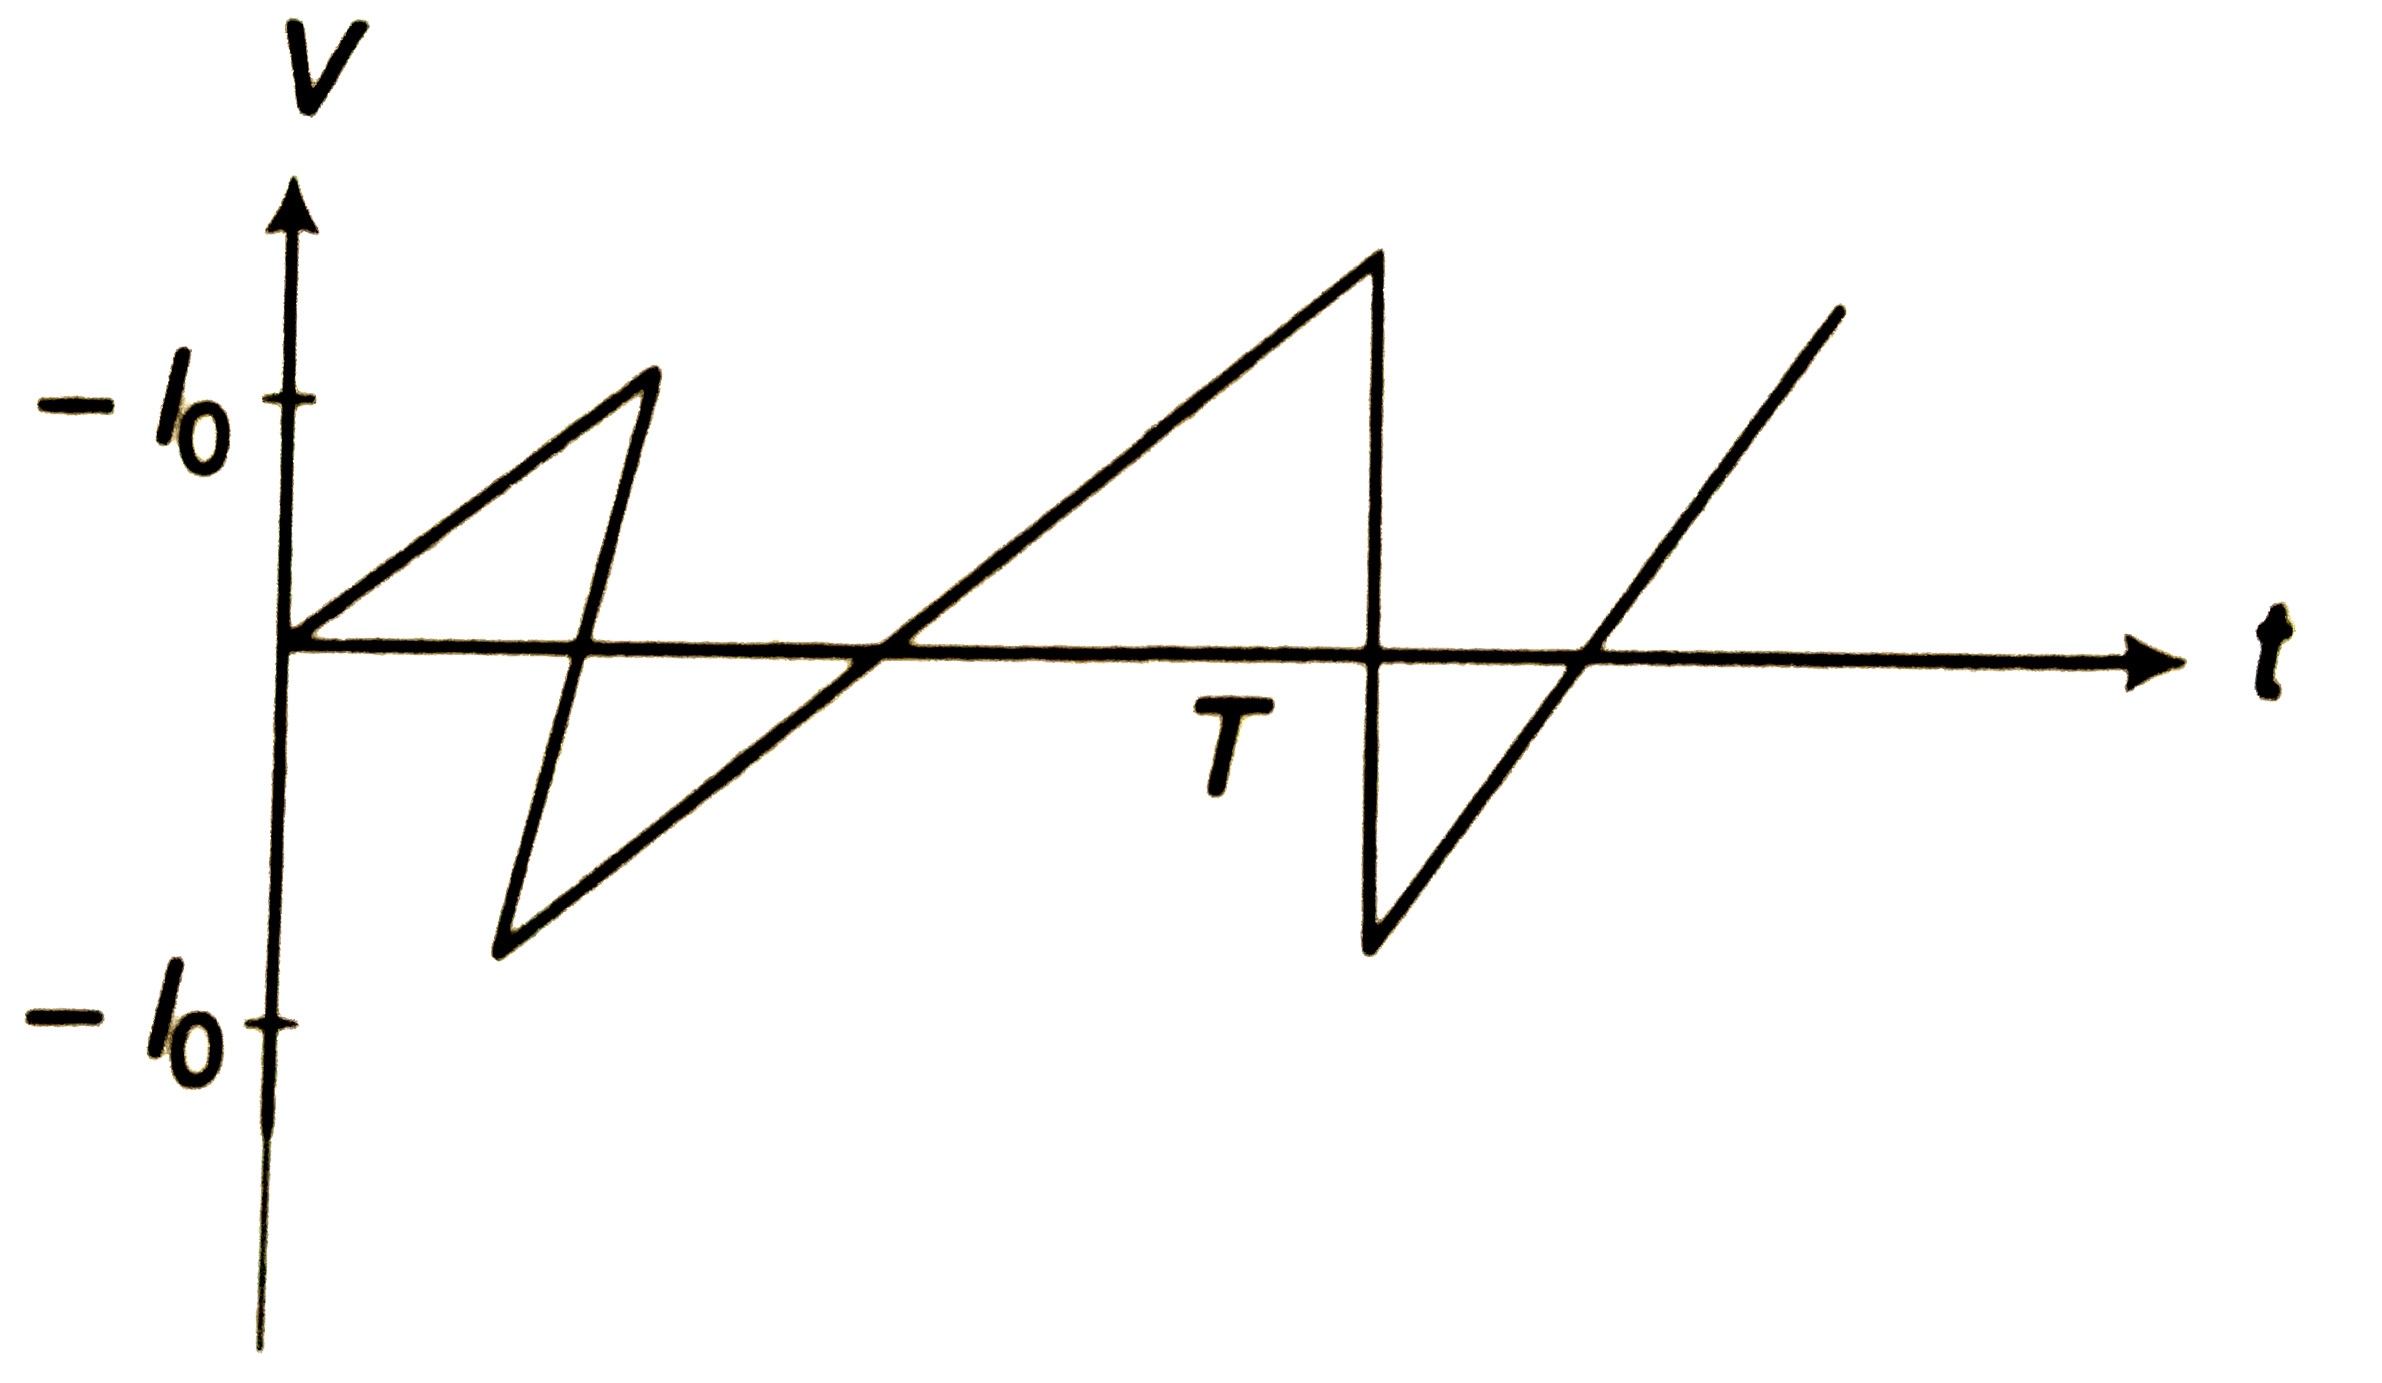 View Solution
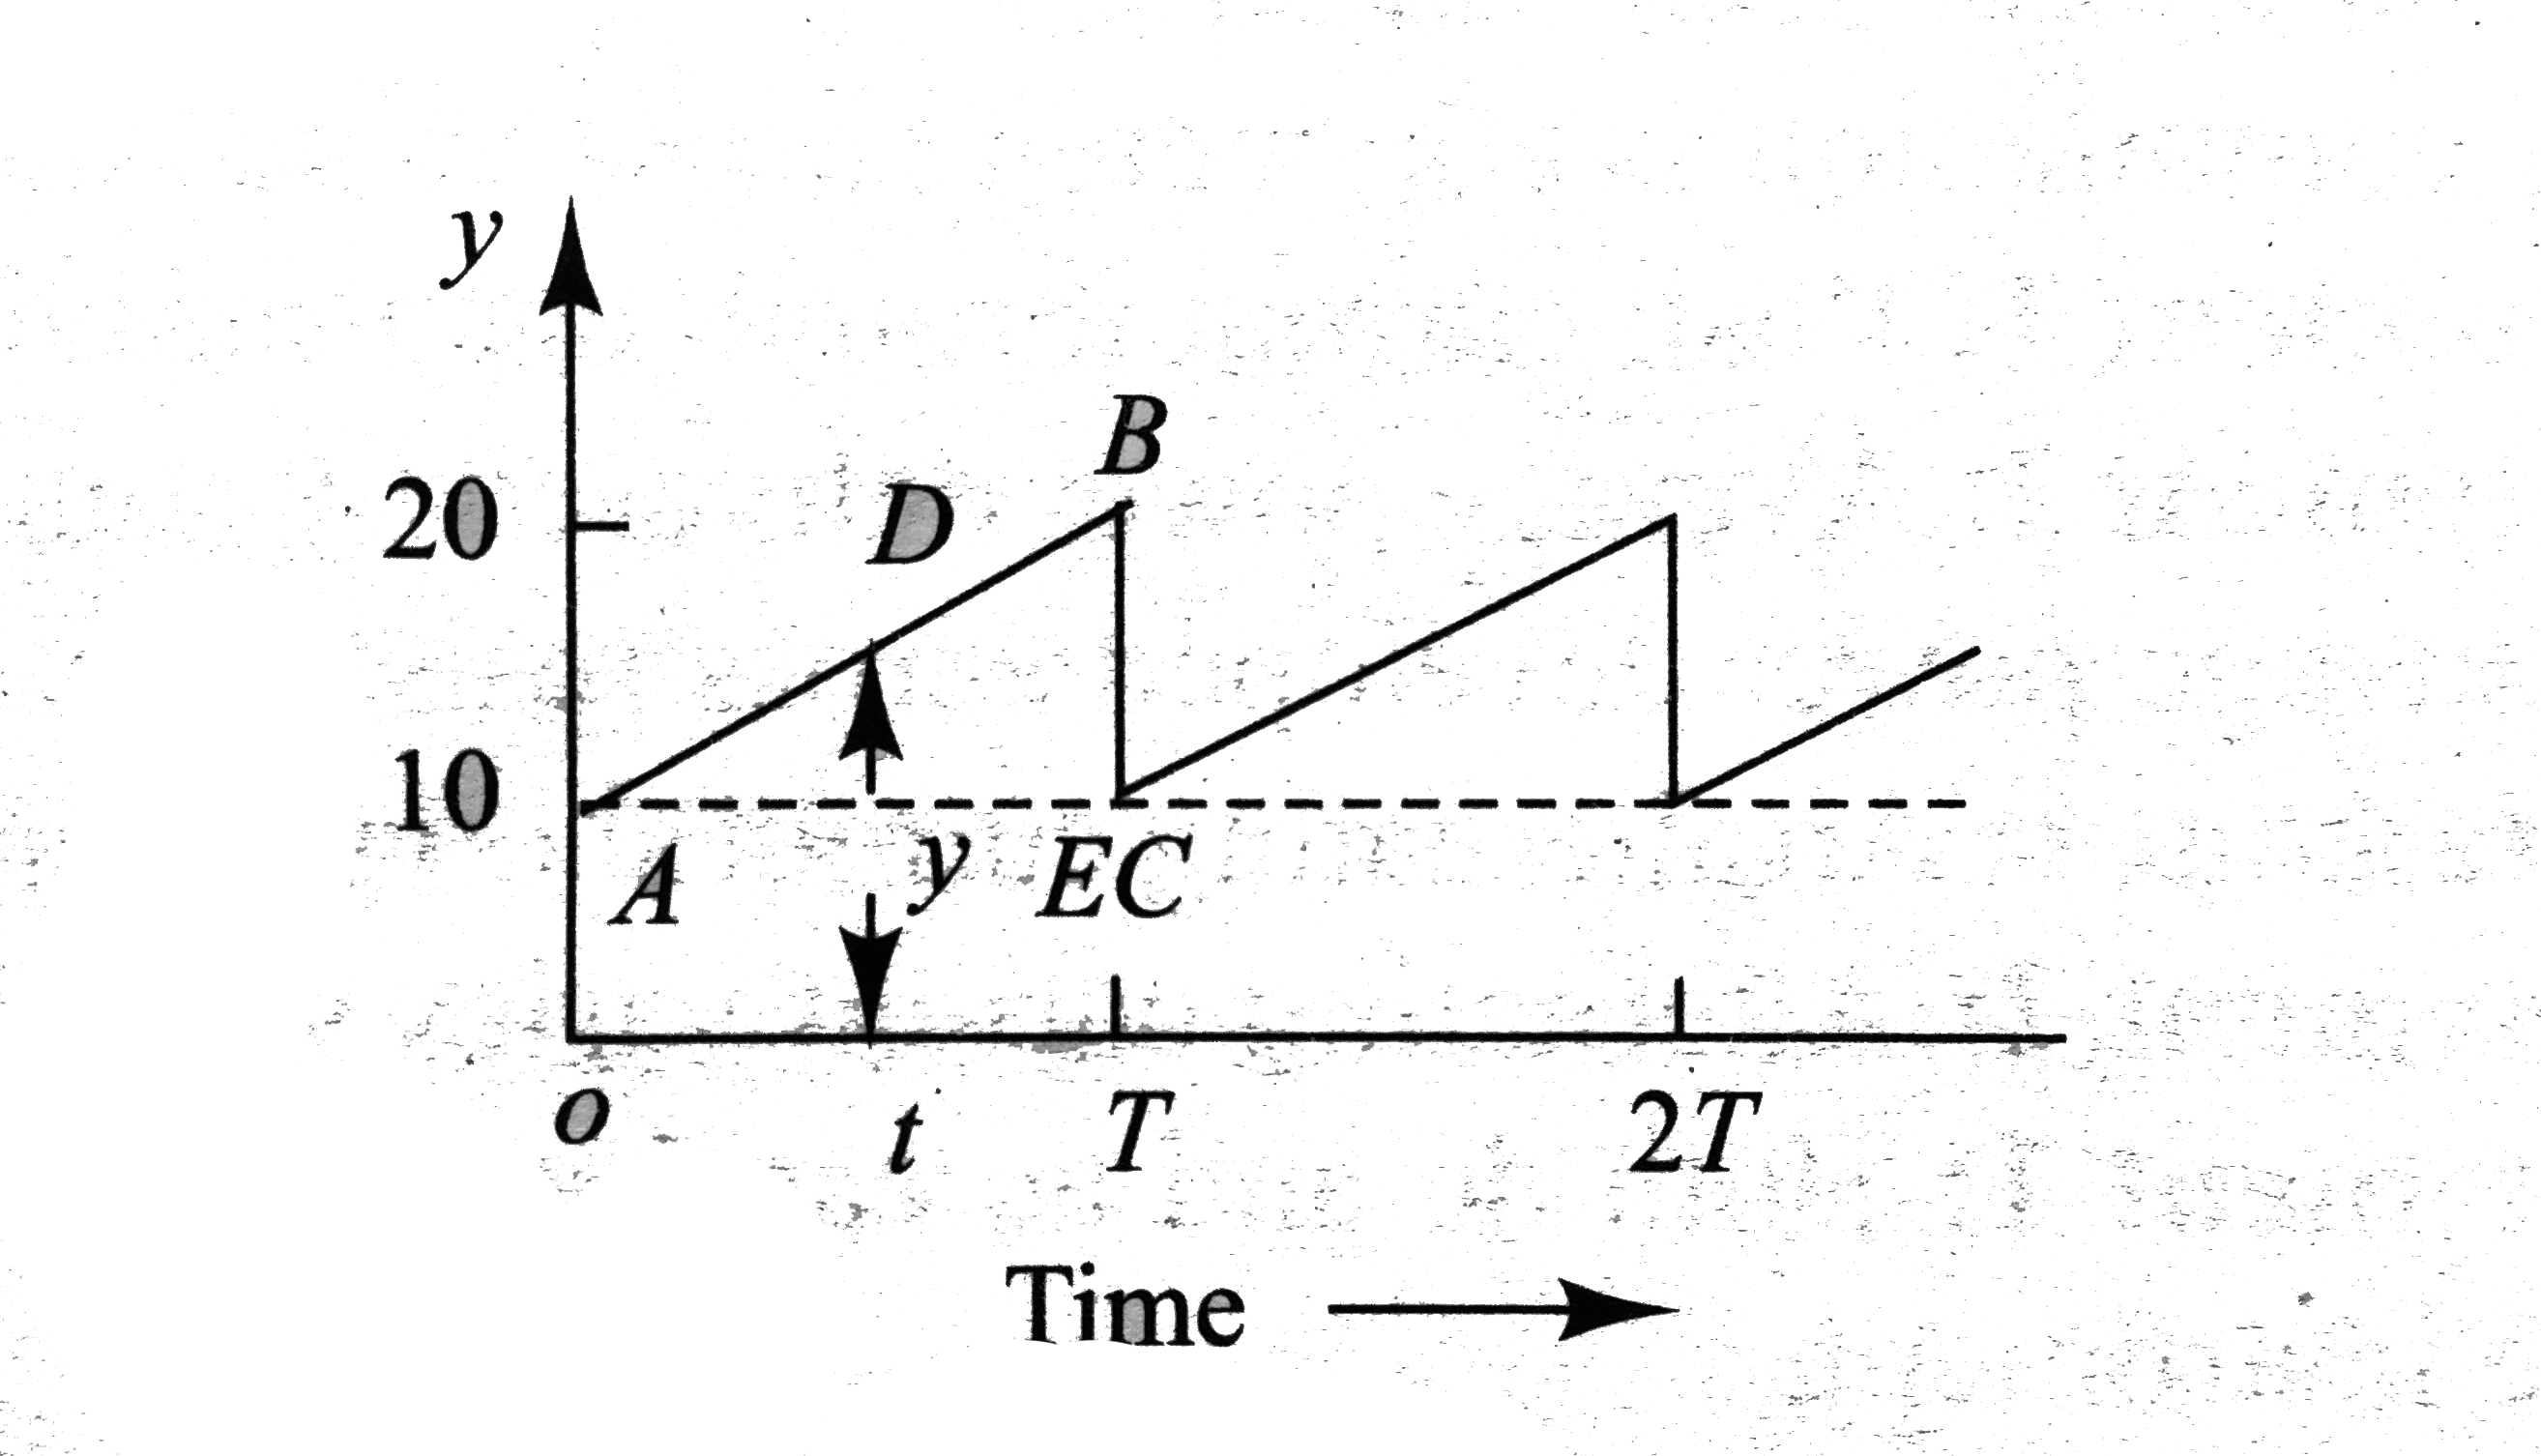
the average value of the wave-from shown in fig. isView Solutionthe average value of the wave-from shown in fig. is
View SolutionA voltage waveform is as shown in the Figure calculate the ratio of rms value and average value of the voltage.
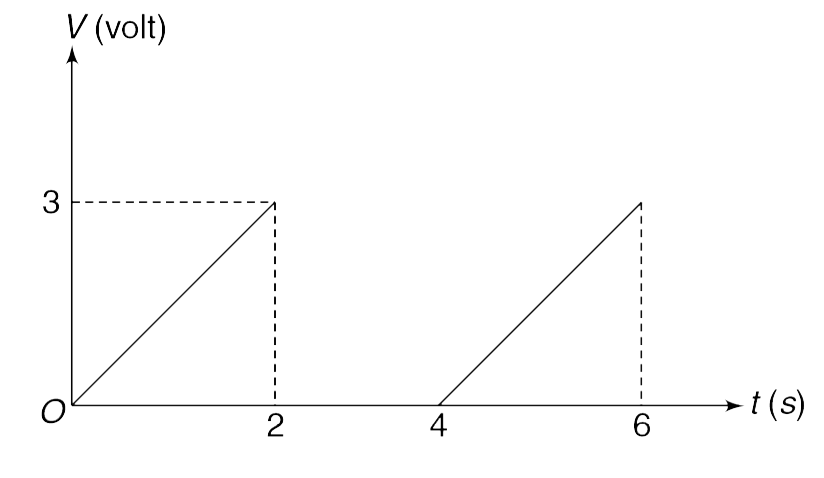 View Solution
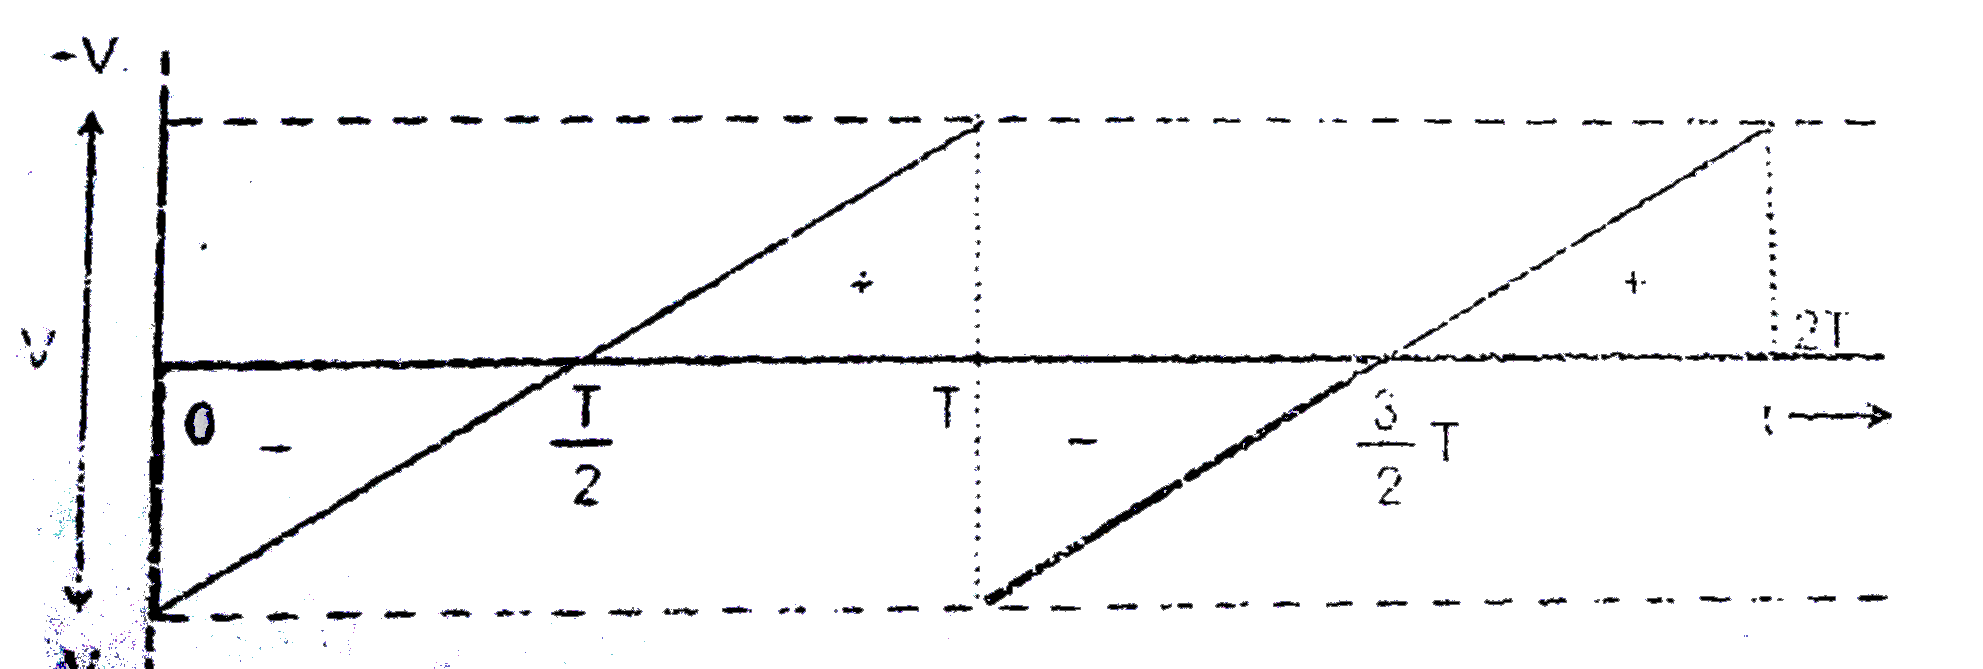
The rms value of the saw-tooth voltage of peak value V_(0) from t=0 to t=2T as shown in figure is V_(0)/sqrtx .Find the value of x .
View SolutionThe value of the saw-tooth voltage of peak value from to as shown in figure is .Find the value of .
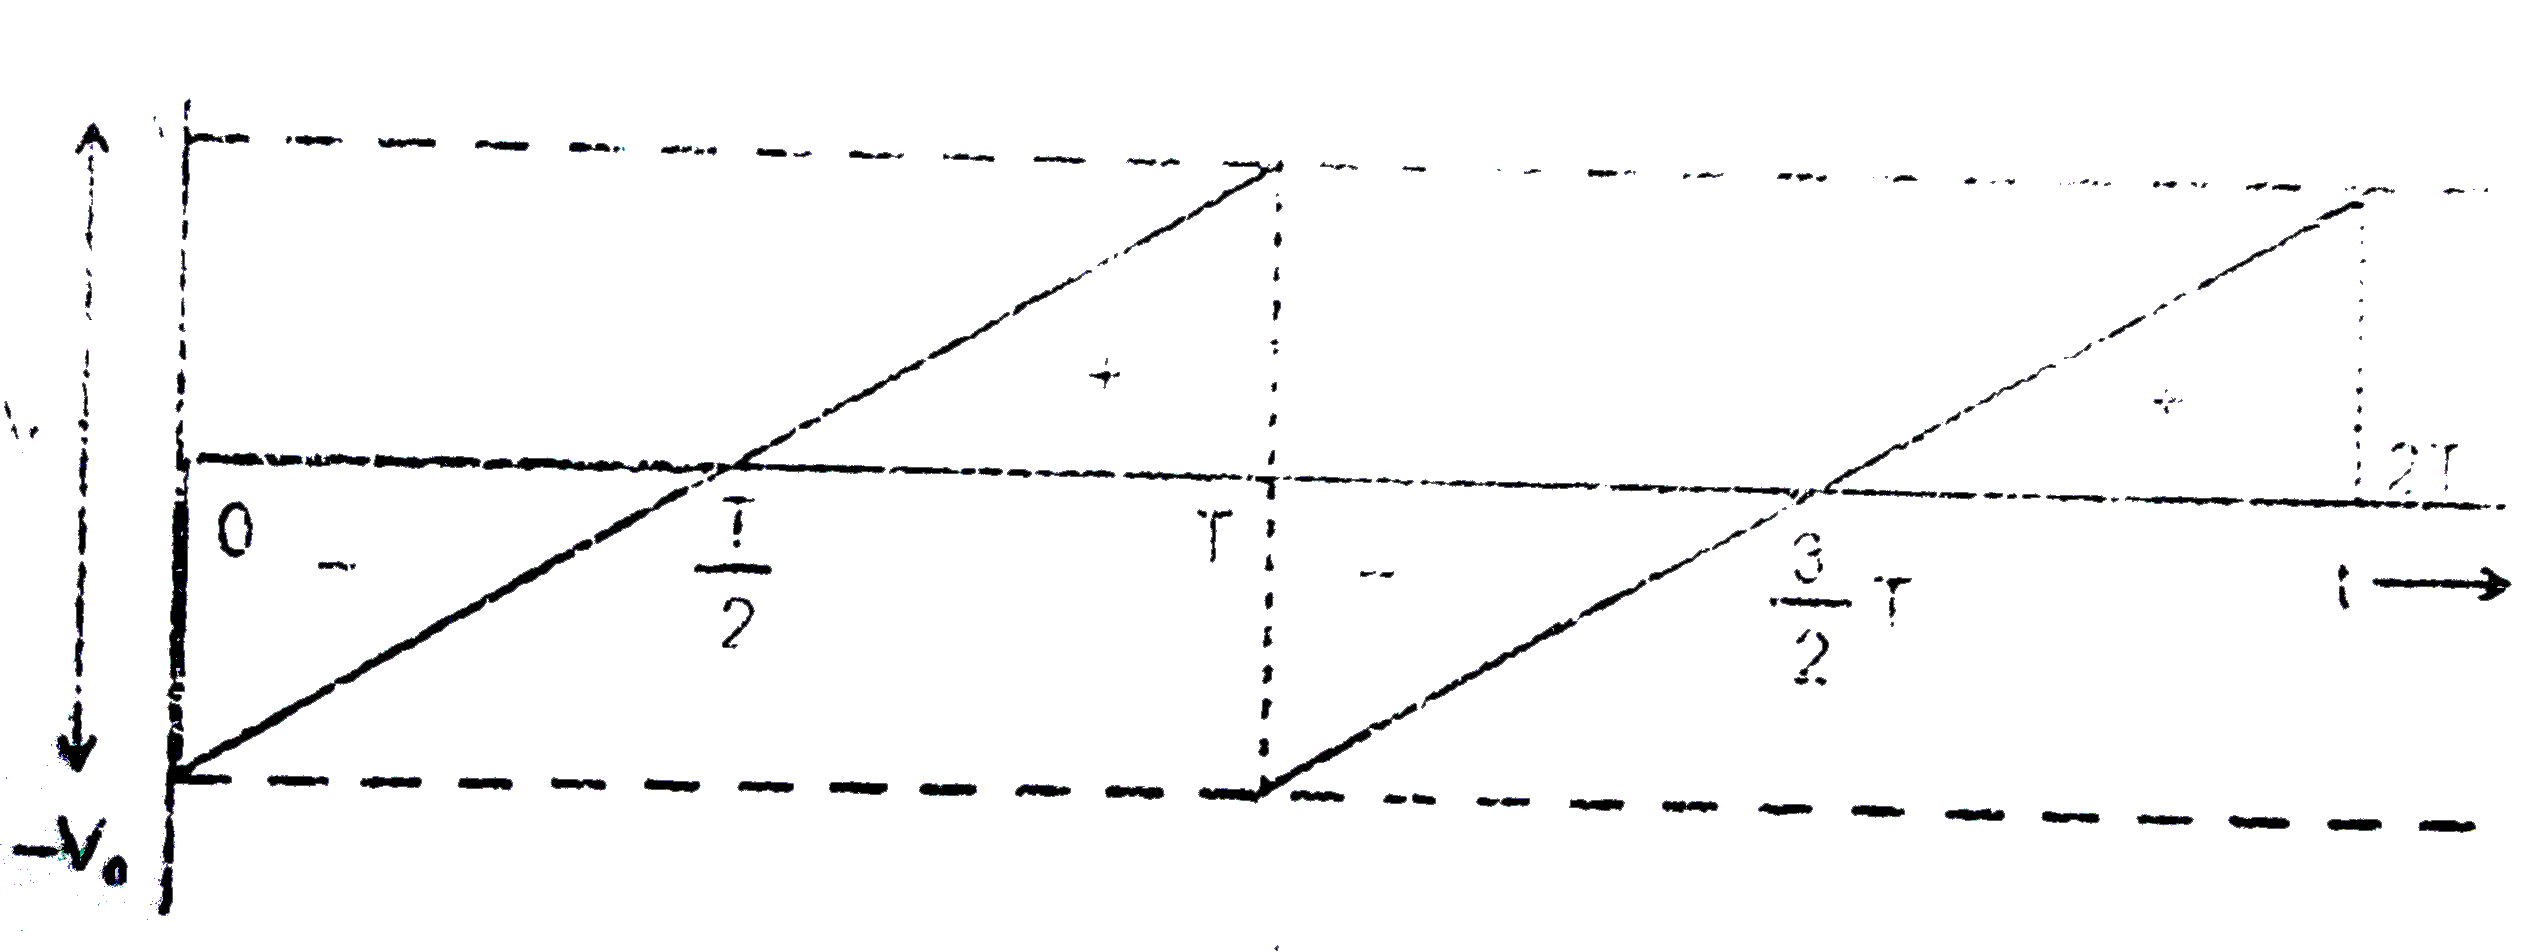 View Solution
