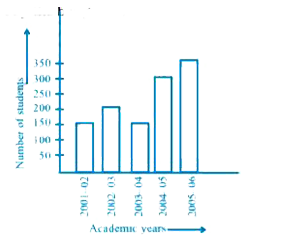
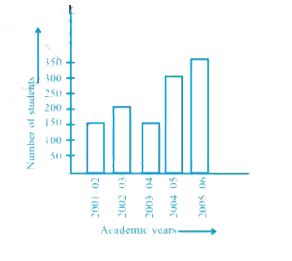
Read the bar graph given below and answer the following questions: a What information is given by the bar graph? b In which year is the number of students maximum? c In which year is the number of students twice as that of 2001-02? d In which year did the number of students decrease as compared to previous year? e In which year is the increase in number of students maximum as compared to the previous year?Unit : 1unit = 50 students
a Number of students in different Acadamic years. b 2005 – 06 c 2004 – 05 d 2003 – 04 e 2004 – 05
Related Solutions
Read the bar graph given below and answer the following questions:
In which year is the number of students twice as that of 2001-02?View SolutionRead the bar graph given below and answer the following questions:
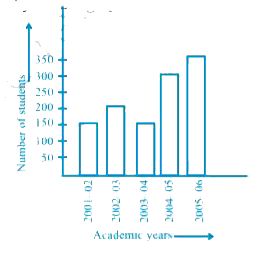
In which year did the number of students decrease as compared to previous year?View SolutionRead the bar graph given below and answer the following questions:
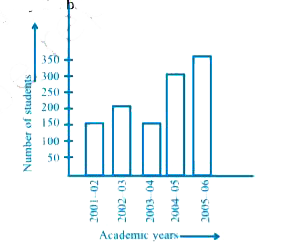
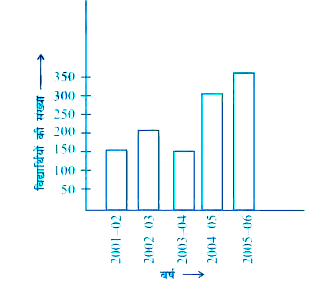
In which year is the increase in number of students maximum as compared to the previous year?View Solutionनिम्न दंड-आलेख को पढ़िए और निम्नलिखित प्रश्नों के उत्तर दीजिए -
(a) यह दंड-आलेख क्या सूचना प्रदर्शित करता है?
(b) किस वर्ष में विद्यार्थियों की संख्या सबसे अधिक थी?
(c) किस वर्ष में विद्यार्थियों की संख्या 2001-02 की तुलना में दोगुनी थी?
(d) किस वर्ष में विद्यार्थियों की संख्या उसके पिछले वर्ष की तुलना में कम हुई?
(e) किस वर्ष में विद्यार्थियों की संख्या पिछले वर्ष की तुलना में सबसे अधिक बढ़ी?
 View Solution
The given bar graph (bar graph) shows the number of students in two schools during six years. In which year the total number of students in schools A and B has increased the highest as compared to their previous year?
View SolutionRead the bar graph given below and answer the following questions:
In which year is the number of students maximum?View Solutionदिया गया दंड आरेख (बार ग्राफ) छह वर्षों के दौरान दो स्कूलों में विद्यार्थियों की संख्या को दर्शाता है।
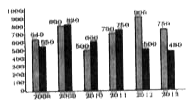
किस वर्ष में स्कूल B के विद्यार्थियों की संख्या में प्रतिशत वृद्धि इसके पिछले वर्ष की तुलना में सबसे अधिक है ?View Solutionकिसी स्कूल की एक विशेष कक्षा के अग्रलिखित दंड आलेख को पढ़िए और निम्न प्रश्न के उत्तर लिखिए :
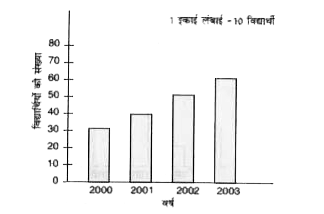
क्या वर्ष में विद्यार्थियों की संख्या वर्ष के विद्यार्थियों की संख्या की दोगुनी है ?View SolutionThe given bar graph (bar graph) shows the number of students in two schools during six years. In which year, the sum of the students in both the schools is the highest?
View SolutionThe following bar graph shows the number of students in a particular class of school. Then, answer the following questions. Is the number of students in the year 2002 is twice that in the year 2000?
View SolutionThe given bar graph presents the results in terms of number of students in a school for the five academic year 2013-2014 to 2017-2018.
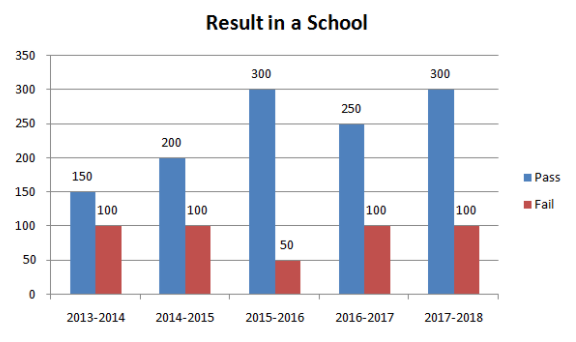
In which year the percentage increase in the total number of students is the highest in a comparison to the previous academic year?View Solutionदिया गया दंड आरेख (बार ग्राफ) विभिन्न वर्षो में एक स्कूल के विज्ञान और कला क्षेत्र के विद्यार्थियों की संख्या को दर्शाता है।
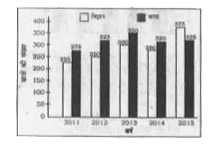
किस वर्ष में कला के विद्यार्थियों की संख्या विज्ञान की तुलना में से अधिक है ?View SolutionThe given bar graph shows the number of students in two schools during six years. In which year, the absolute difference in the number of students of both the schools is the largest?
View SolutionThe given bar graph shows the number of students in two schools during six years. In which year, the absolute difference in the number of students of both the schools is the largest?
View SolutionThe following bar graph shows the number of students admitted and passed out per year in a college from the year 2000 to the year 2004. study the bar graph What is the percentage increase in the number of students admitted in the year 2003 as compared to the year 2001?
View Solutionदिया गया दंड आरेख (बार ग्राफ ) पाँच शैक्षणिक वर्षों, से के दौरान किसी स्कूल के परीक्षाफल को विद्यार्थियों की संख्या के रूप में दर्शाता है।
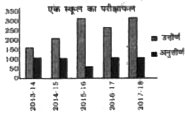
पिछले शैक्षणिक वर्ष की तुलना में किस वर्ष, विद्यार्थियों की संख्या के रूप में दर्शाता है ?View SolutionGiven bar graph (bar graph) for five academic years, 2013-2014 From 2017-2018 Represents the result of a school in terms of the number of students during the year. Which year, as compared to the previous academic year, represents the number of students?
View SolutionThe given bar graph shows the number of students of two schools over a period of six years. In the bar graph, in which year is the absolme difference of the students from schools A to B taken together, the maximum?
View Solutionदिया गया दंड आरेख (बार ग्राफ ) पाँच शैक्षणिक वर्षों से तक के दौरान एक स्कूल के परीक्षाफल के संदर्भ में विद्यार्थियों की संख्या को दर्शाता है।
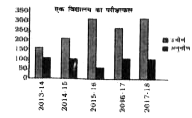
विद्यार्थियों की कुल संख्या में प्रतिशत वृद्धि, पिछले शैक्षणिक वर्ष की तुलना में किस वर्ष सबसे कम है ?View SolutionThe given bar graph (bar graph) shows the results of a school in terms of number of students during five academic years, 2013-2014 to 2017-2018. Which year has the highest percentage increase in the total number of students as compared to the previous academic year?
View Solution
