The percentage of marks obtained in different subjects by Ashok Sharma in an examination are given below. Draw a bar graph to represent it.EnglishHindiMathsScienceSocial8560355070
Bar graph to represent it
Related Solutions
The percentage of marks obtained, in different subjects by Ashok Sharma (in an examination) are given below. Draw a bar graph to represent it.

View SolutionThe percentage of marks obtained by a student in different subjects are given below.
Draw a bar graph representing the above data.
View SolutionStudy the following bar graph which shows the marks obtained by Shyam in different subjects of 100 marks each in an examination.
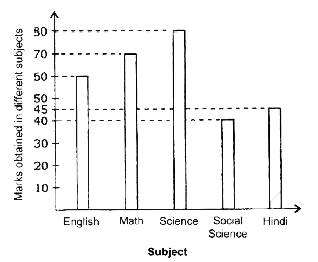
What is the percentage marks of Shyam in Science?
View SolutionThe marks obtained by a student in his annual examination in various subjects are given below:
Represent the above data by a bar graph.
View SolutionRead the given Bar Graph which shows the percentage of marks obtained by Brinda in different subjects in an assessment test
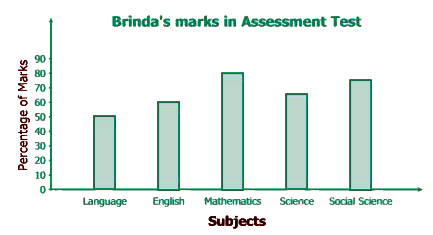
Observe the Bar Graph and answer the following questions.
Brinda scored 60% marks in the subject _____
View SolutionRead the given Bar Graph which shows the percentage of marks obtained by Brinda in different subjects in an assessment test
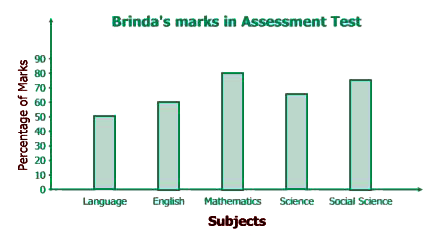
Observe the Bar Graph and answer the following questions.
The percentage of marks scored by Brinda in Science is ______
View SolutionGiven below is the bar chart by Shyam S_1 , denotes the marks obtained in the examination out of 100 marks in different subjects. Shyam's percentage marks in Science is
View SolutionObserve this bar graph which shows the marks obtained by Aziz in half-yearly examination in different subjects.
View SolutionObserve this bar graph which shows the marks obtained by Aziz in half-yearly examination in different subjects.
View SolutionRead the given Bar Graph which shows the percentage of marks obtained by Brinda in different subjects in an assessment test
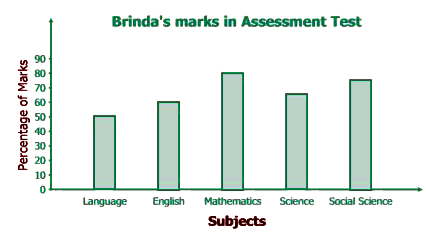
Observe the Bar Graph and answer the following questions.
1 unit= ____% of marks on vertical line.
View SolutionRead the given Bar Graph which shows the percentage of marks obtained by Brinda in different subjects in an assessment test
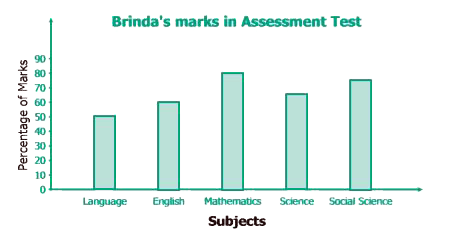
Observe the Bar Graph and answer the following questions.
Brinda has scored maximum marks in _____subject.
View SolutionRead the given Bar Graph which shows the percentage of marks obtained by Brinda in different subjects in an assessment test
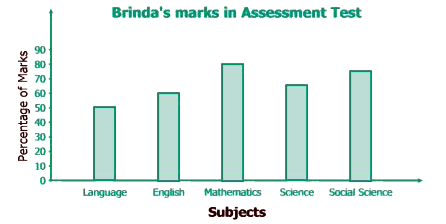
Observe the Bar Graph and answer the following questions.
Brinda has scored minimum marks in ______subject
View SolutionObserve this bar graph which shows the marks obtained by Aziz in half-yearly examination in different subjects. Answer the given questions. (d) State the name of the subjects and marks obtained in each of them.
View SolutionObserve this bar graph which shows the marks obtained by Aziz in half-yearly examination in different subjects. Answer the given questions. State the name of the subjects and marks obtained in each of them.
View SolutionThe marks out of 100 obtained by Kunal and Soni in the Half Yearly Examination are given below:

(a) Draw a double bar graph by choosing appropriate scale.
(b) Calculate the total percentage of marks obtained by Soni.
(c) Calculate the total percentage of marks obtained by Kunal.
(d) Compare the percentages of marks obtained by Kunal and Soni/
(e) In how many subjects did Soni get more marks than Kunal? Which are those subjects?
(f) Who got more marks in S. Science and what was the difference of marks?
(g) In which subject the difference of marks was maximum and by how much? "
View SolutionRead the given Bar Graph which shows the percentage of marks obtained by Brinda in different subjects in an assessment test
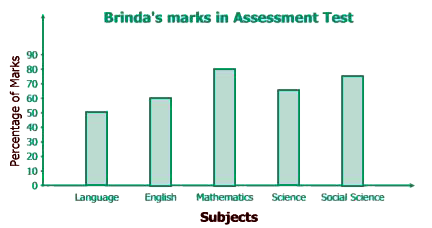
Observe the Bar Graph and answer the following questions.
Brinda scored 20% more in _____subject than _____subject.
View SolutionManoj appeared for ICSE examination 2018 and secured percentage of marks as shown in the following table :

Represent the above data by drawing a suitable bar graph.
View SolutionThe marks (out of 100) obtained by a student in his quarterly examination in various subjects are given below :
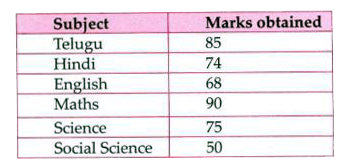
The total percentage of marks scored by the student is.
View SolutionThe table given below shows the marks obtained by six students in 5 different subjects.
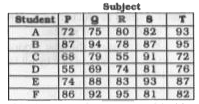
Maximum marks for each subject is 100.
What is the aggregate percentage of marks obtained by student C in all five subjects?
View SolutionThe table given below shows the marks obtained by six students in 5 different subjects.
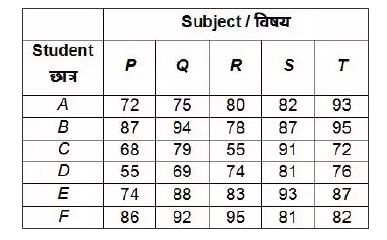
Maximum marks for each subject is 100.
What is the aggregate percentage of marks obtained by student C in all the five subjects?
View Solution