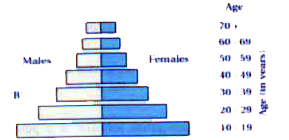
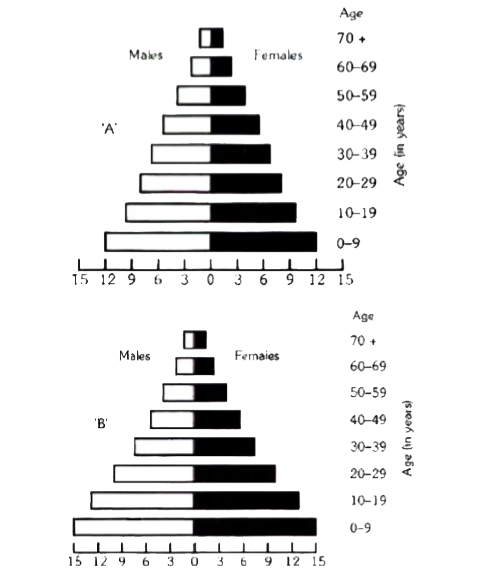
A country with a high rate of population growth took measures to reduce it. The figure below shows age sex pyramids of populations. A and B twenty years apart. Select the correct interpretation about thema A is more recent and shows slight reduction in the growth rate b B is earlier pyramid and shows stabilised growth rate c B is more recent showing that population is very young d A is the earlier pyramid and no change has occurred in the growth rate
Related Solutions
A country with a high rate of population growth took measures to reduce it. The figure below shows age-sex pyramids of populations "A" and "B" twenty years apart. Select the correct interpretation about them Interpretations:
View SolutionA country with a high rate of population growth took measures to reduce it. The figure below shows age-sex pyramids of populations A and B twenty years apart. Select the correct interpretation about them
View SolutionA country with a high rate of population growth took measures to reduce it. The figure below shows age sex pyramids of populations. A and B twenty years apart. Select the correct interpretation about them
View SolutionA country with a high rate of population growth took measures to reduce it. The figure below shows age- sex pyramid of populations A and B twenty years apart. Select the correct interpretation about them.

 View Solution
A country with a high rate of population growth took measures to reduce it. The figure below shows are sex pyramids of populations. A and B twenty years apart. Select the correct interpretation about them. Interpretations
View SolutionA country with a high rate of population growth took measures to reduce it. The figures shows age-sex pyramids of populations A and B twenty years apart. Select the correct interpretation about them:
View SolutionA country with a high rate of population growth took measures to reduce it. The figure below shows agesex pyramids of populations A and B twenty years apart. Select the correct interpretation about them:
 View Solution
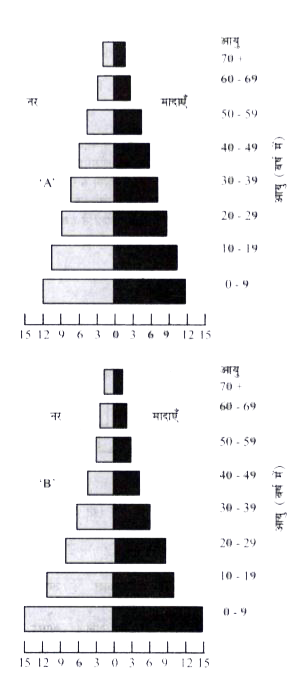
एक देश में जनसंख्या वृद्धि की दर बहुत ऊँची थी और उसने उसे कम करने के कदम उठाये। नीचे दिये जा रहे चित्र में 20 वर्ष के अंतराल वाली दो जनसंख्याओं A और B के आयु सेक्स पिरामिड दिखाये गये हैं। बताइए इनके संबंध में नीचे दी जा रही व्याख्याओं में कौन सी एक सही है:
 View Solution
दिये गये चित्र के सन्दर्भ में सही विकल्प चुनिये :
View SolutionMany population colonising a new habitat show a logistic population growth pattern over time, as shown in the figure below. In such a population, the POPULATION growth rate
View SolutionThe figure below shows the relationship between time and population growth, following the colonization of many populations in their new natural habitat. In such a population, the growth rate of the population
View SolutionPopulation || Local Population and Sister Population || Characteristics OF Population ||Birth Rate || Death Rate || Immigration || Emigration ||Population Growth ||Age Pyramids || Population Density
View SolutionChoose the correct or incorrect statement regarding given figure:

(a) Figure (A) shows more relative growth rate as compare to figure (B).
(b) Figure (A) and figure (B) shows the similar absolute growth rate.View SolutionChoose the correct or incorrect statement regarding given figure:

(a) Figure (A) shows more relative growth rate as compare to figure (B).
(b) Figure (A) and figure (B) shows the similar absolute growth rate.View SolutionDefine 'zero population growth rate'. Draw a age pyramid for the same.
View SolutionDefine 'zero population growth rate'. Draw an age pyramid for the same.
View SolutionDefine zero population growth rate. Make an age pyramid for this.
View SolutionDefine 'zero population growth rate'. Draw a age pyramid for the same.
View SolutionDefine 'zero population growth rate'. Draw a age pyramid for the same.
View SolutionThe births and deaths of four populations A, B, C and D in a year are given below. Which population has the highest growth rate?
View Solution
