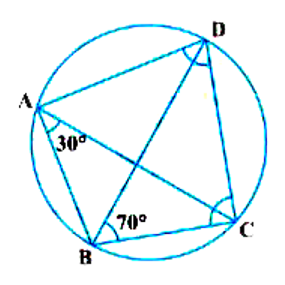
आकृति में, ∠BCD का माप है :

100∘
70∘
80∘
30∘
The correct Answer is:C
Step by step video & image solution for आकृति में, angleBCD का माप है : by Maths experts to help you in doubts & scoring excellent marks in Class 9 exams.
Topper's Solved these Questions
- BOOK - NCERT EXEMPLAR HINDICHAPTER - प्रश्न पत्र सेट -2EXERCISE - खंड ब5videos
प्रश्न पत्र सेट -2
- BOOK - NCERT EXEMPLAR HINDICHAPTER - प्रश्न पत्र सेट -2EXERCISE - खंड स12videos
प्रश्न पत्र सेट -2
- BOOK - NCERT EXEMPLAR HINDICHAPTER - प्रश्न पत्र सेट -1EXERCISE - खंड द7videos
प्रश्न पत्र सेट -1
- BOOK - NCERT EXEMPLAR HINDICHAPTER - बहुपद EXERCISE - प्रश्नावली 2.49videos
बहुपद
Similar Questions
17 और 27 के बीच की एक अपरिमेय संख्या ज्ञात कीजिए।
01:37View Solution25 और 35 के बीच तीन परिमेय संख्याएँ ज्ञात कीजिए।
06:07View Solutionएक शहर में टैक्सी का किराया निम्नलिखित प्रकार से है:
प्रथम किलोमीटर के लिए किराया 10 रु है तथा उसके बाद की दूरी के लिए यह किराया 6 रु प्रति km है। तय की गई दूरी x km और कुल किराया y रु लेते हुए, इस सूचना के लिए एक रैखिक समीकरण लिखिए और उसका आलेख खींचिए। इस आलेख से 4km की दूरी तय करने का किराया ज्ञात कीजिए।02:11View Solutionयदि बहुपदो az3+4z2+3z−4 और z3−4z+a को z−3 से भाग देने पर, प्रत्येक दशा में समान शेषफल प्राप्त होता है, तो a का मान ज्ञात कीजिए।
01:31View SolutionHow many lines of symmetry does the above figure have ?
02:45View SolutionWhich of the following are correct chain isomers of butane ? (i)
02:17View SolutionDetermine the point of symmetry of a regular hexagon.
05:41View SolutionDtermine the images of the following figure about the given line :
02:21View SolutionMatch the following Column A to Column B
 02:03View Solution
Match the following Column A to Column B
 02:10View Solution
Match the following Column A to Column B
 02:17View Solution
Find the area of the figure given below.
 02:10View Solution
The area of the shaded part in the figure given below is ______.
 04:23View Solution
The inequation represented by the graph given below is :
01:13View SolutionThe inequation that best describes the graph given below is _________
03:12View SolutionThe inequation that best describes the following graph is _________
05:46View Solution

