1 मिलियन = ……………. हजार
The correct Answer is:1000
Step by step video, text & image solution for 1 मिलियन = ……………. हजार by Maths experts to help you in doubts & scoring excellent marks in Class 6 exams.
Topper's Solved these Questions
- BOOK - DAS GUPTACHAPTER - संख्याओं की जानकारी EXERCISE - प्रश्नमाला 1(B) रिक्त स्थान6videos
संख्याओं की जानकारी
- BOOK - DAS GUPTACHAPTER - संख्याओं की जानकारी EXERCISE - प्रश्नमाला 1(B)19videos
संख्याओं की जानकारी
- BOOK - DAS GUPTACHAPTER - संख्याओं की जानकारी EXERCISE - प्रश्नमाला 1(A) रिक्त स्थानों को चिन्ह से भरे।4videos
संख्याओं की जानकारी
- BOOK - DAS GUPTACHAPTER - विविध वस्तुनिष्ठ प्रश्न EXERCISE - सही उत्तर का संकेताक्षर चुने।15videos
विविध वस्तुनिष्ठ प्रश्न
- BOOK - DAS GUPTACHAPTER - संख्याओं के साथ खेलना EXERCISE - तृतीय जाँच-परीक्षा के प्रश्न पत्र23videos
संख्याओं के साथ खेलना
Similar Questions
1 किलोमीटर = ……………. मीटर
View Solutionएक संख्या 219756 से 119289 अधिक है। संख्या को निकालिए।
43:40View Solution498201………...497981
01:49View Solutionयदि a, b और c पूर्ण संख्याएँ हो तो किस नियम के आधार पर a(bc)=(ab)c होता है ?
02:43View Solution72 के सभी गुणनखंडों को लिखिए।
48:29View Solutionआपके नाम से प्रेषित एक हजार रु. के मनीआर्डर की प्राप्ति न होने का शिकायत पत्र अधीक्षक पोस्ट आफिस को लिखिए।
02:09View Solutionपार्ट्स पर मिलियन|मोल अंश|प्रश्न|मोलरता|मोललता|Summary
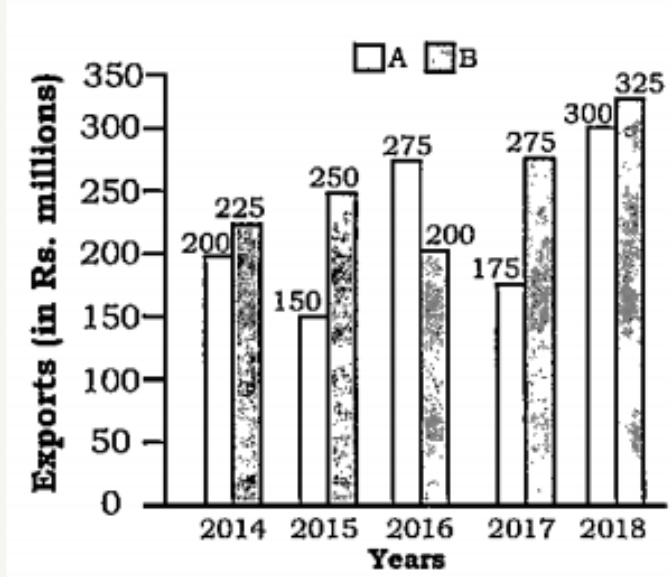
02:16View SolutionThe bar graph shows the exports of Cars of Type A and B (in Rs. million).
दिए गए दंड आरेख में टाइप A और B कारो के निर्यात को दर्शाया गया है (मिलियन रु. में) What is the ratio of the exports of cars of Type A in 2014 and 2018 to the total exports of cars of type B in 2015 and 2016?
2014 और 2018 में टाइप A कारो के कुल निर्यात और 2015 और 2016 में टाइप B कारो के कुल निर्यात का अनुपात क्या हे?02:00View SolutionStudy the following graph which shows the production (in thousand) of different items, and answer the questions. निम्नलिखित ग्राफ का अध्ययन कीजिए, जिन विभिन्न मदों का उत्पादन (हजार में) दर्शाया गया है तथा दिए गए प्रश्नों के उत्तर दीजिए। The total number of all products produced by the company in the year 2006 and 2008 together is:- कंपनी द्वारा वर्ष 2006 और 2008 में तेयार सभी उत्पादों को मिलाकर उनकी कुल संख्या कितनी है?
01:37View Solutionआकलन |सन्निकट |सन्निकट द्वारा निकटतम दहाई का आकलन |प्रश्न |सन्निकट द्वारा निकटतम सैकड़ों का आकलन |प्रश्न |सन्निकट द्वारा निकटतम हजार का आकलन |OMR
02:44View SolutionTable shows the production of rice (in million tonnes) of three states over six years. यह तालिका तीन राज्यों में छः वर्षों में दौरान चावल के उत्पादन ( मिलियन टन में ) को दर्शाती है | What is the ratio of the production of rice in all three states in the year 2014 to that in 2016? सभी तीन राज्यों में वर्ष 2014 तथा 2016 में उत्पादित चावल की मात्रा में अनुपात ज्ञात करें |
03:00View SolutionThe bar chart shows the annual food grain production (in million tonnes) for years 2012-2017. For how many years is the production less than the average production during the given period? यह दंड आरेख वर्ष 2012-2017 की अवधि में वार्षिक खाद्यान्न उत्पादन (मिलियन टन में ) को दर्शाता है | कितने वर्ष उत्पादन इस अवधि के औसत उत्पादन से कम है ?
01:56View SolutionThe following bar graph shows the quantity (in million) of grains exported by a country for a period. The maximum export is what percent more than the minimum export in the given period ? निम्नलिखित दंड आरेख के दौरान किसी देश द्वारा निर्यात किए गए अनाज की मात्रा (मिलियन में) दर्शाता है | दी गई अवधि में अधिकतम निर्यात न्यूनतम निर्यात से कितना प्रतिशत अधिक है ?
View SolutionThe bar graph given below shows the profit (in multiples of thousand rupees) of a company during the year 2010-2018. The average profit for the year 2015-2017 is what percentage more than the 2012 profit? नीचे दिए गए दंड आरेख में वर्ष 2010-2018 के दौरान किसी कंपनी के लाभ (हजार रुपए के गुणक में) को दर्शाया गया है | वर्ष 2015-2017 का औसत लाभ 2012 के लाभ से कितना प्रतिशत अधिक है ?
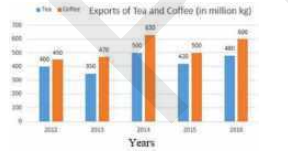
View SolutionThe given Bar Graph presents the Export of Tea and Coffee (in million kg) for the years 2012 to 2016. What is the ratio of total export of tea in 2012, 2014 and 2015 to the total export of coffee in 2013 and 2014?
दिया गया दंड आरेख वर्ष 2012 से 2016 के दौरान चाय और कॉफ़ी के निर्यात ( मिलियन किलो ग्राम में ) को दर्शाता है |
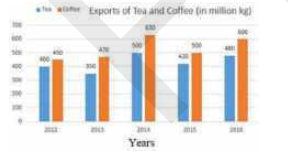
2012, 2014 और 2015 में चाय के कुल निर्यात का 2013 और 2014 में कॉफ़ी के कुल निर्यात के साथ अनुपात ज्ञात करें |03:49View SolutionThe given Bar Graph presents the Export of Tea and Coffee (in million kg) for the years 2012 to 2016.
दिया गया दंड आरेख वर्ष 2012 से 2016 के दौरान चाय और कॉफ़ी के निर्यात ( मिलियन किलो ग्राम में ) को दर्शाता है |
The number of years, in each of which the export of coffee is more than 20% as compared to the export of tea in that year is:
ऐसे कितने वर्ष हैं जिनमें से प्रत्येक में कॉफ़ी का निर्यात इस वर्ष में चाय के निर्यात की तुलना में 20% अधिक है ?42:02View Solution

