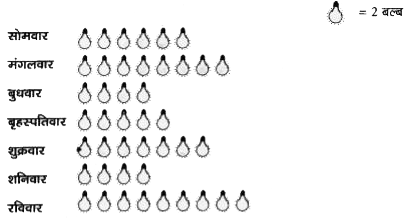
किसी सप्ताह के विभिन्न दिनों में बिजली के बल्बों की बिक्री नीचे दर्शाई गई है :

चित्रालेख को देखिए और निम्नलिखित प्रश्न का उत्तर दीजिए :
शुक्रवार को कितने बल्ब बेचे गए ?
The correct Answer is:14 बल्ब
चूंकि उपर्युक्त चित्रआलेख मे हमे पैमाना दिया गया है : 1 आकृति = 2 बल्व
शुक्रवार मे आकृतियों की संख्या =7
अतः शुक्रवार को बेचे गए बल्वो की संख्या =
=आकृतियों की संख्या ×2
= 7×2
=14
अतः शुक्रवार को बेचे गए बल्वों की संख्या 14 है।
Topper's Solved these Questions
- BOOK - MBD PUBLICATIONCHAPTER - आँकड़ों का प्रबंधन EXERCISE - अभ्यास के लिए अतिरिक्त प्रश्न30videos
आँकड़ों का प्रबंधन
- BOOK - MBD PUBLICATIONCHAPTER - आँकड़ों का प्रबंधन EXERCISE - प्रश्नावली 9.25videos
आँकड़ों का प्रबंधन
- BOOK - MBD PUBLICATIONCHAPTER - अपनी संख्याओं की जानकारीEXERCISE - वस्तुनिष्ठ प्रश्न21videos
अपनी संख्याओं की जानकारी
- BOOK - MBD PUBLICATIONCHAPTER - आधारभूत ज्यामितीय अवधारणाएँ EXERCISE - वस्तुनिष्ठ प्रश्न (नीचे प्रत्येक प्रश्न चार - चार उत्तर दिए है। सही उत्तर का चयन करें।)28videos
आधारभूत ज्यामितीय अवधारणाएँ
Similar Questions
निम्न आँकड़े कक्षा VI के 20 विद्यार्थियों की आयु (वर्षों में) दर्शाते हैं ?
9,10,10,9,9,11,9,11,9,10,11,10,11,9,10,9,12,12,9,10
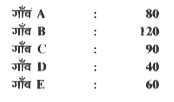
10 वर्ष की आयु वाले विद्यार्थी कितने हैं ?01:37View Solutionपाँच गाँवों में पशुओं की कुल संख्या इस प्रकार है:

संकेत ⊗का प्रयोग करके जो 10 पशुओं को निरूपित करता है, इन पशुओं का एक चित्रालेख बनाइए और निम्न प्रश्नों के उत्तर दीजिए :
गाँव E के पशुओं को कितने संकेत निरूपित करते हैं ?06:07View Solution101, 112,99, 100 में से सबसे छोटी संख्या है:
02:11View Solutionएक रेखा के :
01:31View SolutionHow many lines of symmetry does the above figure have ?
02:45View SolutionWhich of the following are correct chain isomers of butane ? (i)
02:17View SolutionDetermine the point of symmetry of a regular hexagon.
05:41View SolutionDtermine the images of the following figure about the given line :
02:21View SolutionMatch the following Column A to Column B
 02:03View Solution
Match the following Column A to Column B
 02:10View Solution
Match the following Column A to Column B
 02:17View Solution
Find the area of the figure given below.
 02:10View Solution
The area of the shaded part in the figure given below is ______.
 04:23View Solution
The inequation represented by the graph given below is :
03:02View SolutionThe inequation that best describes the graph given below is _________
03:12View SolutionThe inequation that best describes the following graph is _________
05:46View Solution

