निम्नलिखित बारम्बारता बंटन किसी मोहल्ले के 68 उपभोक्ताओं की बिजली की मासिक खपत दर्शाता है ।

इन आँकड़ों के माधयक तथा माध्य ज्ञात कीजिए ।
The correct Answer is:माध्यक = 137 इकाई, माध्य = 137.05 इकाई
Step by step video & image solution for निम्नलिखित बारम्बारता बंटन किसी मोहल्ले के 68 उपभोक्ताओं की बिजली की मासिक खपत दर्शाता है । इन आँकड़ों के माधयक तथा माध्य ज्ञात कीजिए । by Maths experts to help you in doubts & scoring excellent marks in Class 10 exams.
Topper's Solved these Questions
- BOOK - MANOHAR RAYCHAPTER - सांखियकीEXERCISE - प्रश्नावली 14(D)7videos
सांखियकी
- BOOK - MANOHAR RAYCHAPTER - सांखियकीEXERCISE - प्रश्नावली 14(E)9videos
सांखियकी
- BOOK - MANOHAR RAYCHAPTER - सांखियकीEXERCISE - प्रश्नावली 14(B)6videos
सांखियकी
- BOOK - MANOHAR RAYCHAPTER - समांतर श्रेणी EXERCISE - प्रश्नावली 5(E)18videos
समांतर श्रेणी
Similar Questions
निम्नलिखित सारणी किसी अस्पताल में एक विशेष वर्ष में भर्ती हुए रोगियों की आयु को दर्शाती हैं :

उपरोक्त आँकड़ों से बहुलक ज्ञात कीजिए।01:37View Solutionनिम्नलिखित बंटन किसी फैक्ट्री के 50 श्रमिकों की दैनिक आय दर्शाता है :
 उपरोक्त बंटन को एक 'कम प्रकार ' के संचयी बारम्बारता बंटन में बदलिए और उसका तोरण खिचिएं।06:07View Solution
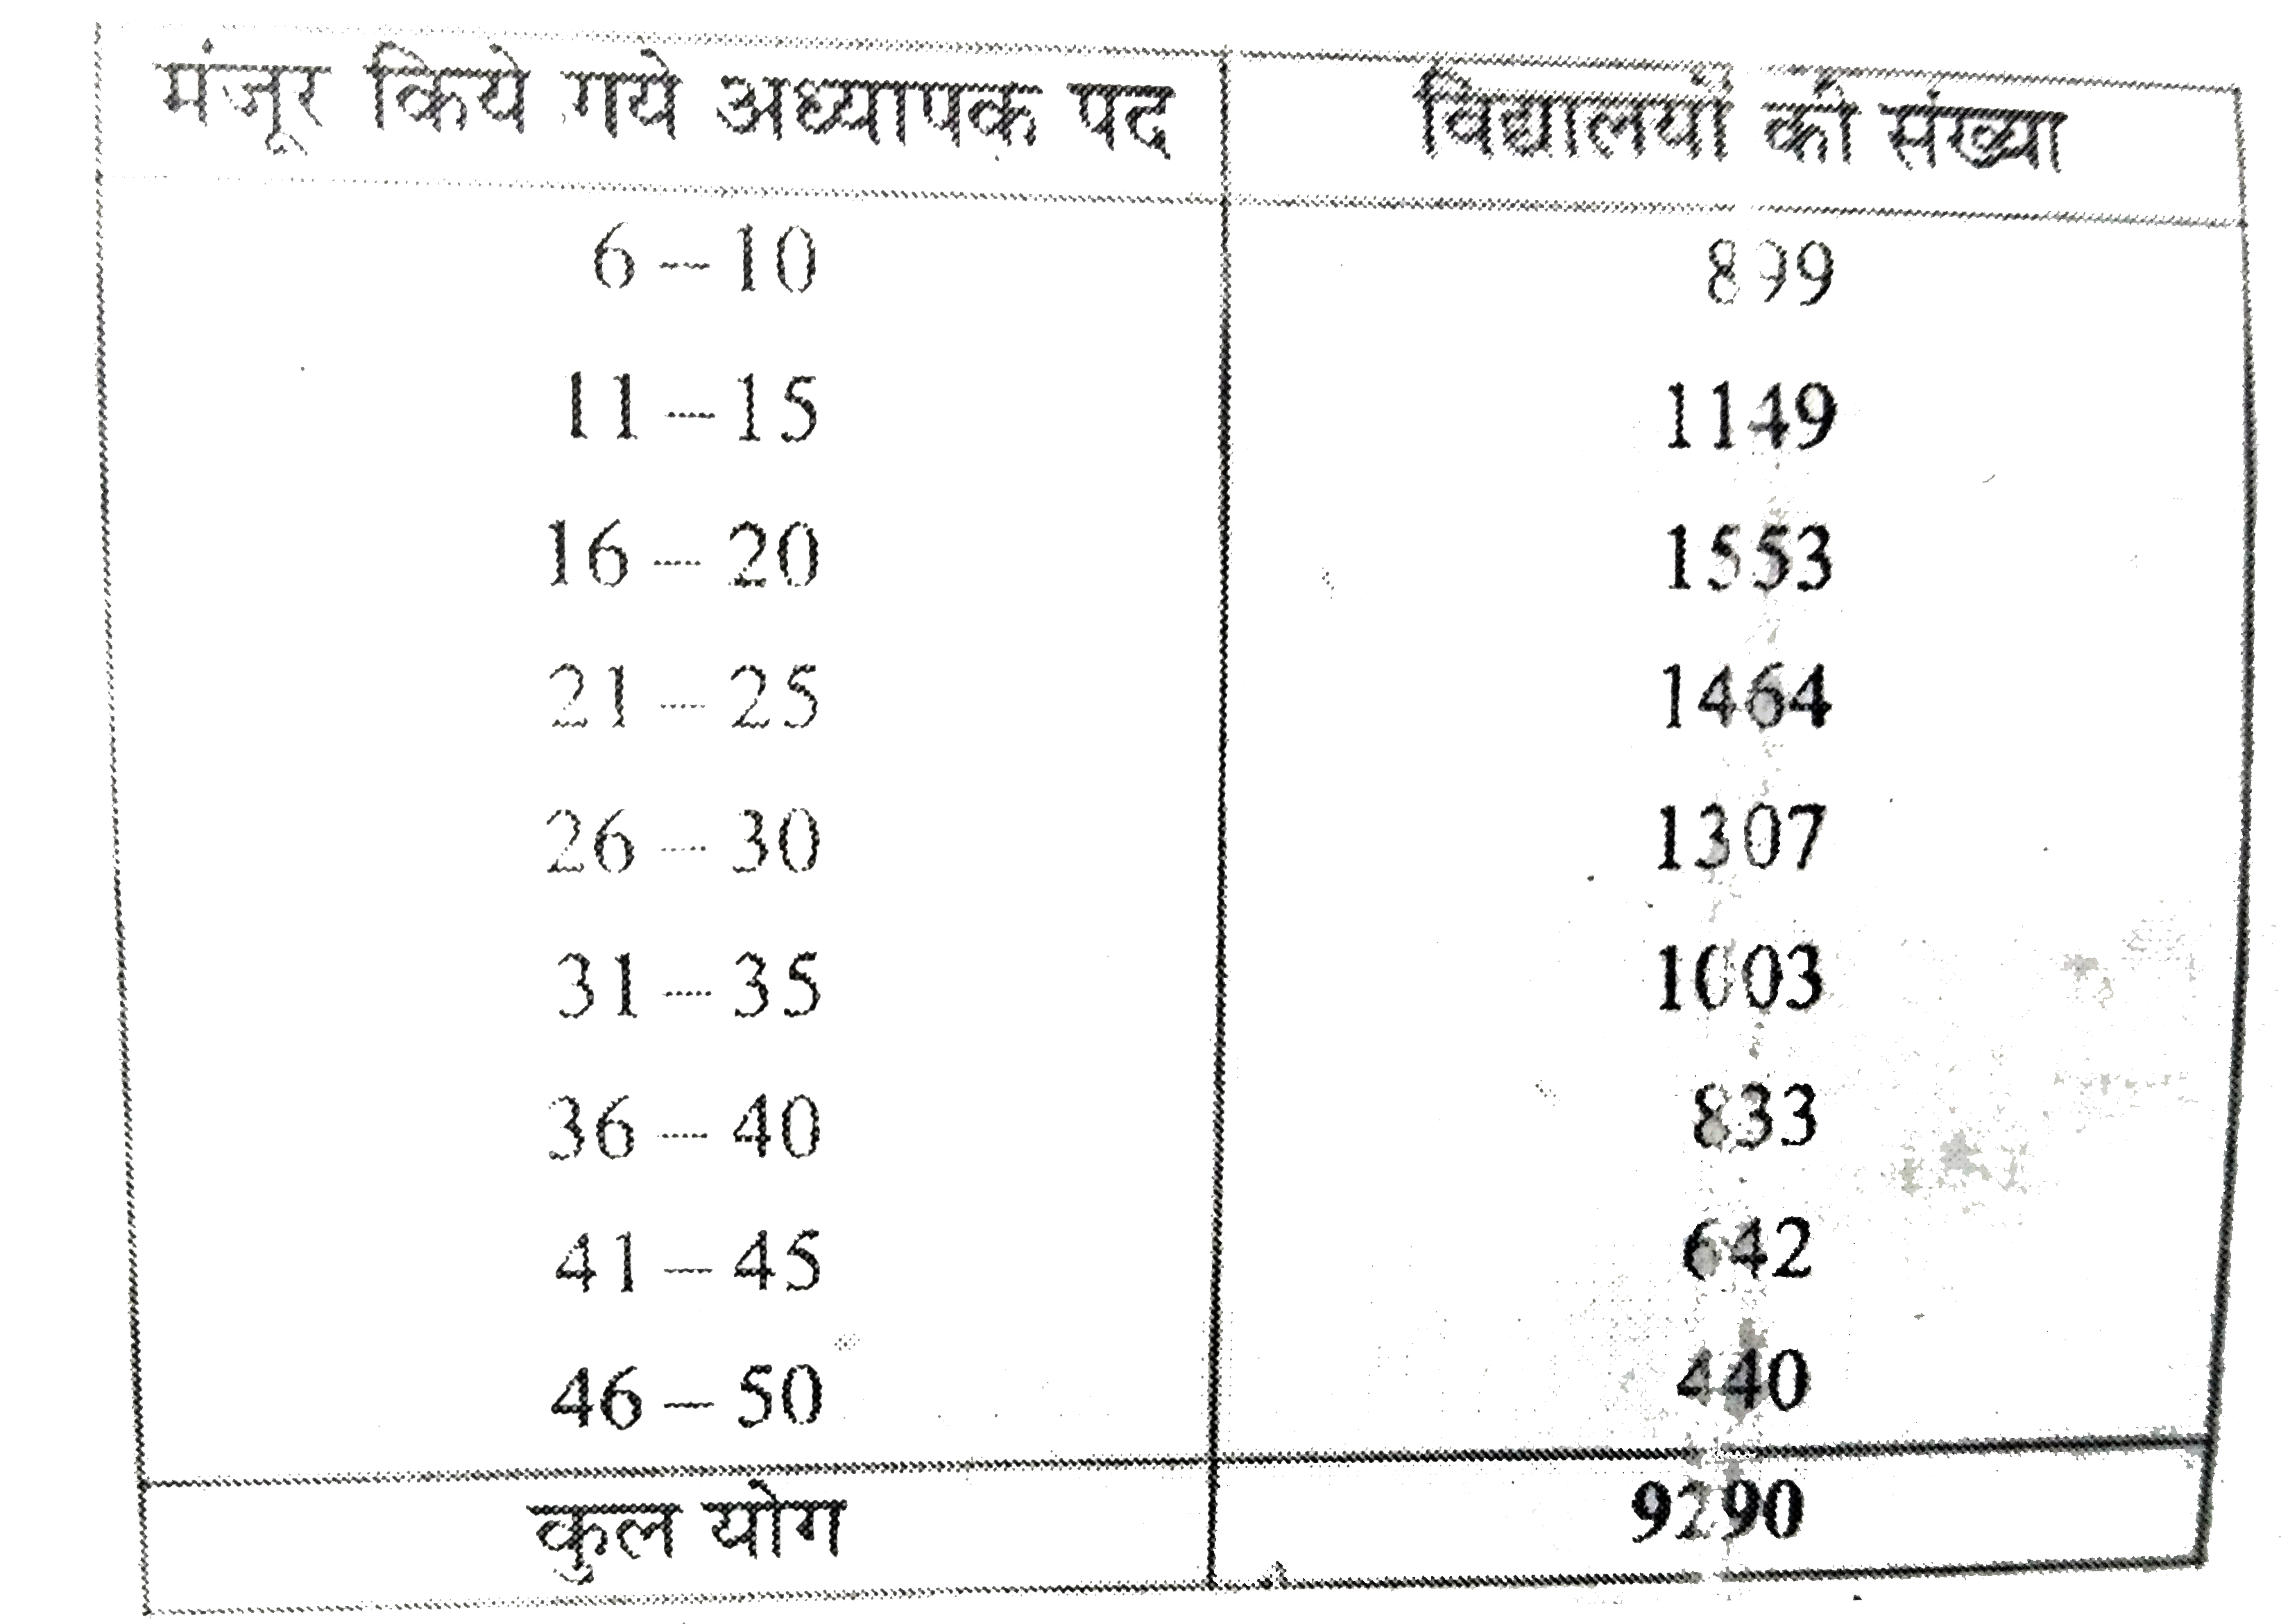
नीचे की सारणी में उच्चतर माध्यमिक विद्यालयों में मंजूर किये गए अध्यापक पदों की संख्या का वारम्बारता बंटन दिया गया है :

प्रति उच्चतर माध्यमिक विद्यालय में मंजूर किये गये अध्यापक पदों की औसत संख्या ज्ञात कीजिए ।02:11View Solutionकिसी स. श्रे. में, यदि d--4, n=7 और an=4 है, तो a का मान है :
01:31View SolutionHow many lines of symmetry does the above figure have ?
02:45View SolutionWhich of the following are correct chain isomers of butane ? (i)
02:17View SolutionDetermine the point of symmetry of a regular hexagon.
05:41View SolutionDtermine the images of the following figure about the given line :
02:21View SolutionMatch the following Column A to Column B
 02:03View Solution
Match the following Column A to Column B
 02:10View Solution
Match the following Column A to Column B
 02:17View Solution
Find the area of the figure given below.
 02:10View Solution
The area of the shaded part in the figure given below is ______.
 04:23View Solution
The inequation represented by the graph given below is :
01:13View SolutionThe inequation that best describes the graph given below is _________
03:12View SolutionThe inequation that best describes the following graph is _________
05:46View Solution

