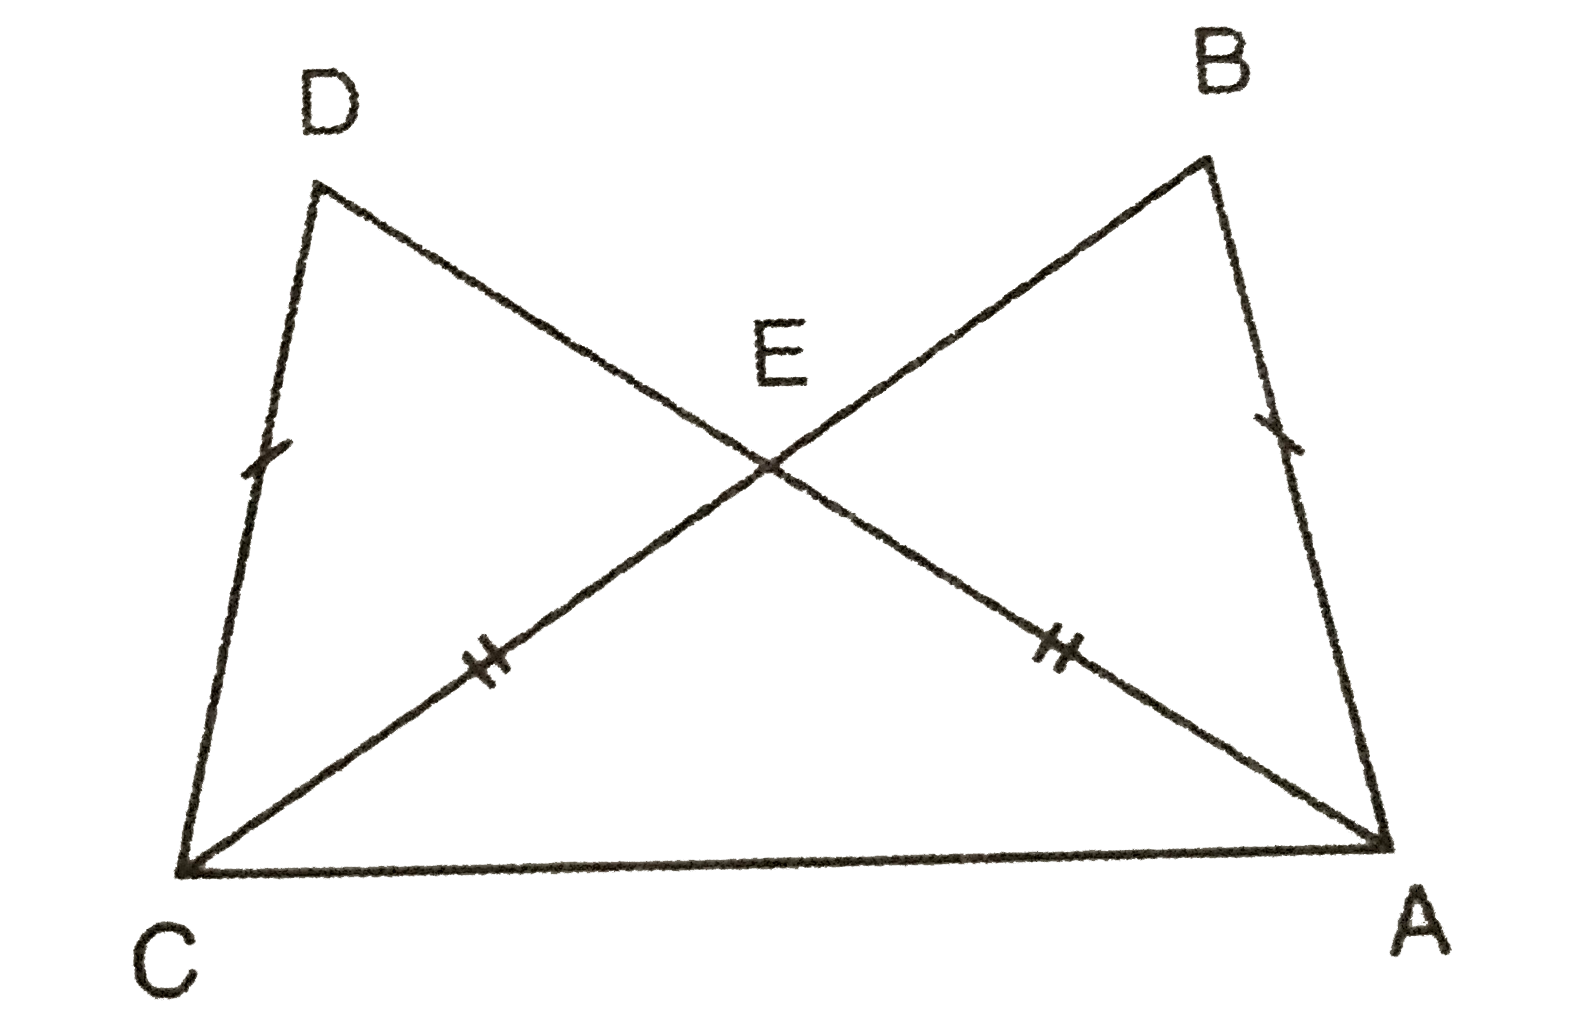
दिया है कि AB=CD तथा AD=BC तो, सिध्द करो कि ΔADC≅ΔCBA है |

ΔADC तथा ΔCBAमें
AB=CD [दिया है]
AD=BC [दिया है]
AC=AC [उभयनिष्ठ भुजा]
अतः भुजा-भुजा-भुजा सर्वागसमता कसौटी से

ΔADC≅ΔCBA
Topper's Solved these Questions
- सर्वांगसम त्रिभुजेंBOOK - RD SHARMACHAPTER - सर्वांगसम त्रिभुजेंEXERCISE - प्रश्नावली 10.1
13 Videos
- सर्वांगसम त्रिभुजेंBOOK - RD SHARMACHAPTER - सर्वांगसम त्रिभुजेंEXERCISE - प्रश्नावली 10.2
3 Videos
- समांतर चतुर्भुजों और त्रिभुजों के क्षेत्रफल BOOK - RD SHARMACHAPTER - समांतर चतुर्भुजों और त्रिभुजों के क्षेत्रफल EXERCISE - बहु विकल्पीय प्रश्न
20 Videos
- सांखि्यिकीय आँकड़ों का सारणीयनBOOK - RD SHARMACHAPTER - सांखि्यिकीय आँकड़ों का सारणीयनEXERCISE - बहु विकल्पीय प्रश्न
10 Videos
Similar Questions
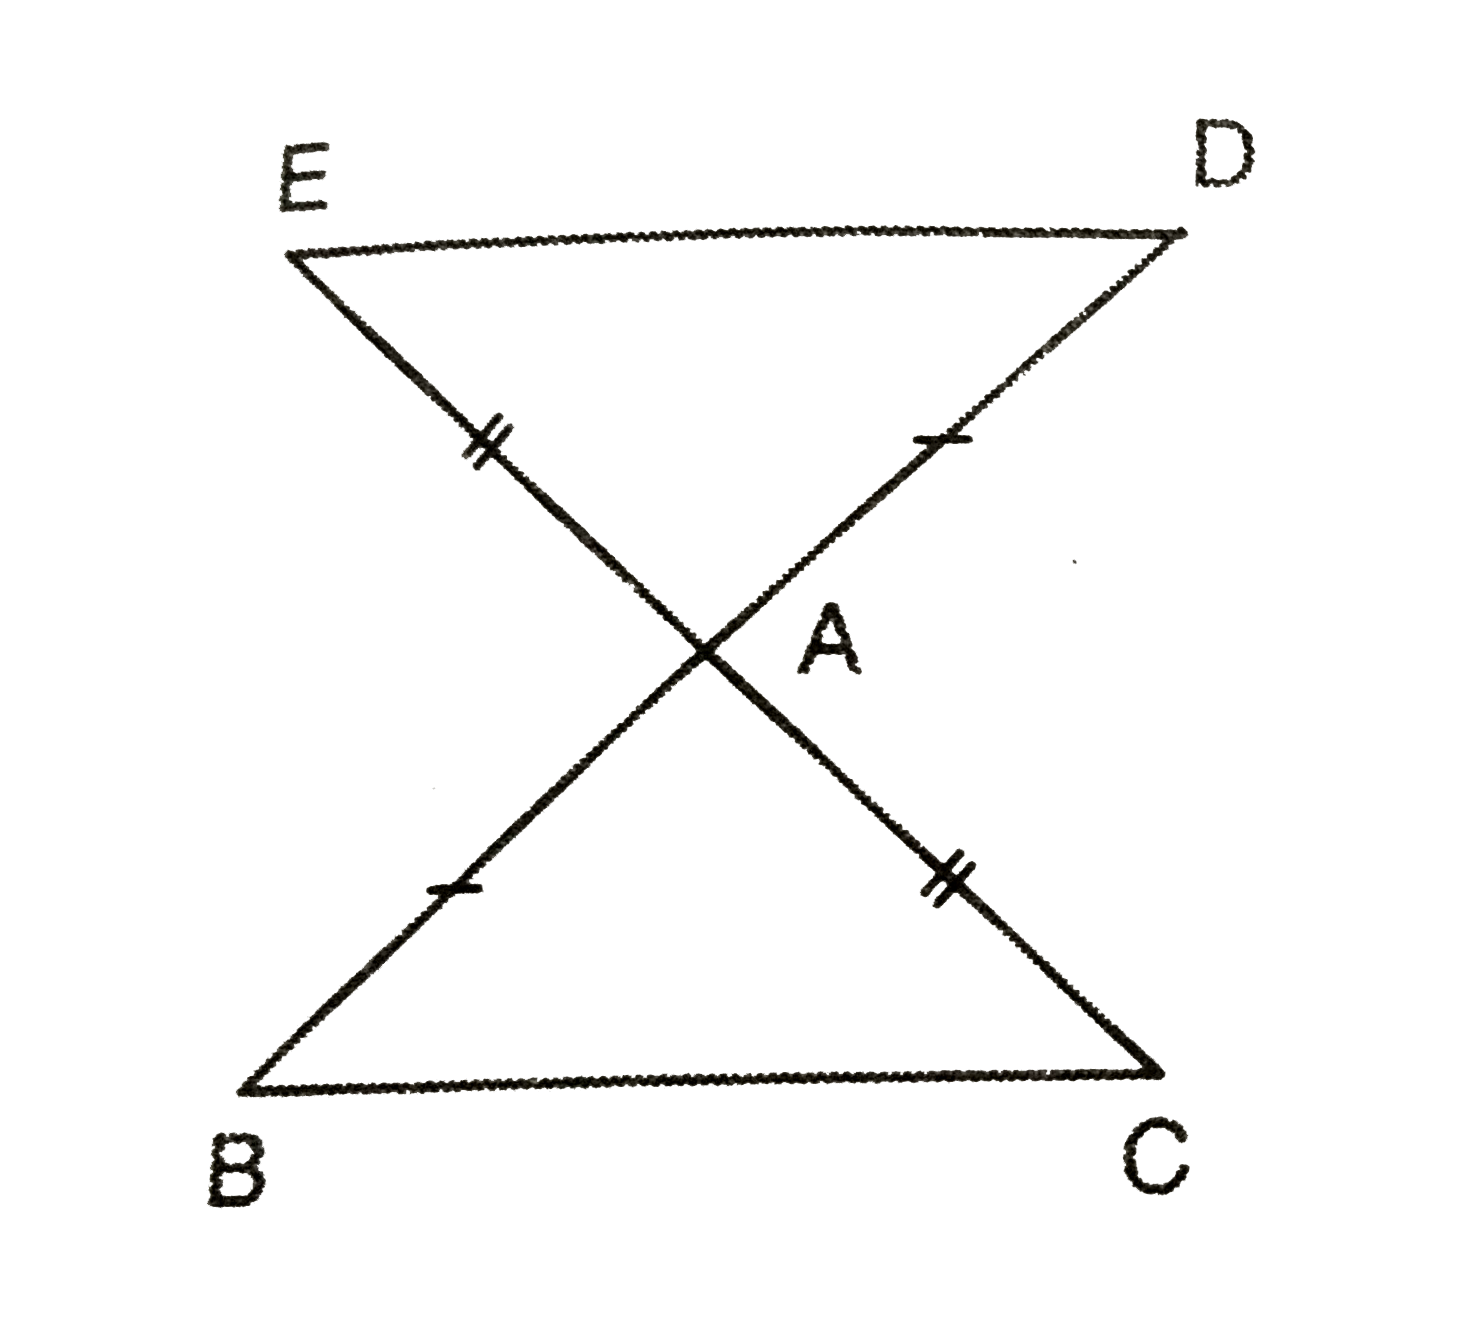
भुजाएँ BA तथा CA तथा इस प्रकार बढ़ाई गई कि BA=AD तथा CA=AE हैं | सिध्द कीजिए कि रेखाखण्ड DE∣∣BC है |

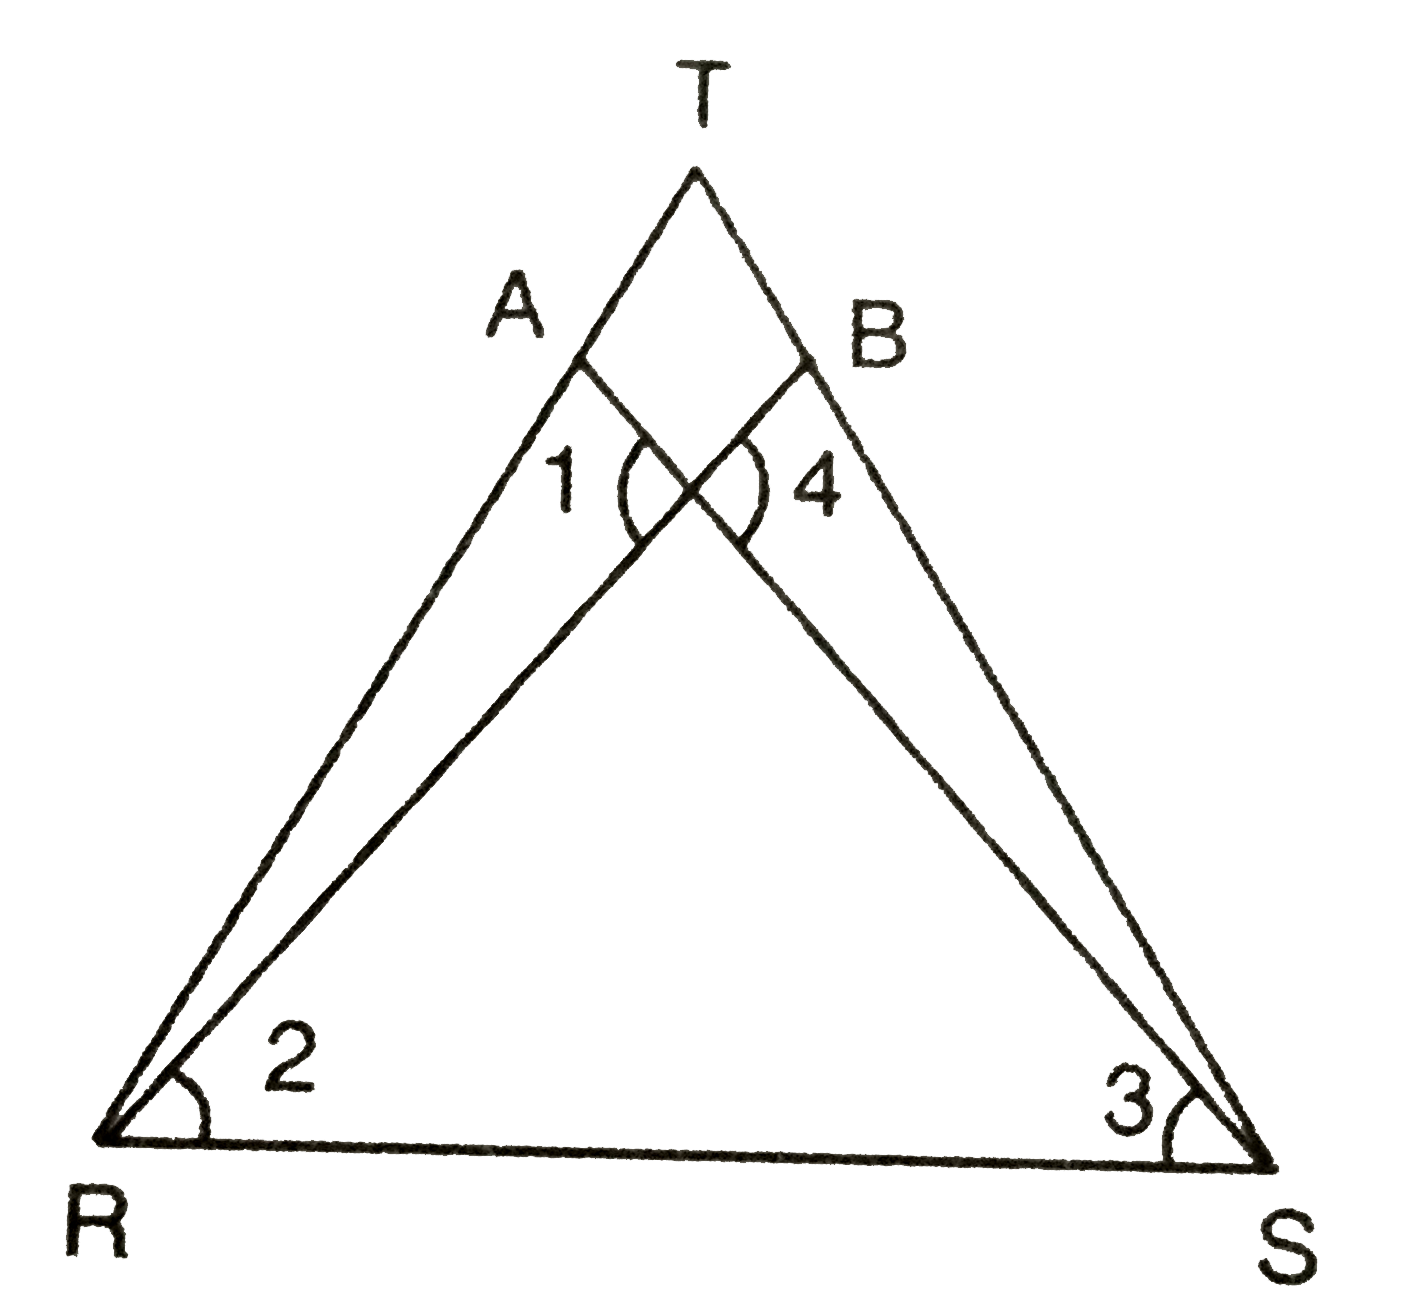
View Solutionयह दिया है RT=TS ∠1=2√3 तथा ∠4=2Sqrt(3)तो, दर्शाइए कि ΔRBT≅ΔSAT

View Solutionयदि दो समांतर चतुर्भुजों का एक ही आधार है और समान समांतर रेखाओं के बीच स्थित है तो उनके क्षेत्रफलों के बीच क्या अनुपात होगा :
View Solutionप्रेक्षणो के सग्रह में से उच्चतम एव न्यूनतम प्रेक्षणो के अन्तर को कहते है ?
View SolutionIn the given figure (not to scale), O is the centre of the circle. A,B,C and D are concyclic and AB=CD . If /_MON =120^(@) , then find /_ OPN .
View SolutionHow many lines of symmetry does the above figure have ?
View SolutionWhich of the following are correct chain isomers of butane ? (i)
View SolutionDetermine the point of symmetry of a regular hexagon.
View SolutionDtermine the images of the following figure about the given line :
View SolutionIn the figure above (not to scale), ¯¯¯¯¯¯AB⊥¯¯¯¯¯¯CDandAD is the bisector of ∠BAE.AB=3cm and AC=5cm. Find CD.
View SolutionMatch the following Column A to Column B

View SolutionMatch the following Column A to Column B

View SolutionMatch the following Column A to Column B

View SolutionThe inequation represented by the graph given below is :
View SolutionThe inequation that best describes the graph given below is _________
View SolutionThe inequation that best describes the following graph is _________
View Solution
