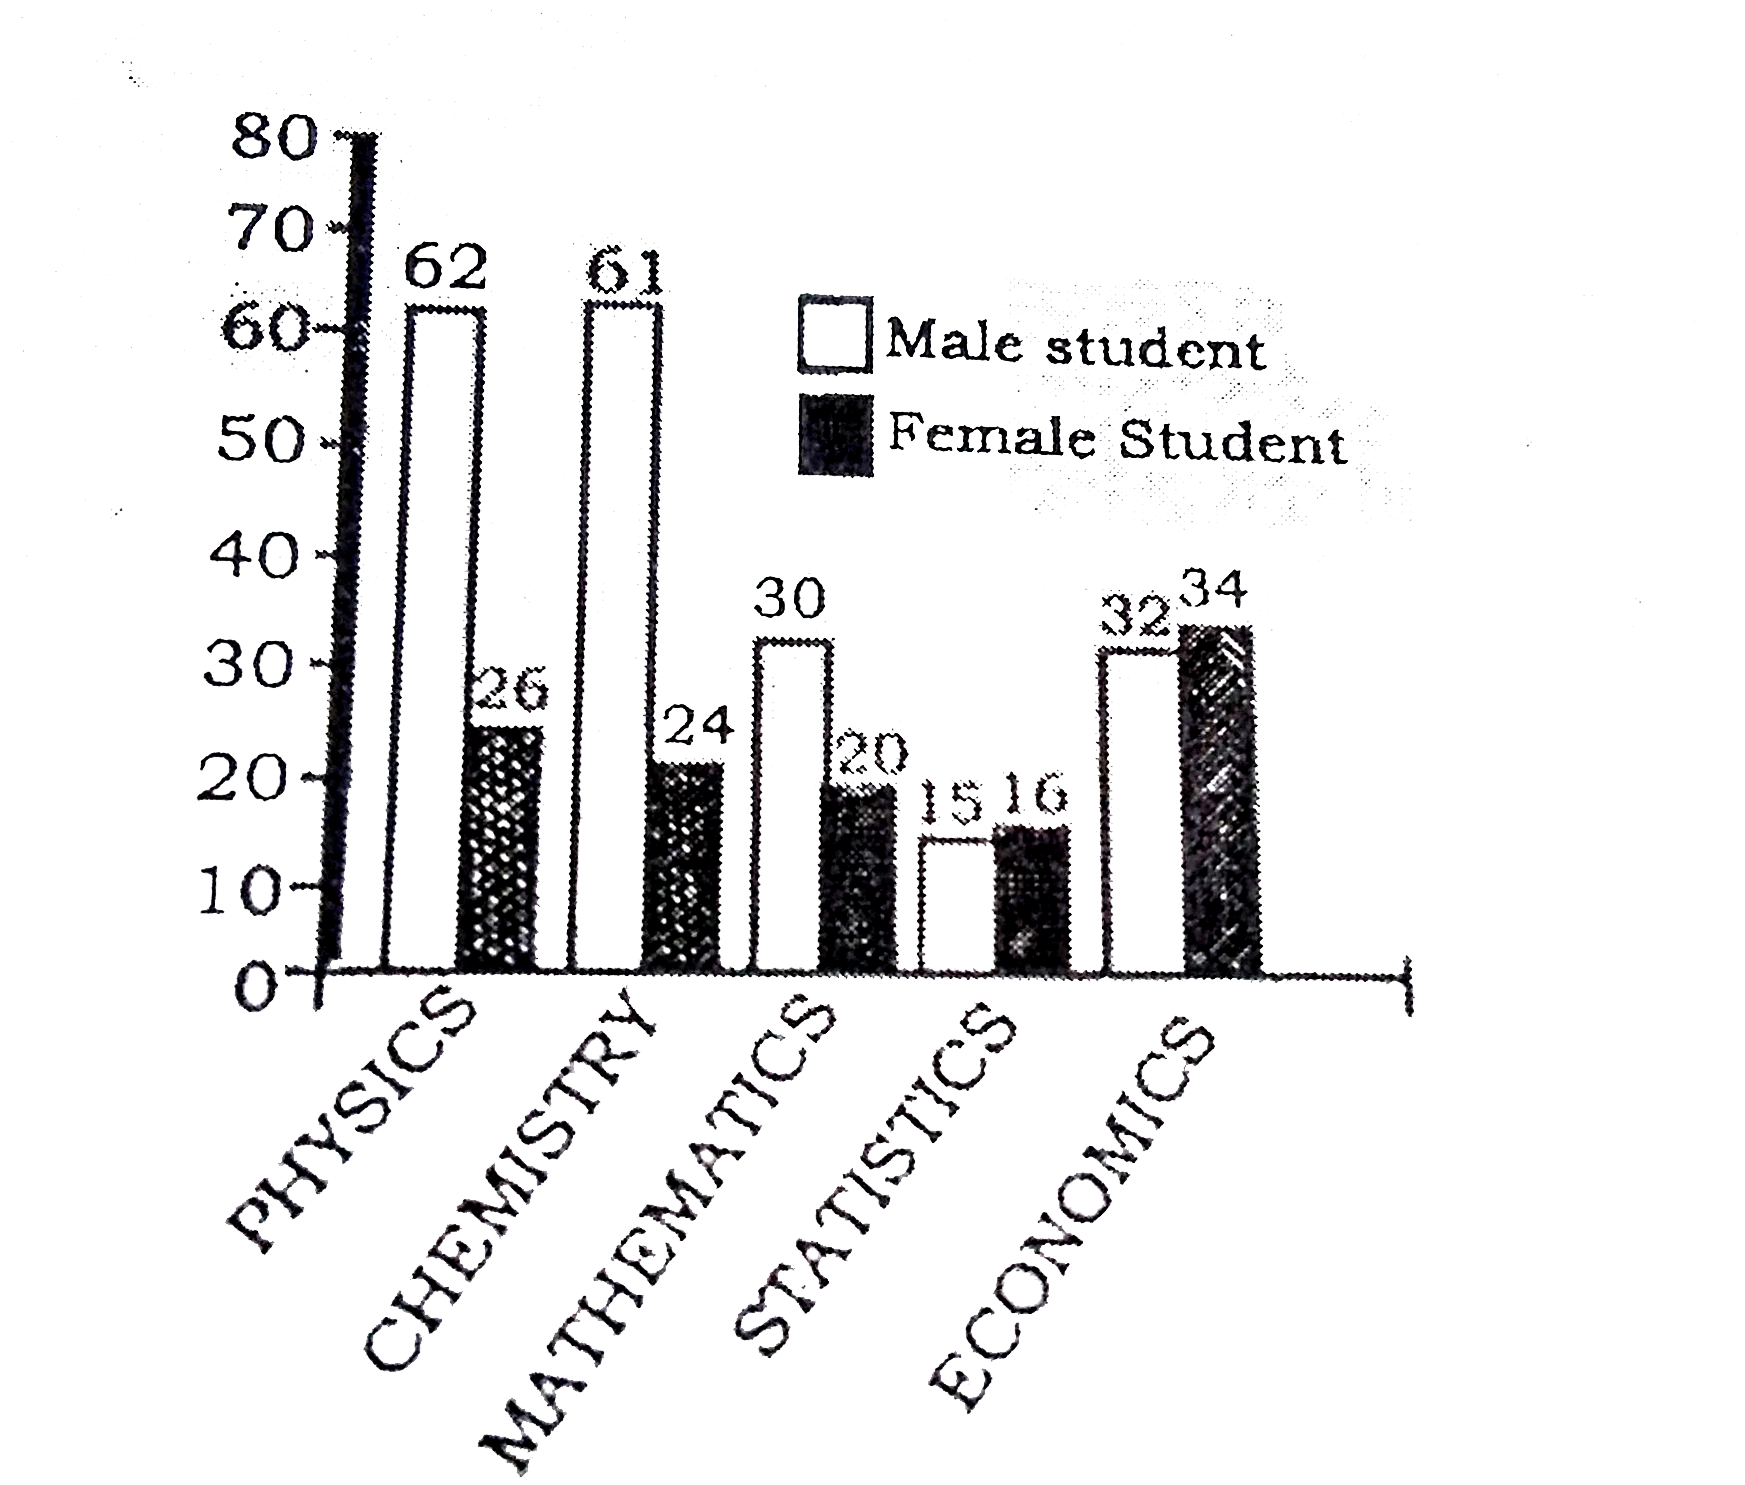
बार डायग्राम में दिए गए आकड़े किसी कॉलेज को बी ऐश सी (अनार्ष)प्रथम वर्ष की कक्षाओं में 320 छात्रों के पांच विषयो में विभागवार प्रवेश से सम्बंधित है प्राप्त का अध्यन कीजिये और पर्सेनो के उतर दीजिये?

(पुरुष) छात्रों एव (महिला) छात्रों की संख्या में अंतर किस विषय में न्यूतम है?
रसायन
भौतिकी
सांख्यकी
अर्थशास्त्र
Statistics (1), it is clear from graph.
Similar Questions
The given Bar Graph presents the number of students of two schools for six years. दिया गया दंड आरेख छः वर्ष की अवधि में दो विद्यालयों में छात्रों की संख्या को दर्शाता है | In which year, the absolute difference of the students in two schools is the lowest? किस वर्ष में, दोनों विद्यालयों के छात्रों में पूर्ण अंतर सबसे कम है ?
View SolutionThe given Bar Graph presents the number of students of two schools for six years. दिया गया दंड आरेख छः वर्ष की अवधि में दो विद्यालयों में छात्रों की संख्या को दर्शाता है | In which year, the percentage increase of students in school A is the highest in comparison to its previous year? किस वर्ष, विद्यालय A में छात्रों की संख्या में प्रतिशत वृद्धि पिछले वर्ष की तुलना में सर्वाधिक है ?
View SolutionIn the given bar graph, the percentage decrease in the number of students in Institute A in 2016 is what percent of students in 2015. इस दंड आरेख में संस्थान A में 2016 में छात्रों की संख्या में प्रतिशत कमी 2015 के छात्रों की संख्या का क्या प्रतिशत है ?
View SolutionStudy the pie chart and answer the question that follows
आरेख का अध्ययन करें और प्रश्न का उत्तर दे।
Break up (degree wise) of students in terms of specialization in different areas (A,B,C,D&E) in MBA program.
MBA कार्यक्रम में विभिन्न क्षेत्रों (A, B, C, D और E) में विशेषज्ञता के संदर्भ में छात्रों का वितरण
The number of students specialising in E is what percent more than that of students specialising in C?
E में विशेषज्ञता प्राप्त छात्रों की संख्या, C में विशेषज्ञता प्राप्त छात्रों की संख्या की तुलना में कितना प्रतिशत अधिक है?
View SolutionThe given bar graph shows the number of students of two schools over a period of six years
दिया गया दंड आरेख में छह साल की अवधि में दो स्कूलों के छात्रों की संख्या को दर्शाता है।
In the bar graph, in which year is the sum of the students from schools A and B taken together is minimum ?
दंड आरेख में, A और B स्कूलों के छात्रों का योग किस वर्ष में न्यूनतम है?
View Solutionछात्रों के लिखित कार्य के आकलन में सर्वाधिक महत्त्वपूर्ण है
View SolutionThe following figure shows the number of students (in thousands) admitted and passed out per your in a college during years 2000 to 2004, study the figure and answer the questions : : निम्नलिखित आकृति में किसी कॉलेज में वर्ष 2000 से वर्ष 2004 तक प्रति वर्ष भर्ती हुए और उर्तीण हुए छात्रों की संख्या (हजार में) दर्शायी गई है। आकृति का अध्ययन कर प्रश्नों के उत्तर दीजिए : The percent increase in the number of students admitted in the year 2003 over that in 2001 is वर्ष 2001 की तुलना में वर्ष 2003 में भर्ती हुए छात्रों की संख्या में हुई प्रतिशत वृद्धि कितनी है ?
View Solutionपढ़ाया गया विषय छात्रों को कितना समझ में आया, यह किस सिद्धांत के माध्यम से पता चलता है?
View Solution
