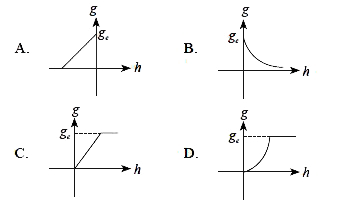
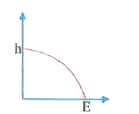
Which of the following graphs depicts the variation of of a ball bouncing on a horizontal floor with height ? (Neglect air resistances)
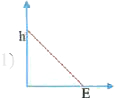
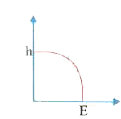
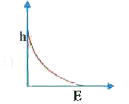
The correct Answer is:
KE = loss in PE
E = - mgh + mgH which is similar to y = -mx + c
Topper's Solved these Questions
- BOOK - NARAYNACHAPTER - WORK , ENERGY & POWER EXERCISE - EXERCISE -III54videos
WORK , ENERGY & POWER
- BOOK - NARAYNACHAPTER - WORK , ENERGY & POWER EXERCISE - EXERCISE IV43videos
WORK , ENERGY & POWER
- BOOK - NARAYNACHAPTER - WORK , ENERGY & POWER EXERCISE - EXERCISE -II (C.W)75videos
WORK , ENERGY & POWER
- BOOK - NARAYNACHAPTER - WAVESEXERCISE - Exercise-IV56videos
WAVES
- BOOK - NARAYNACHAPTER - WORK POWER AND ENERGYEXERCISE - Level-VI (Integer)12videos
WORK POWER AND ENERGY
Similar Questions
Knowledge Check
- Question 1 - Select One
Which of the following graphs best depicts the changes in one cycle of PCR ?
A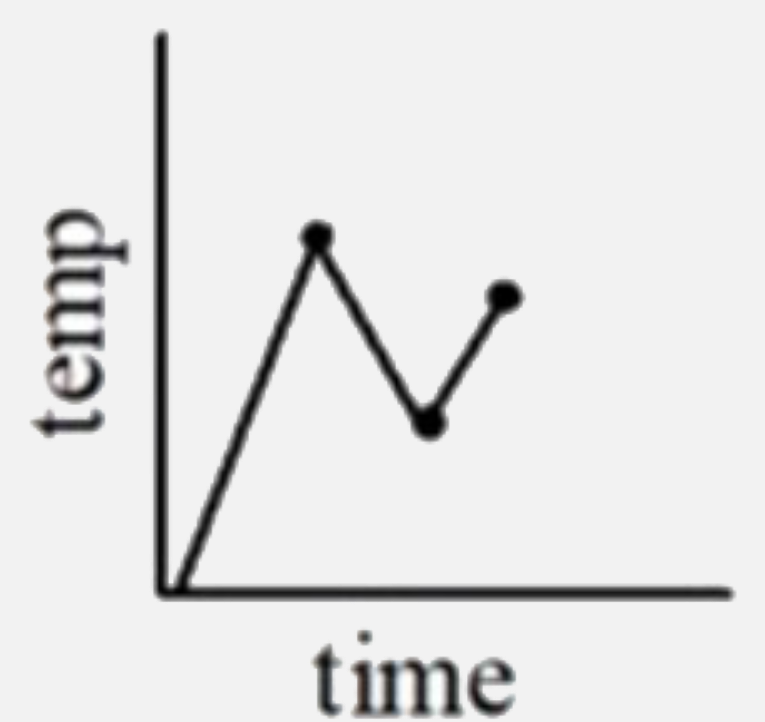 B
B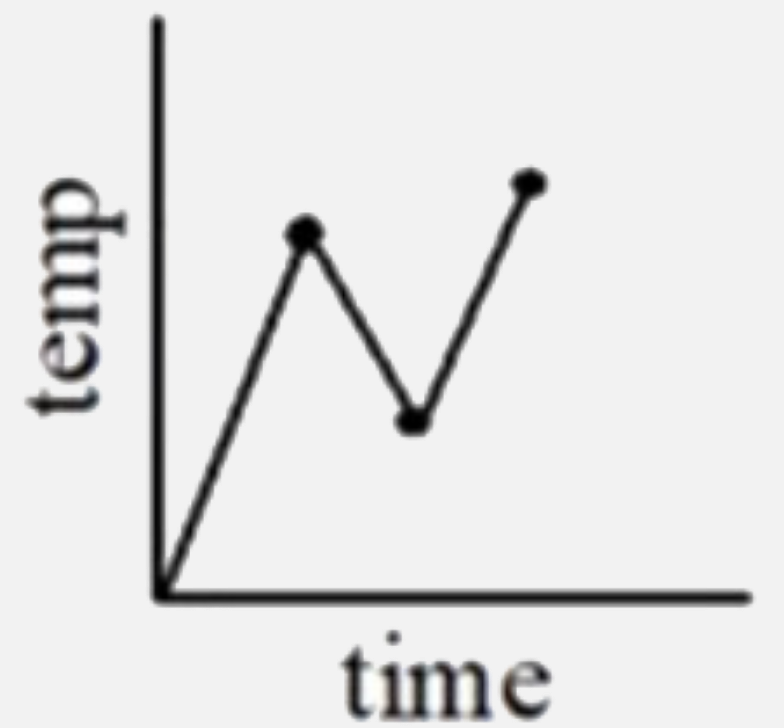 C
C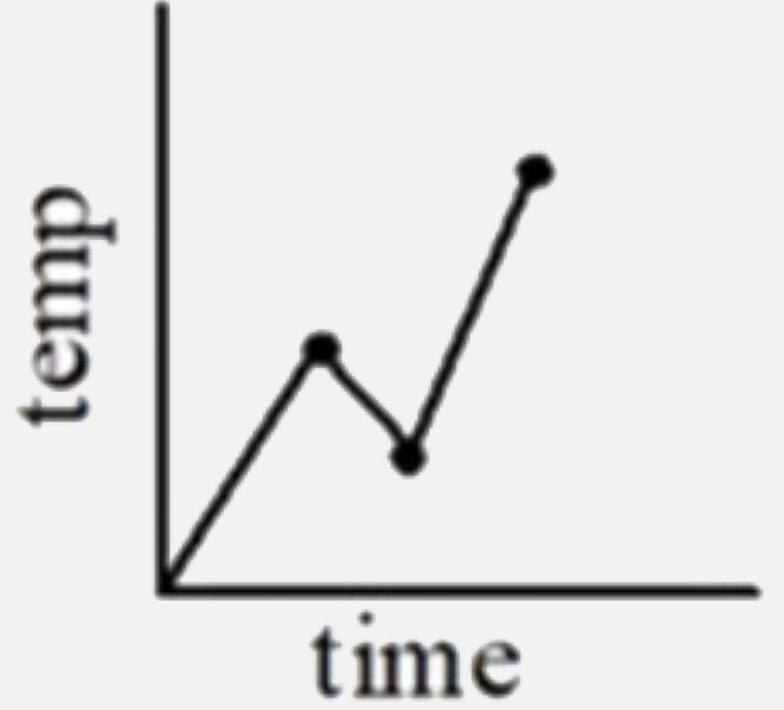 D
D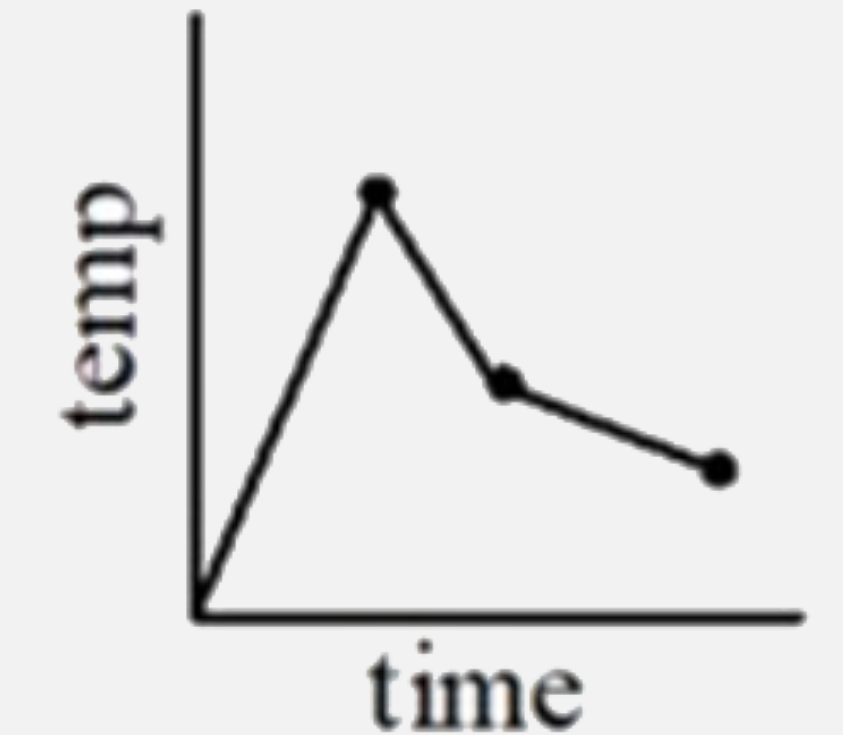
- Question 2 - Select One
which of the following graph represents the variation of resistivity (ρ) with temperature (T) for copper?
A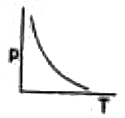 B
B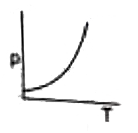 C
C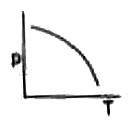 D
D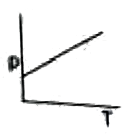
- Question 3 - Select One
A ball is thrown vertically upwards. Which of the following plots represents the speed-time graph of the ball during its height if the air resistance is not ingnored ?
A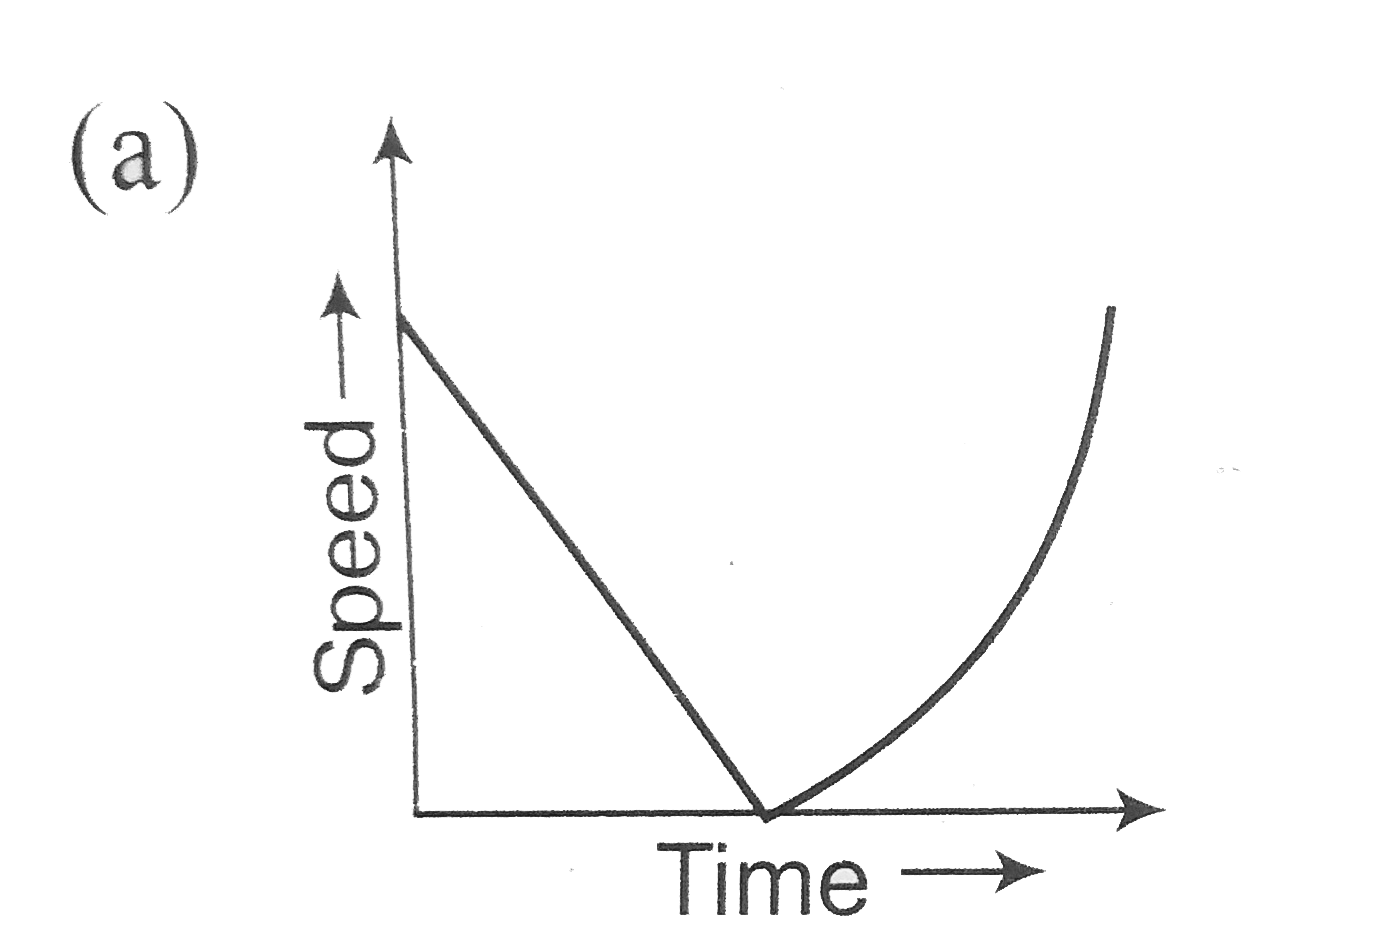 .B
.B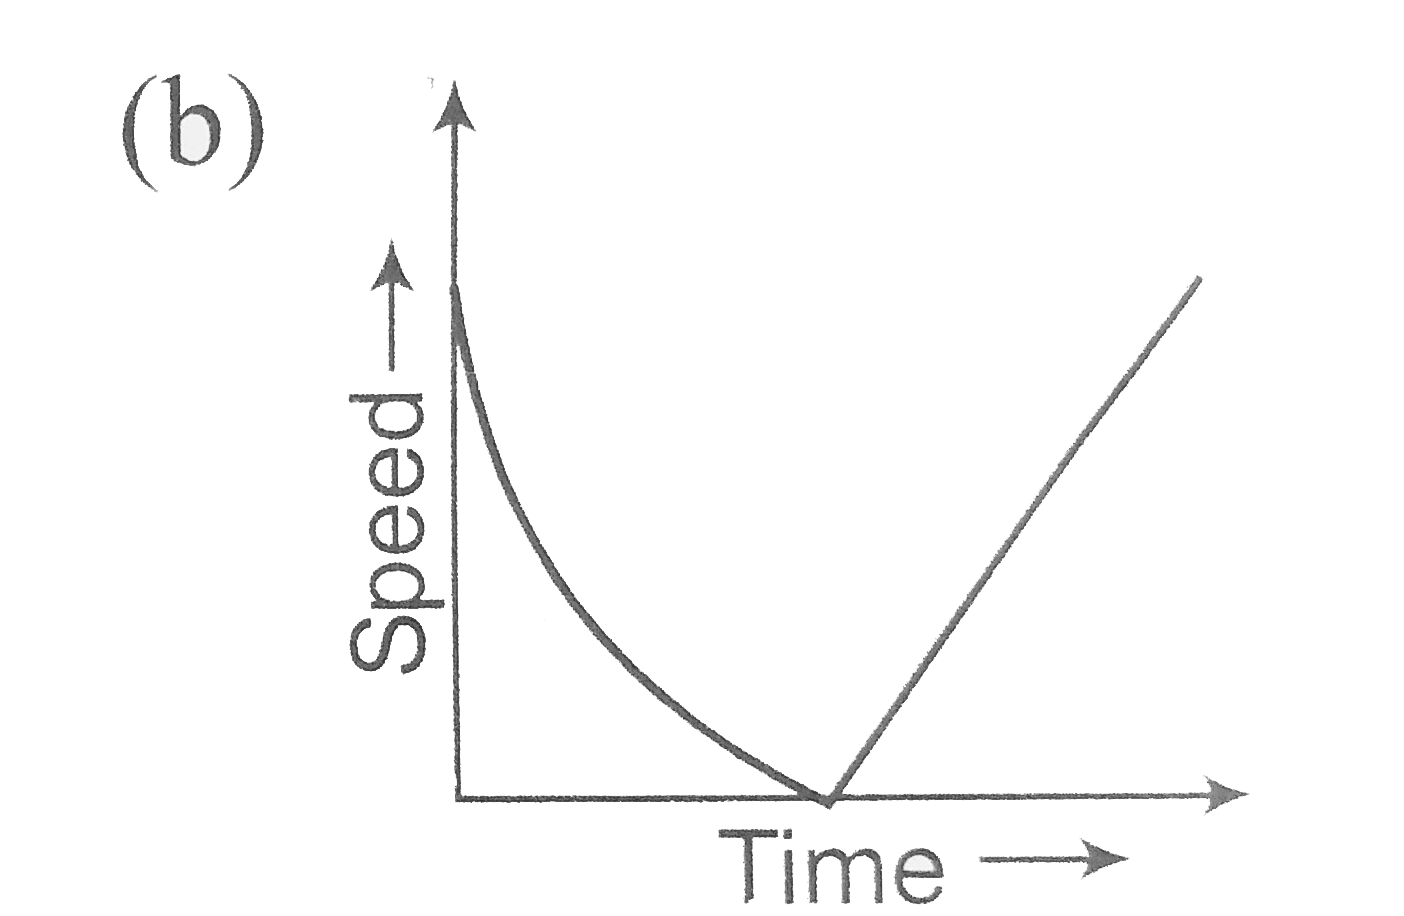 .C
.C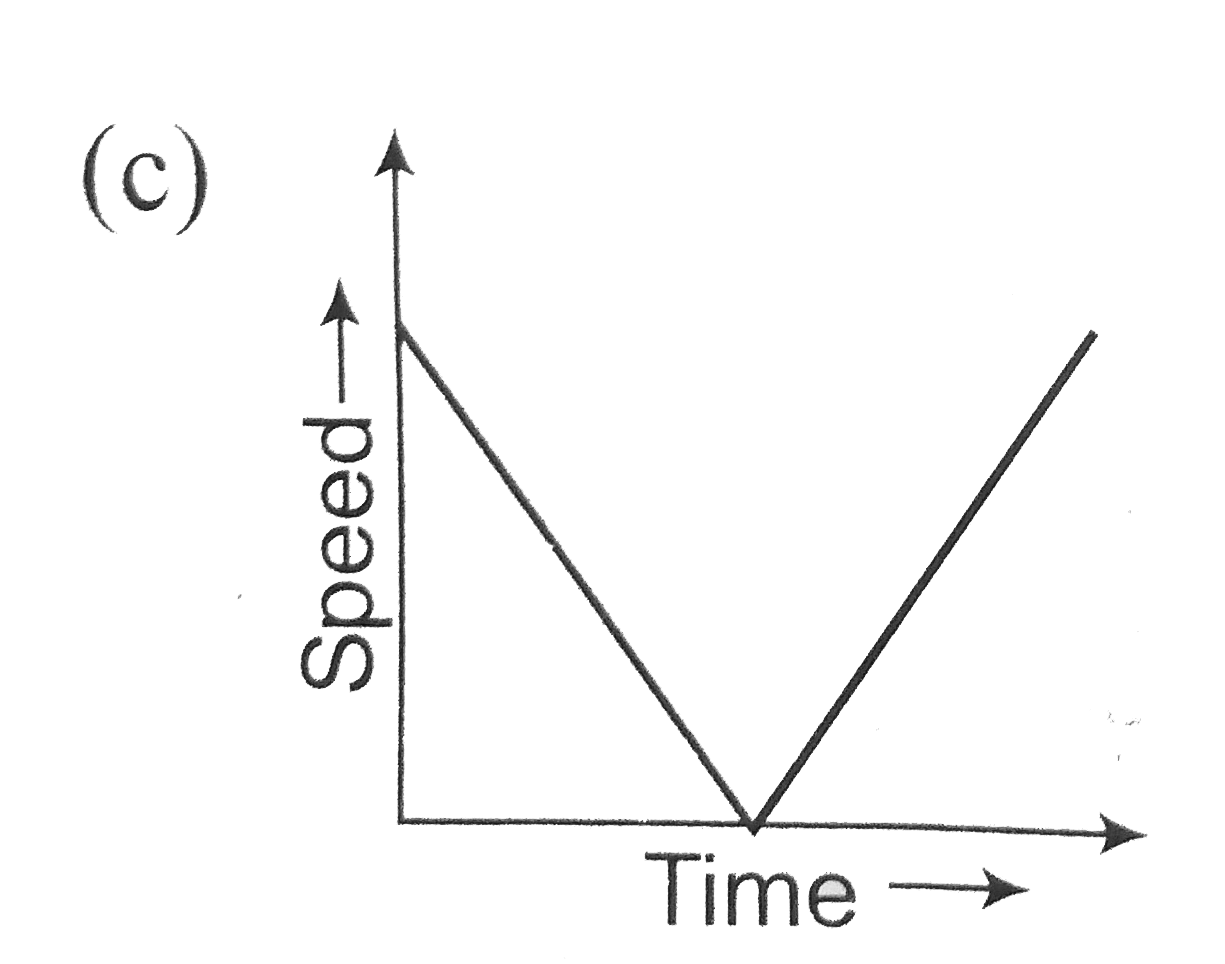 .D
.D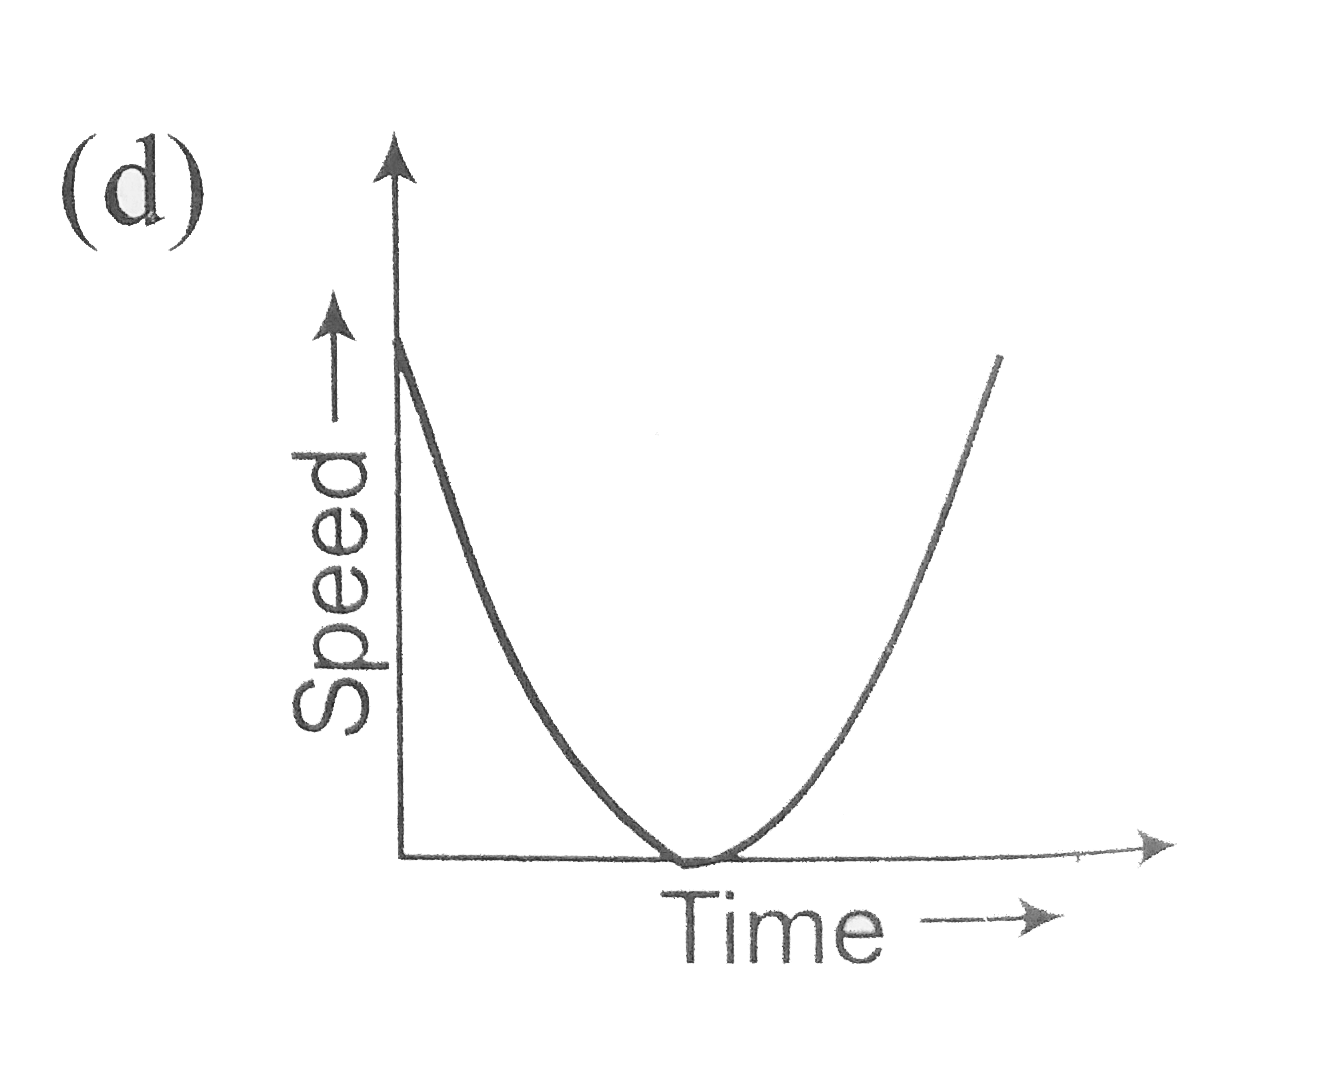 .
.
which of the following graph represents the variation of resistivity (ρ) with temperature (T) for copper?
View SolutionA ball is thrown vertically upwards. Which of the following graph/graphs represent velocity time graph of the ball during its flight ( air resistance is neglected).
View SolutionWhich graph in the following figure best represents the variation of velocity with time of a ball which bounces vertically on a hard surface, from the moment when it rebounds from the surface ?
View SolutionA ball is thrown vertically upwards. Which of the following plots represent the speed graph of the ball during its flight if the air resistence is not ignored?
View SolutionA fielder in a cricket match throws ball from the boundary line to thhe wicket keeper. The ball describes a partabolic path. Which of the following quantities remain constant during the motion in air? (Neglecting air resistance)
View Solution


