The double line graph given below gives the actual and expected sales of cars of a company for six months. Study the graph and answer the questions that follow :

(i) In which month was the actual sale same as the expected sale ?
(ii) For which month was the difference between the actual and expected sales the maximum ?
(iii) For which month was the difference in actual and expected sales the least ?
(iv) What was the total sales of cars in the months of January. February and March ?
(v) What is the average sales of cars in the last 3 months ?
(vi) Find the ratio of sales in the first 3 months to that in the last 3 month?
Step by step video & image solution for The double line graph given below gives the actual and expected sales of cars of a company for six months. Study the graph and answer the questions that follow : (i) In which month was the actual sale same as the expected sale ? (ii) For which month was the difference between the actual and expected sales the maximum ? (iii) For which month was the difference in actual and expected sales the least ? (iv) What was the total sales of cars in the months of January. February and March ? (v) What is the average sales of cars in the last 3 months ? (vi) Find the ratio of sales in the first 3 months to that in the last 3 month? by Maths experts to help you in doubts & scoring excellent marks in Class 8 exams.
Topper's Solved these Questions
- BOOK - RS AGGARWALCHAPTER - LINE GRAPHS AND LINEAR GRAPHSEXERCISE - Exercise 2325videos
LINE GRAPHS AND LINEAR GRAPHS
- BOOK - RS AGGARWALCHAPTER - INTRODUCTION TO COORDINATE GEOMETRYEXERCISE - EXERCISE B (OBJECTIVE QUESTIONS)7videos
INTRODUCTION TO COORDINATE GEOMETRY
- BOOK - RS AGGARWALCHAPTER - LINEAR EQUATIONSEXERCISE - TEST PAPER-8 (D) (Write .T. for true and .F. for false for each of the following:)1videos
LINEAR EQUATIONS
Similar Questions
The graph given below gives the actual and expected sales of cars of a company for 6 months. Study the graph and answer the questions that follow.
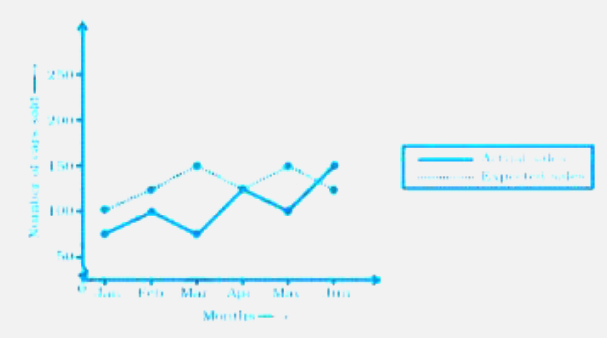
(a) In which month was the actual sales same as the expected sales?
(b) For which month(s) was (were) the difference in actual and expected sales the maximum?
(c) For which month(s) was (were) the difference in actual and expected sales the least?
(d) What was the total sales of cars in the months–Jan, Feb. and March?
(e) What is the average sales of cars in the last three months?
(f) Find the ratio of sales in the first three months to the last three months.View SolutionStudy the graph and answer the questions.
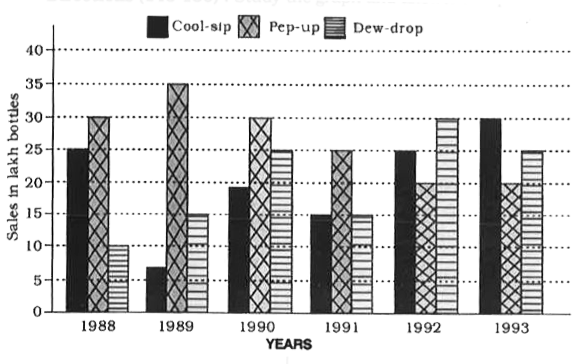
In which year the sale of coolsip is minimum?View Solution
Knowledge Check
- Question 1 - Select One
Study the graph and answer the questions.
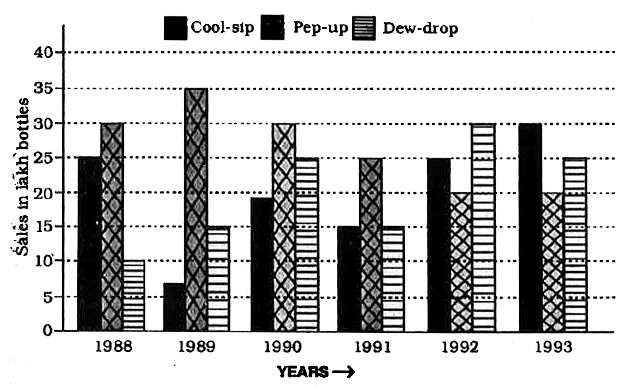
In which year the sale of cool-sip is minimum ?A1990B1992C1993DNone of the above - Question 2 - Select One
Study the graph and answer the questions.
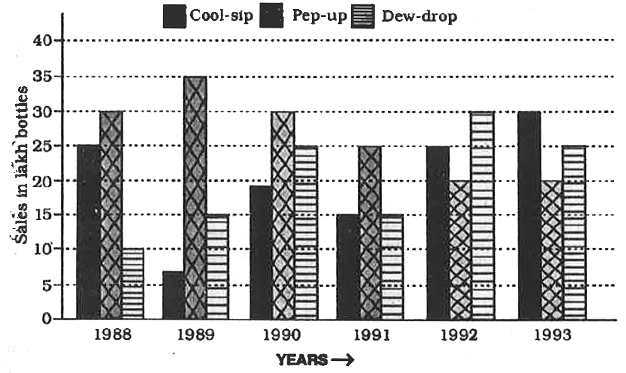
In which year sale of Drew-drop is maximum ?A1998B1992C1989D1993 - Question 3 - Select One
Study the graph and answer the questions.
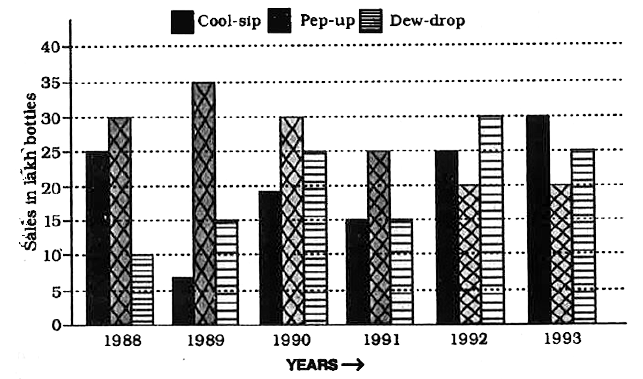
In case of which soft drink was the average annual sale maximum during the period 1988-1993 ?APep-up onlyBPep-up and Dew dropCCool-sip onlyDCool-sip and Pep-up
Study the graph and answer the questions.
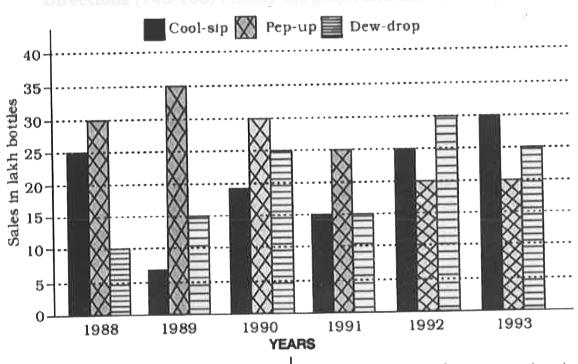
In which year sale of Dew -drop is maximum ?View SolutionStudy the graph and answer the questions.
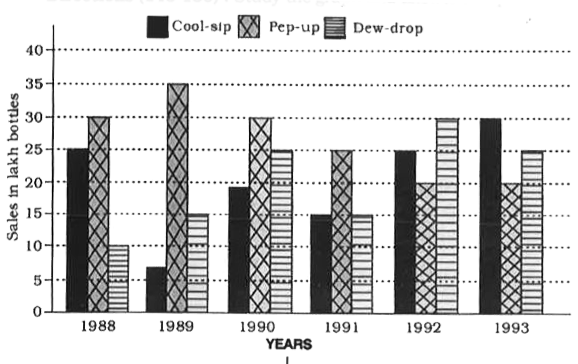
In case of which soft drink was the average annual sale maximum during the period 1988 - 1993 ?View SolutionThe following graph shows the sales of cars (in thousands) in four cities in 4 years. Study the graph and answer the question.
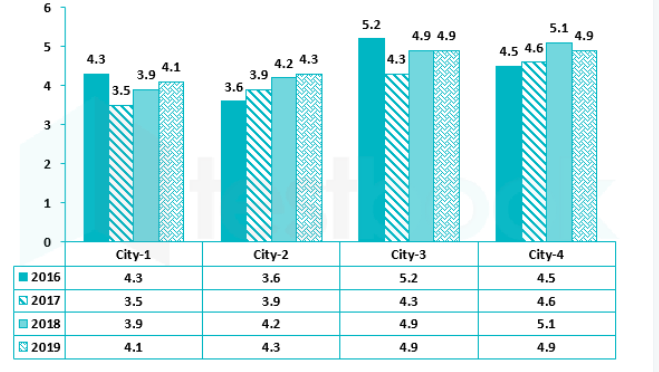
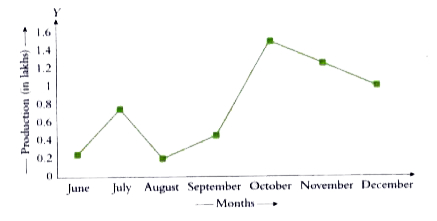
Which city has the highest sales?View SolutionThe line graph given below shows the production of a particular model of bike produced in different months. Read the line graph and answer the following questions:
In which month is the production least?
 View Solution
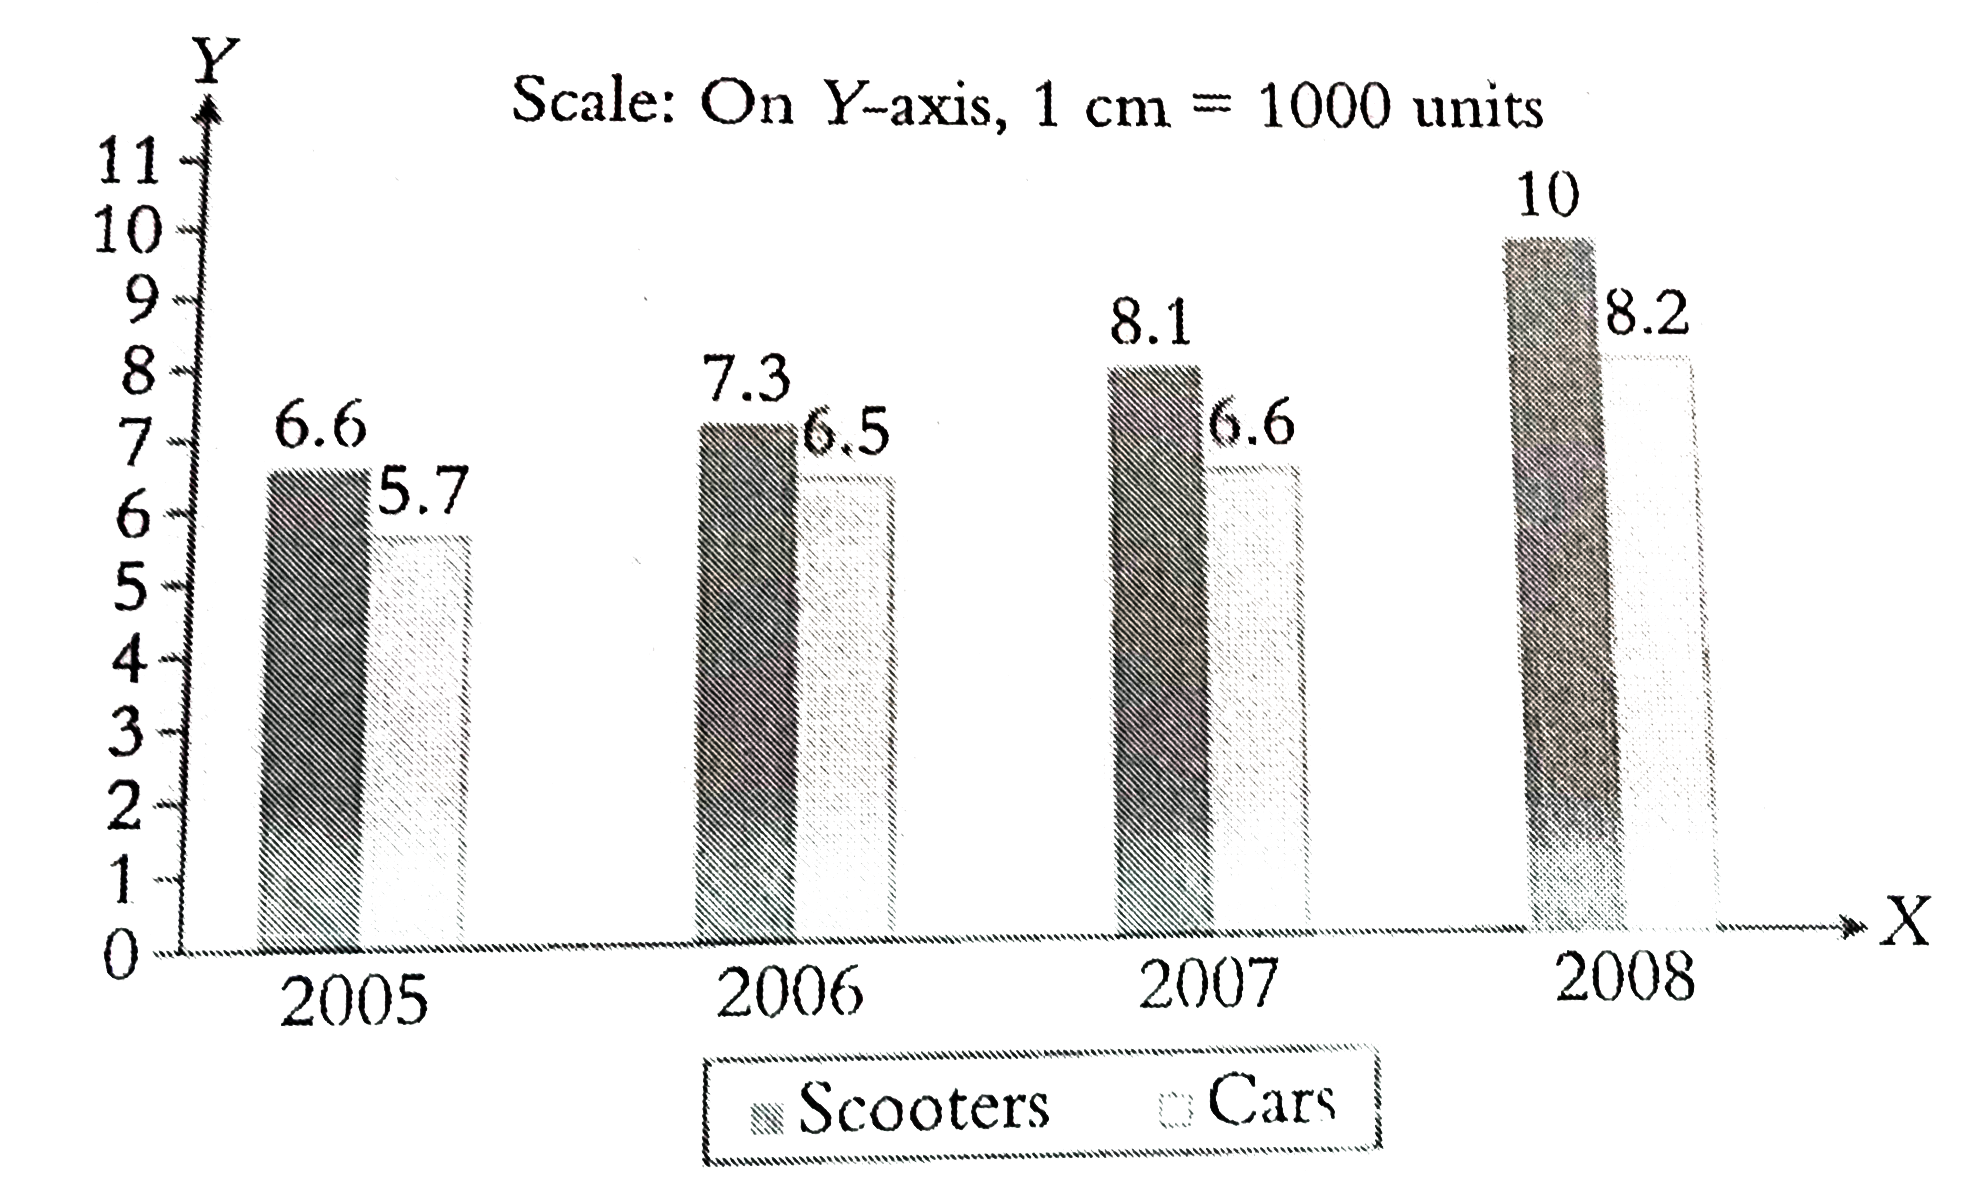
In which year is the difference between the sales of the scooters and the sales of cars the least ?View Solution

