Draw the graph of Solution in Tamil
The domain of the function is R as has no real roots.
1. y-intercept
So the graph cuts the y-axis at (0,1).
2. x-intercept (zeros)
Put or .
This equation has no real roots.
Hence the graph does not intersect the x-axis.
3. Asymptotes
Vertical asymptotes
Since had no real roots, the graph has no vertical asymptote.
Horizontal asymptotes
Since the degree of the numerator and that of the denominator are same, the horizontal asymptote is
or or
Clearly, the graph has no ablique asymptote.
4. Extremum
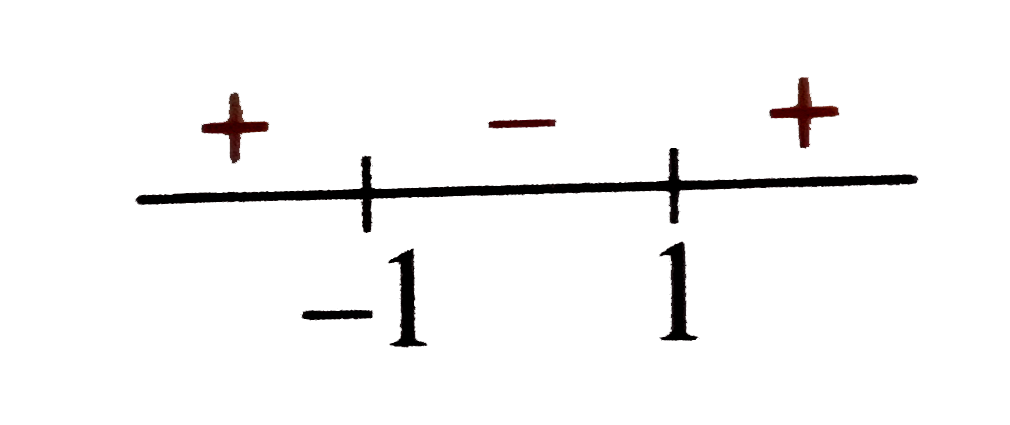
Sign scheme of is as follows.

From the sign scheme, x = 1 is the point of minima and x = -1 is the point of maxima.
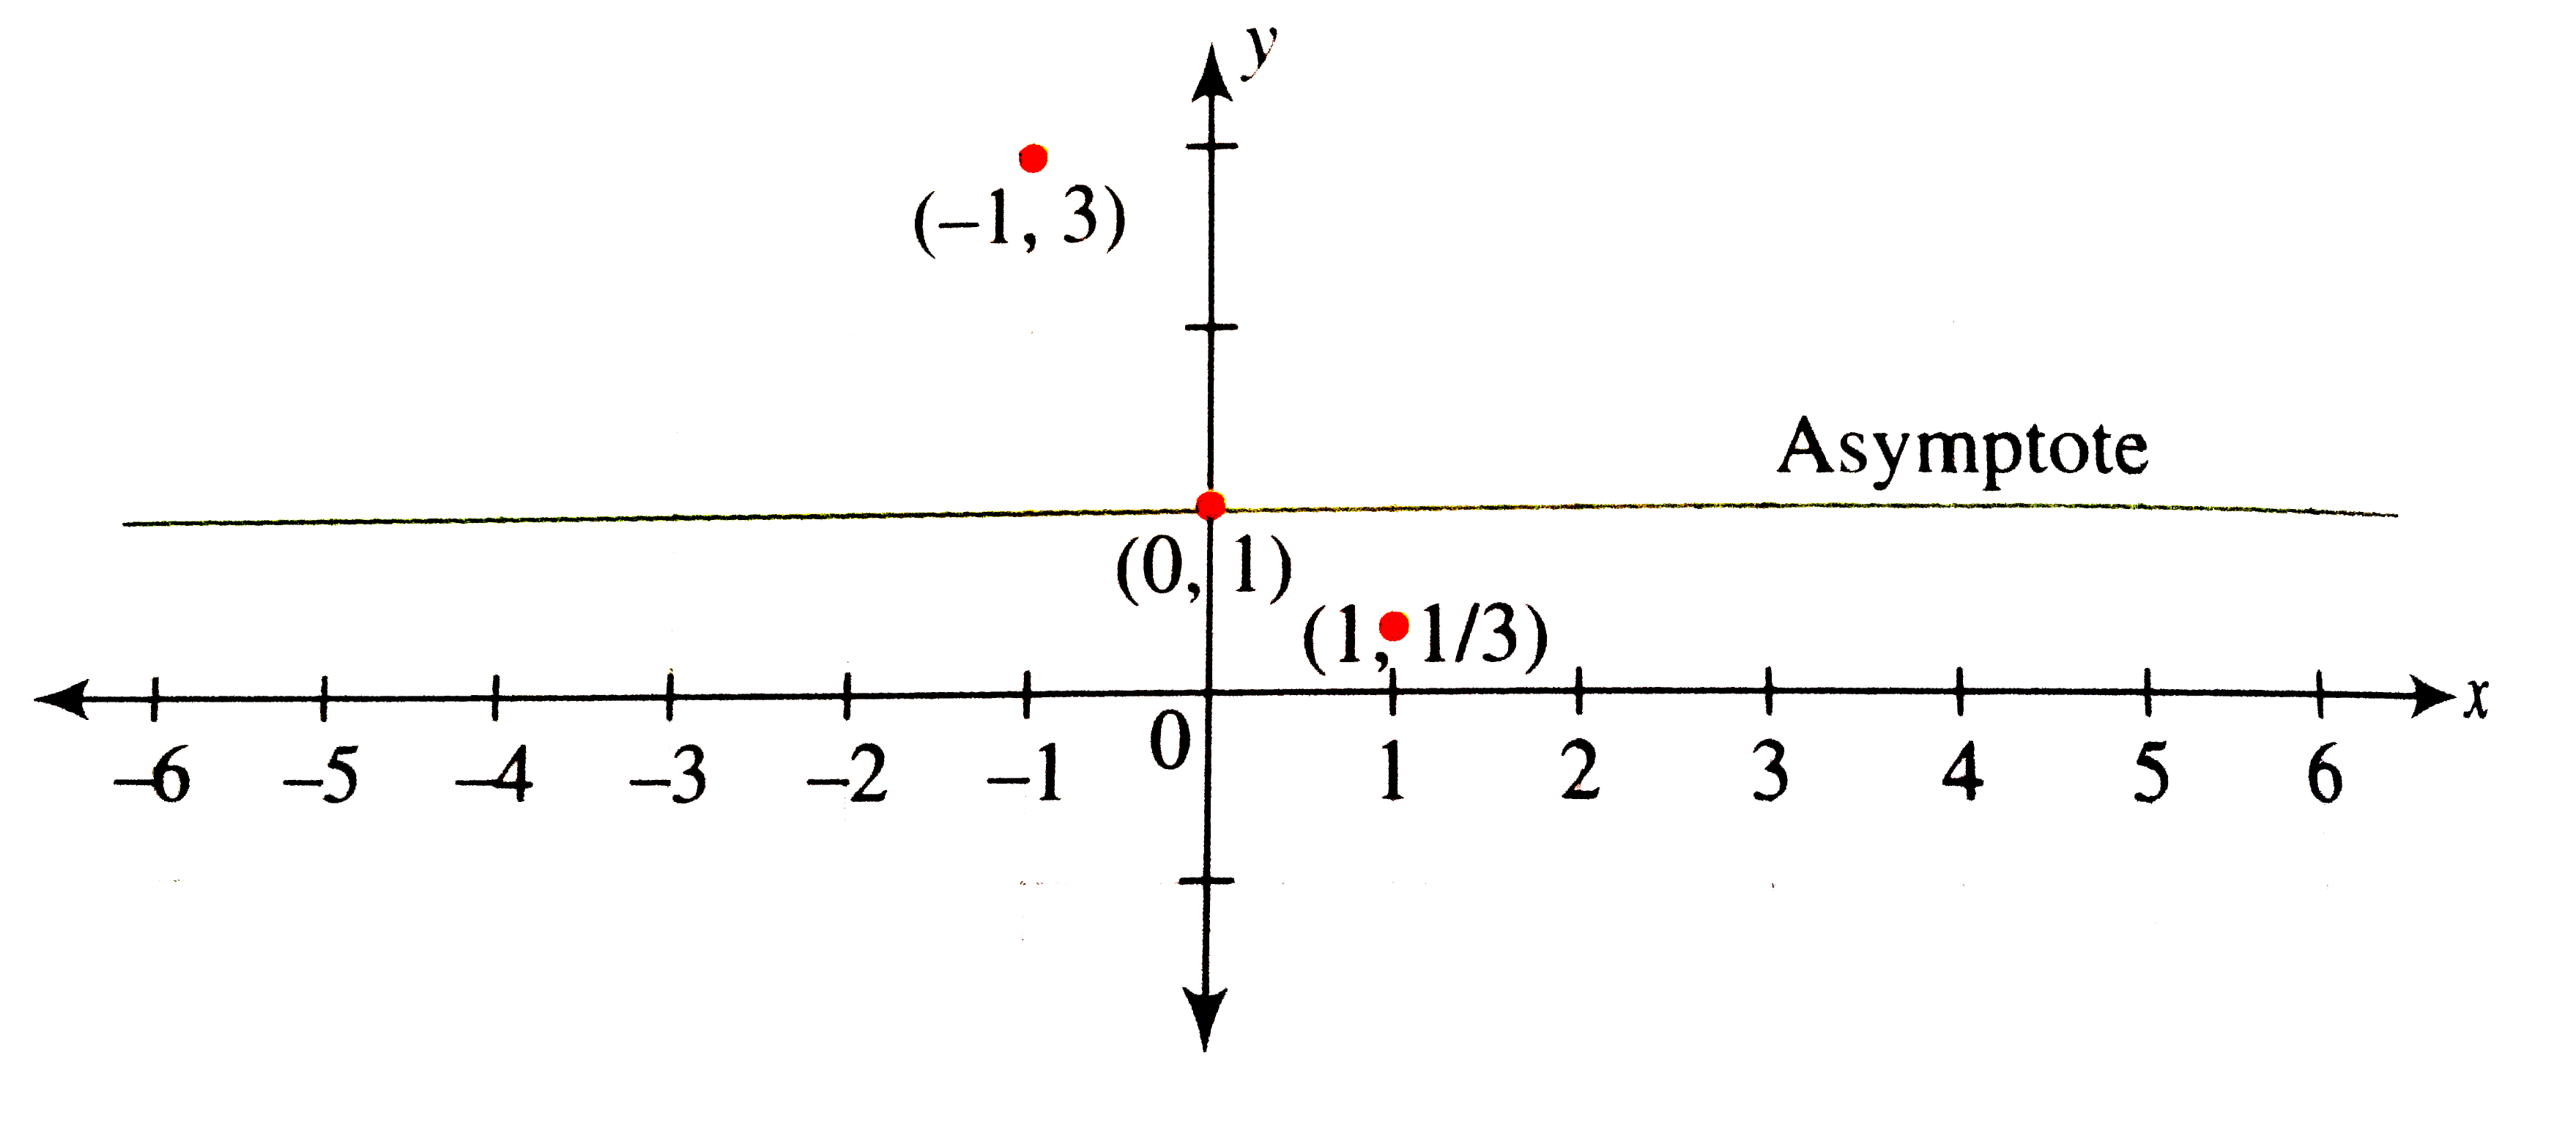
Also and .
From the above discussion, we have the following reference points and lines.

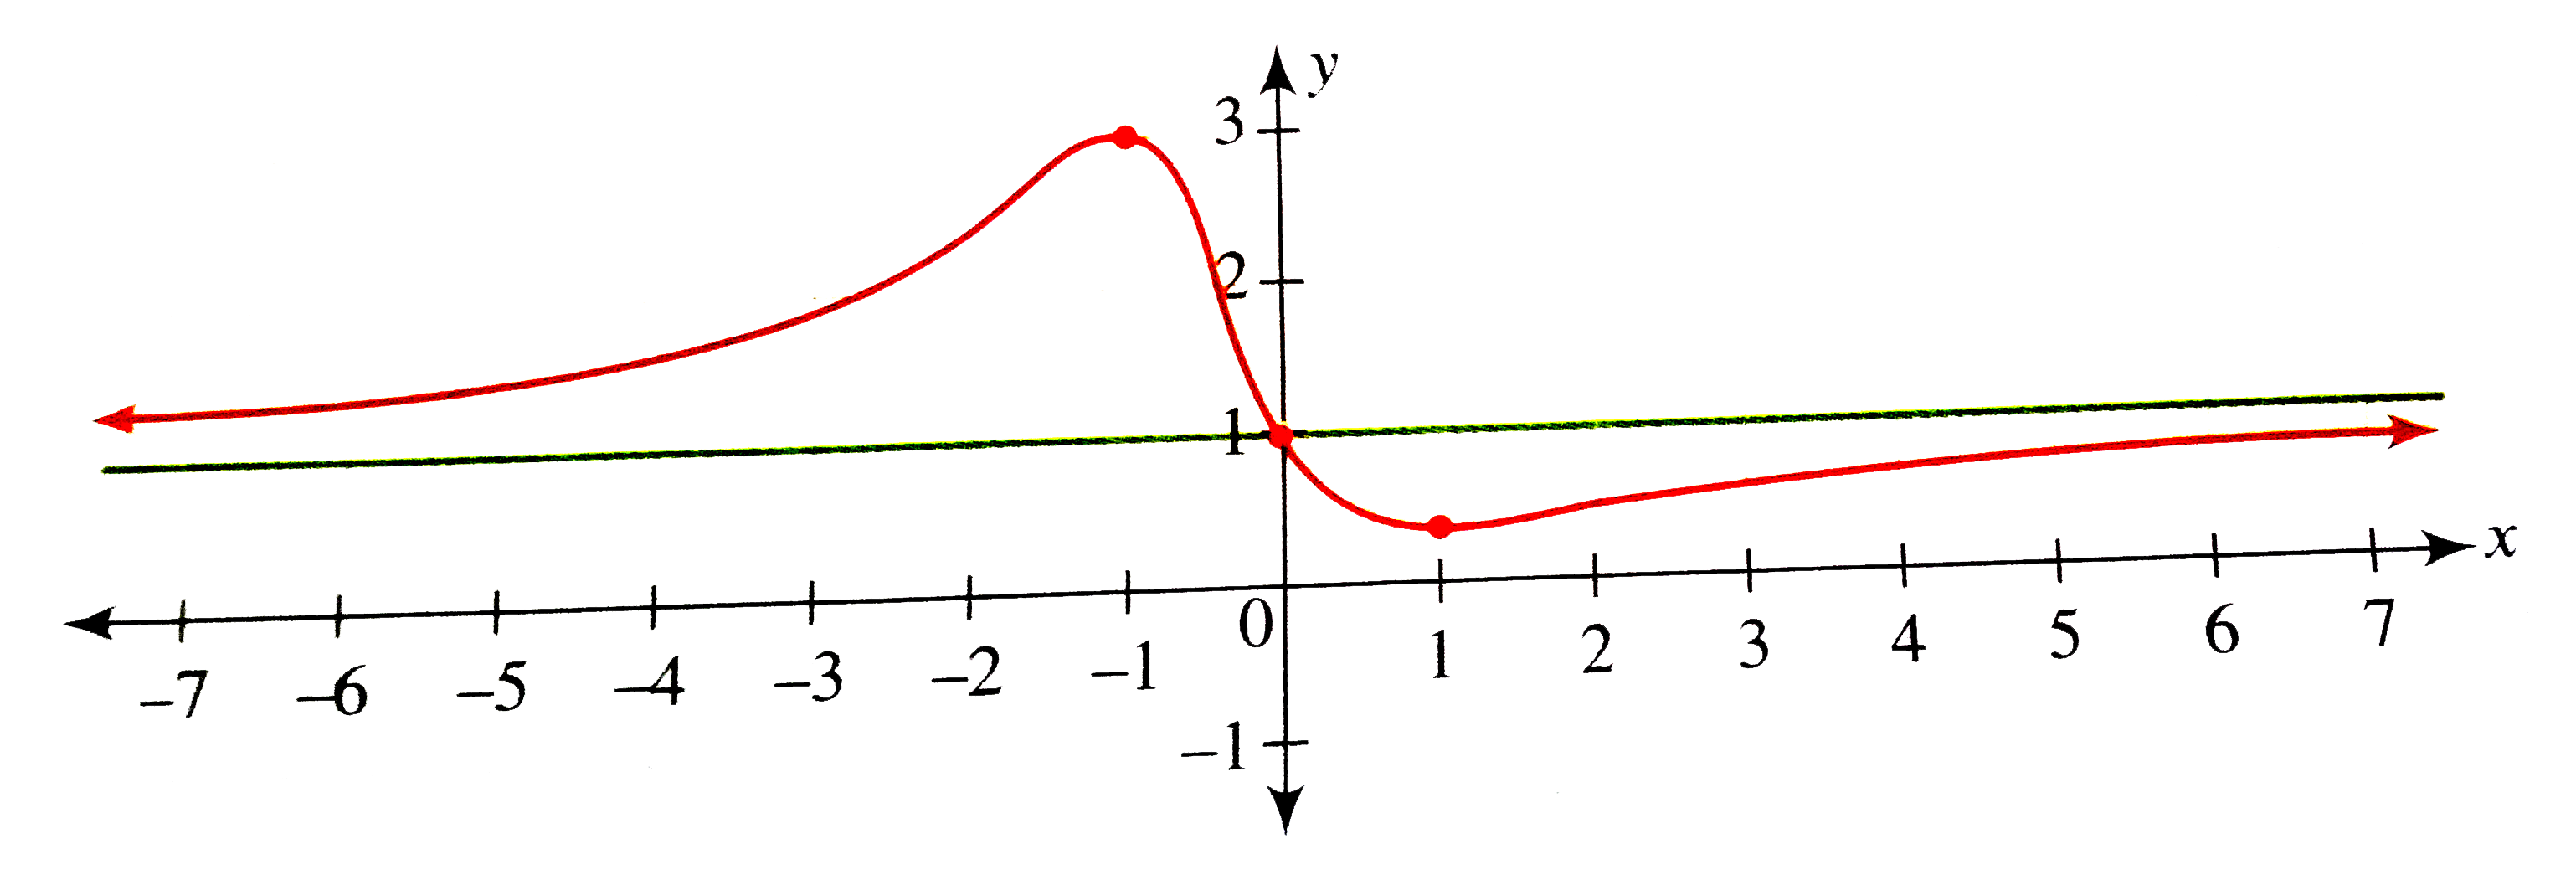
When and in increases from '1' to '3'.
At attains the maximum value '3'.
In decreases from '3' to '1/3' intersecting the y-axis at (0, 1) and attains minima at x = 1.
In increases from '1/3' to '1' and finally approaches to asymptote y = 1 when .
Thus , the graph of is as shown in the following figure.

Topper's Solved these Questions
- BOOK - CENGAGECHAPTER - GRAPHS OF POLYNOMIAL AND RATIONAL FUNCTIONSEXERCISE - Exercise13videos
GRAPHS OF POLYNOMIAL AND RATIONAL FUNCTIONS
- BOOK - CENGAGECHAPTER - GRAPHS OF POLYNOMIAL AND RATIONAL FUNCTIONSEXERCISE - Exercises4videos
GRAPHS OF POLYNOMIAL AND RATIONAL FUNCTIONS
- BOOK - CENGAGECHAPTER - GRAPHICAL TRANSFORMATIONSEXERCISE - Exercise14videos
GRAPHICAL TRANSFORMATIONS
- BOOK - CENGAGECHAPTER - GRAPHS OF ELEMENTARY FUNCTIONS EXERCISE - Exercise34videos
GRAPHS OF ELEMENTARY FUNCTIONS
Similar Questions
Draw the graph of y=(x−1)(x2−x+1).
05:51View SolutionSketch the graph of an example of a rational function f that satisfies all the given conditions.
(i) f(0)=0,f(1),limx→∞f(x)=0,f is odd
(ii) limx→0+f(x)=∞,limx→0−f(x)=−∞,limx→∞f(x)=1,limx→−∞f(x)=1
(iii) limx→−2f(x)=∞,limx→−∞f(x)=3,limx→∞f(x)=3,f(0)=005:29View SolutionDraw the graph of y=tan−1x−cot−1x.
05:05View SolutionDraw the graph of y=1(1/x).
03:05View SolutionDraw the graph of f(x)=∣∣∣x2−2x2−1∣∣∣ .
06:46View SolutionDraw the graph of f(x)=x2−5x+6x2−x
05:44View SolutionDraw the graph of f(x)=5x2(x−1)3.
View Solutiony=f(x)=x2−6x+9 का आलेख खींचे |
05:04View SolutionDraw the graph of y=x2−5x+6 and hence solve x2−5x−14=0.
05:55View SolutionDraw the graph for the polynomial p(x)=x2−5x+6 and find the zeroes from the graph.
06:19View Solution(a) Draw the graph of y=x2 and hence solve x2−4x−5=0.
(b) Draw the graph of y=x2−5x−6 and hence solve x2−5x−14=008:51View SolutionDraw the graph of function f'(x) if f(x)=2x2−5x+3
03:09View SolutionDraw the graph of f(x)=∣∣∣x2−2x2−1∣∣∣ .
01:59View SolutionDraw the graph of f(x)=x2−5x+6x2−x
05:03View SolutionDraw the graph of f(x)=∣∣∣x2−2x2−1∣∣∣ .
07:26View SolutionDraw the graph of f(x)=5x2(x−1)3.
02:51View Solution

