Draw the graph of y=|x|.Solution in Tamil
Video Solution
Text Solution
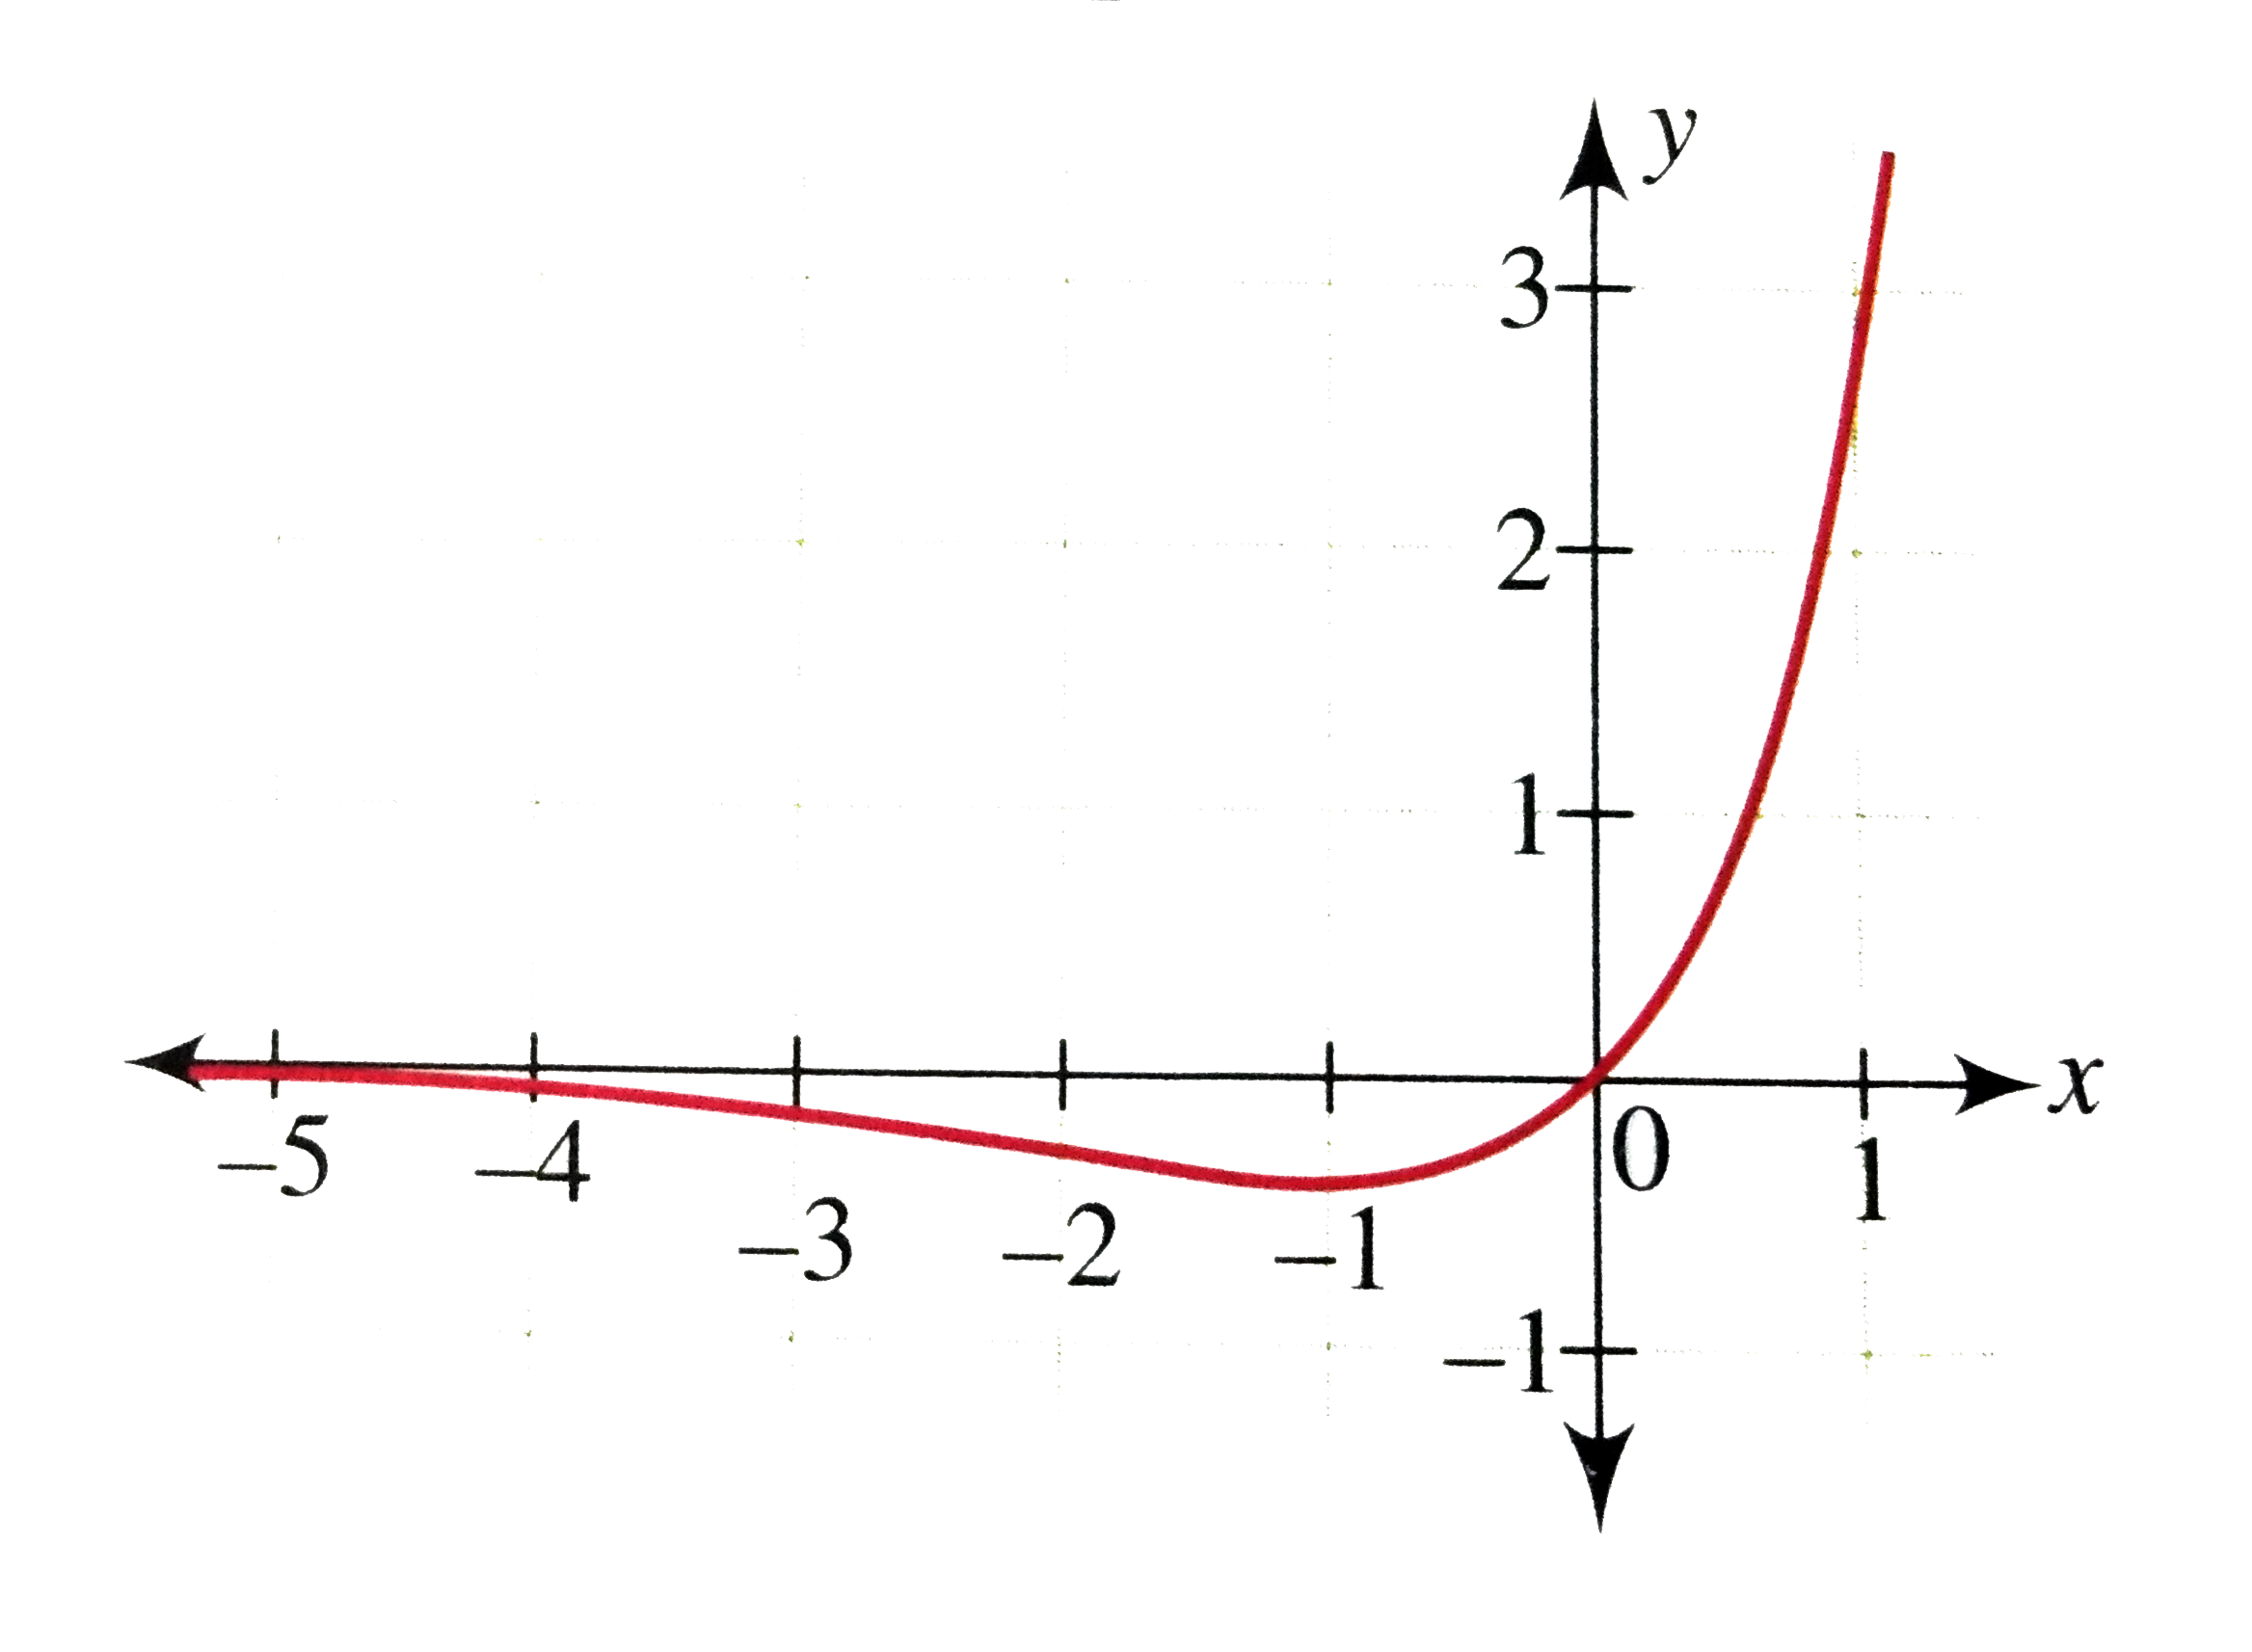
We have y=f(x)=xex
Clearly, the domain of the function is R.
f(0)=−0
and f(x)=0 when x=0
f′(x)=ex+xex=ex(1+x)
f′(x)>0 for x<−1, where f(x) increases
f′(x)<0 for x<−1, where f(x) decreases
f′(x)=0∴x=−1
Also at x=−1,dydx, Changes sign from negative to positive, hence x=−1 is the point of minima,
f(−1)=−e−1=−1/e
When x→∞,f(x)→∞
Also limx→−∞xex=xx→−∞e−x=1x→−∞−e−x=0
So x-axis is an asymptote.
Thus, in (−∞,−1),f(x) decreases from 0+→−1/e
In (1,∞),f(x) increases, intersecting the x-axis at x=0
f''(x)=ex(2+x)
f''(x)=0∴x=−2
So x=−2 is the point of inflection.
From the above discussion, the graph of the function is as follows:

Range of the function is [f(−1),∞) or [−e−1,∞).
|
Updated on:21/07/2023
Topper's Solved these Questions
Similar Questions
Draw the graph of y=sin2x−cosx
04:20View SolutionLet →a and →b be two vectors of equal magnitude 5 units. Let →p,→q be vectors such that →p=→a−→b and →q=→a+→b. If |→p×→q|=2{λ−(→a.→b)2}12, then value of λ is
01:33View SolutionSolve: (x+2)3=2x(x2−1)
View SolutionDraw the graph of y=|x|
04:14View SolutionDraw the graph of y=2−x.
03:41View SolutionDraw the graph of y=|||x|−2|−3| by transforming the graph of y=|x|
04:18View Solutionx+y=7 का आलेख खींचिए |
View Solutiony=|x| का आलेख खींचे
02:19View Solutionx + y = 7 का आलेख खींचिए ?
02:19View Solutionx + y = 7 का आलेख खीचिए।
09:21View SolutionDraw the graph of x+y=7.
02:45View SolutionDraw the graph of y=sin|x|.
03:30View SolutionDraw the graph of y=|||x|−2|−3| by transforming the graph of y=|x|
04:26View SolutionDraw the graph of y=|x|
04:15View SolutionDraw the graph of y=|x|+2
05:57View SolutionDraw the graph of x+y=1.
01:39View Solution

