Study the pie-chart and answer the question
In an institure. there are 900 students who use diferent modes of transport for to and from travel. The given pie diagram epieseuis the iequisite data.
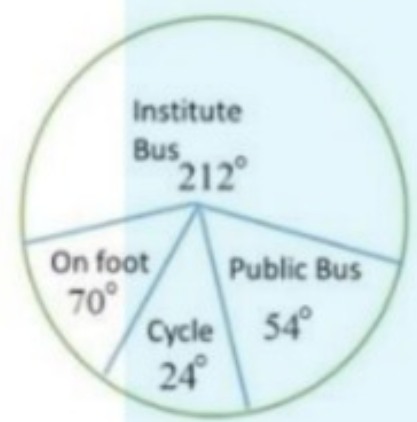
The number of students who travel on foot is:
175
150
225
180
The correct Answer is:A
Step by step video & image solution for Study the pie-chart and answer the question In an institure. there are 900 students who use diferent modes of transport for to and from travel. The given pie diagram epieseuis the iequisite data. The number of students who travel on foot is: by Maths experts to help you in doubts & scoring excellent marks in Class 14 exams.
Similar Questions
Study the pie-chart and answer the question.
In an institute. there are 900 students who use diferent modes of transport for to and from travel. The given pie diagram represent's the requisite data.
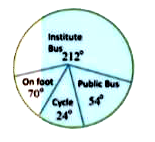
The nunber of students who do NOT use the institute bus isView SolutionStudy the pie-chart and answer the questions. In an institute, there are 900 students who use different modes of transport for to and from travel. The given pie diagram represents the requisite data.
पाई-चार्ट का अध्ययन करें और प्रश्नों के उत्तर दें। एक संस्थान में, 900 छात्र हैं जो आने-जाने के लिए परिवहन के विभिन्न साधनों का उपयोग करते हैं। दिए गए पाई चार्ट में संबंधित आंकड़े दिए गए हैं।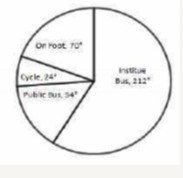 The number of students who travel on foot is:
पैदल यात्रा करने वाले छात्रों की संख्या है:View Solution
Knowledge Check
- Question 1 - Select One
Study the Pie chart carefully and answer the questions.
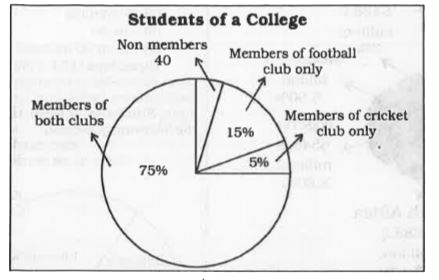
Percentage of students who are not members of any club is :A5%B8%C10%D6% - Question 2 - Select One
Study the Pie chart carefully and answer the questions.
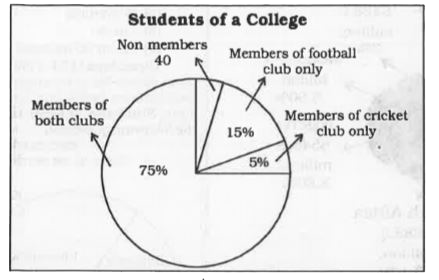
The number of students who are members of both the club is :A500B650C550D600 - Question 3 - Select One
Study the Pie chart carefully and answer the questions.
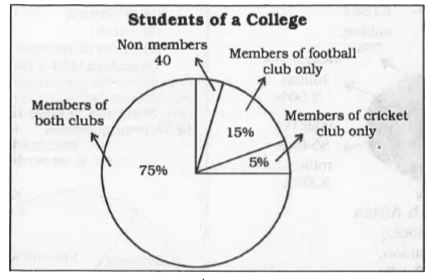
Number of students who are members of cricket club only :A35B40C42D41
In an Institution there are 800 students. Students use different modes of transport for going to the intitution and return. The given pie diagram represents the requisite data. Study the diagram carefully and answer the questions.
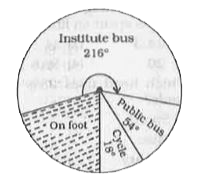
The number of students who travel in public bus isView SolutionIn an Institution there are 800 students. Students use different modes of transport for going to the intitution and return. The given pie diagram represents the requisite data. Study the diagram carefully and answer the questions.
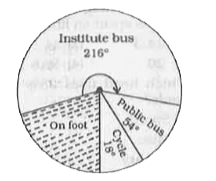
The number of students who go to institute on foot isView SolutionIn an Institution there are 800 students. Students use different modes of transport for going to the intitution and return. The given pie diagram represents the requisite data. Study the diagram carefully and answer the questions.
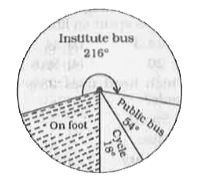
The number of students who do not use institute bus isView SolutionStudy the following pie-chart and answer the questions given below :
Preferences of stuents among six beverages in terms of degre of angle in the pie-chart Total no. of students = 6800
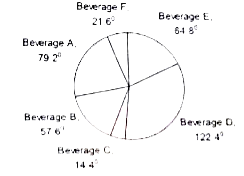
The number of students who prefer Beverage C are approximately what percent of the number of students who prefer Beverage D ?View SolutionThe histogram shows the number of students using different modes of transport to commute from residence to school.
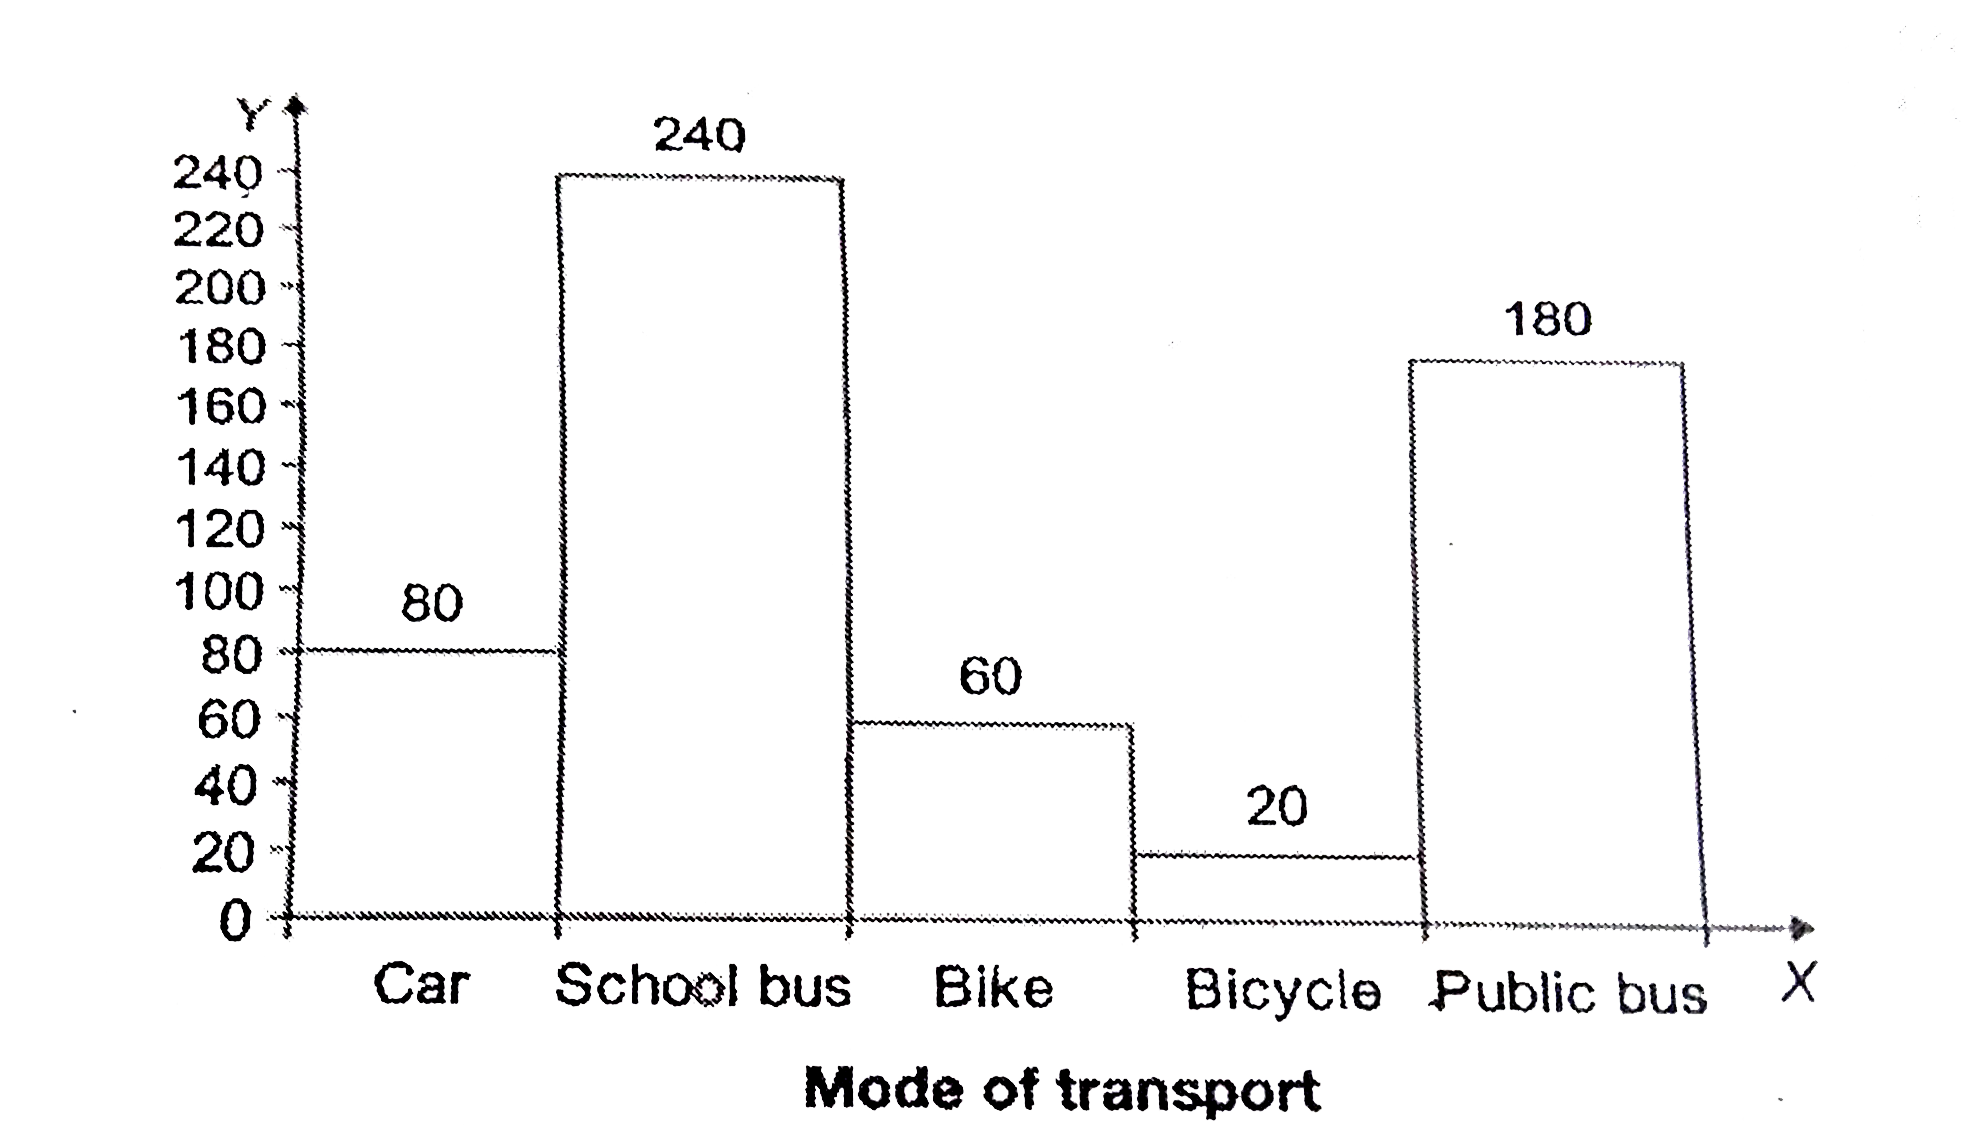
From the bar graph, answer the following question :
What is the total number of pupils who travel by school bus and bike ?View Solution
