The following pie-chart and table show the percentage distribution of farmers in 5 states A, B, C, D & E of a country who claimed insurance due to drought in the year 2017 and ratio of males to females of the number of farmers in states, respectively. Study the pie-chart and the table carefully and answer the following questions.
Note: Some data are missing in the pie-chart and table, if required in any question, find the missing data first and then answer the question.
Total number of farmers who claimed insurance in the year 2017 = 2,64,000
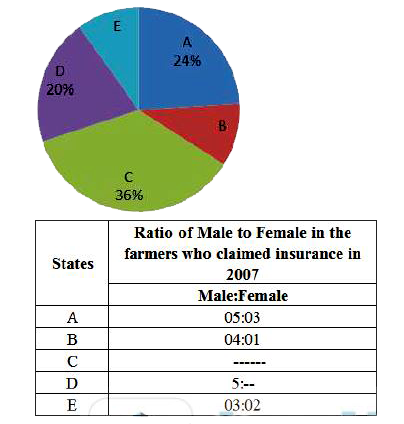
The number of farmers who claimed insurance in state C exceeds the total number of farmers (who claimed insurance)in state E and state A together by 5280. What is the percentage of farmers who claimed insurance in state E?
0.15
0.25
0.1
0.4
The correct Answer is:C
Step by step video, text & image solution for The following pie-chart and table show the percentage distribution of farmers in 5 states A, B, C, D & E of a country who claimed insurance due to drought in the year 2017 and ratio of males to females of the number of farmers in states, respectively. Study the pie-chart and the table carefully and answer the following questions. Note: Some data are missing in the pie-chart and table, if required in any question, find the missing data first and then answer the question. Total number of farmers who claimed insurance in the year 2017 = 2,64,000 <Br> The number of farmers who claimed insurance in state C exceeds the total number of farmers (who claimed insurance)in state E and state A together by 5280. What is the percentage of farmers who claimed insurance in state E? by Maths experts to help you in doubts & scoring excellent marks in Class 14 exams.
Similar Questions
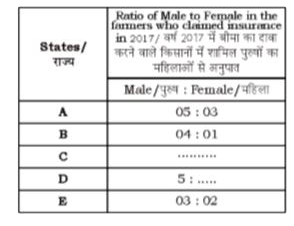
The following pie chart and table show the percentage distribution of farmers in 5 states A B C D E of a country who claimed insurance due to drought in the year 2017 and ratio of males to females to farmers in states, respectively
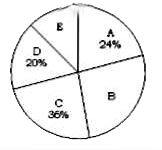
The number of farmers who claimed insurance C exceeds the total number of farmers in state E and state A together by 5280 What is the percentage of farmers who claimed insurance in state.
 View Solution
Study the given pie-chart and table carefully and answer the question that follows. The percentage-wise distribution of lecturers in five different subjects in a university is shown in the pie-chart. The total number of lecturers is 500.
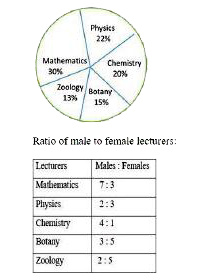
Find the number of male lecturers in Physics.View Solution
Knowledge Check
- Question 1 - Select One
Study the Pie chart carefully and answer the questions.
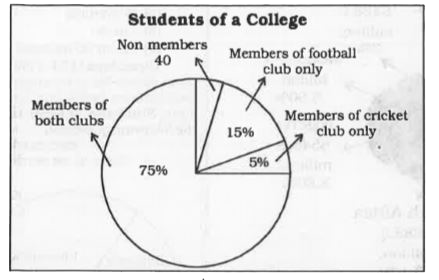
The number of students who are members of both the club is :A500B650C550D600 - Question 2 - Select One
Study the Pie chart carefully and answer the questions.
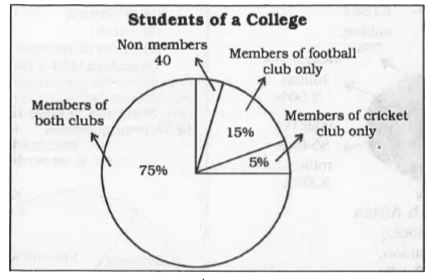
Number of students who are members of cricket club only :A35B40C42D41 - Question 3 - Select One
Study the Pie chart carefully and answer the questions.
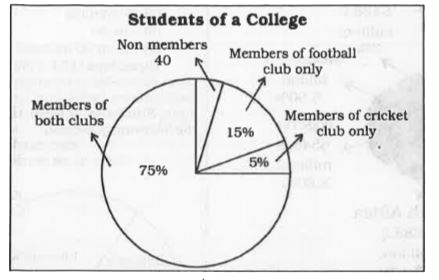
Percentage of students who are not members of any club is :A5%B8%C10%D6%
The given pie chart shows the percentage distribution of 450 employees in an organisation. Study the pie chart and answer the question that follows
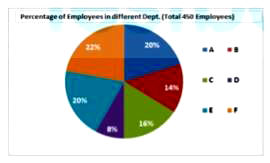
What is the central angle of the sector representing the number of employees in department A ?View SolutionStudy the Pie chart carefully and answer the questions.
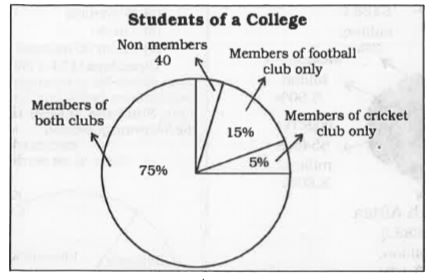
Ratio of members of cricket club only and football club only respectively is :View SolutionThe pie-chart shows percentage wise distribution of teachers who teach six different subjects. Study the pie chart and answer the question :
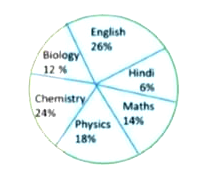
Total number of teachers =1650
What is the difference between the total number of teachers who teach Physics and Maths and the total number of teachers who tech chemistry and biology ?View SolutionThe following pie-chart shows the percentage distribution of the expenditure incurred in publishing a book. Study the pie-chart and answer the questions based on it.
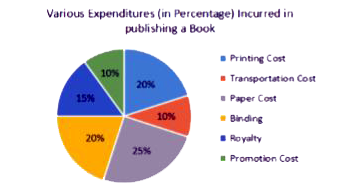
Royalty on the book is less than the paper cost by :View SolutionThe following questions arfe based on the pie-chart given below. Study the pie-chart and answer the questions.
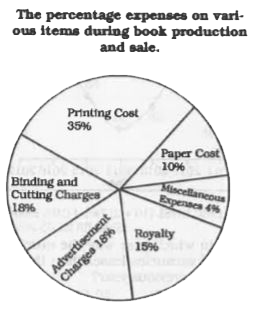
If the 'Printing-Cost' is Rs 17500, the royality paid isView Solution

