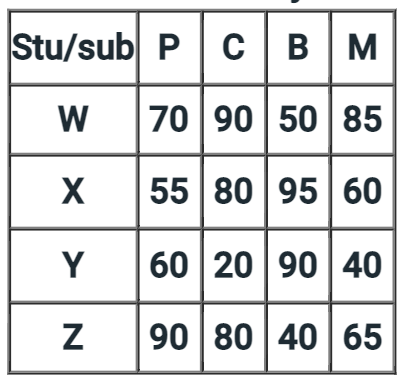
The given table represents marks obtaines by four students W,X,Y and Z in four subjects P,C,B and M, with the maximum marks in each subject being 100.
The difference between the highest and the lowest percentage among the four students
21.2
21.25
21.52
21.75
Step by step video & image solution for The given table represents marks obtaines by four students W,X,Y and Z in four subjects P,C,B and M, with the maximum marks in each subject being 100.The difference between the highest and the lowest percentage among the four students by Maths experts to help you in doubts & scoring excellent marks in Class 14 exams.
Updated on:21/07/2023Similar Questions
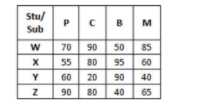
The given table represents the marks obtained by four students W, X, Y and Z in four subjects P, C, B and M, with the maximum marks in each subject being 100. The difference between the highest and the lowest percentage (P, C, M and B together) among the four students is:
View SolutionThe folowing table represents in the marks of four students in five subjects.
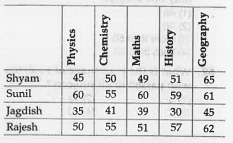
Who has the highest average marks?
View Solution
Knowledge Check
The table given below shows the marks obtained by 4 students in 5 subjects. The maximum marks of each subject is 100. What is the difference in the average marks per student for subjects S5 and S2?
A12B15C17.5D19.5Study the table and answer the questions:
The table given below shows the highest and average marks of a class in four subjects in four years. The maximum marks in each subject are 100.
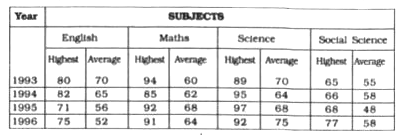
In which year, the difference between the highest and the average marks in Mathematics was maximmum ?A1995B1993C1994D1996What is the difference between the marks obtained by the students in subjects B and D.
A20B27C30D12
The table given below shows the marks obtained by 4 students in 5 subjects. The maximum marks of each subject is 100.
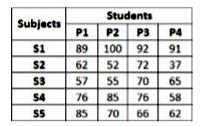
What is the total percent marks of P4?
View SolutionThe table given below shows the marks obtained by 6 students in 3 subjects.
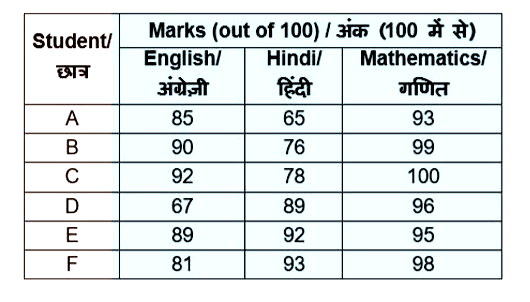
Who has obtained the highest total marks in the given three subjects?
View SolutionThe table given below shows the marks obtained by 4 students in 5 subjects. The maximum marks of each subject is 100.
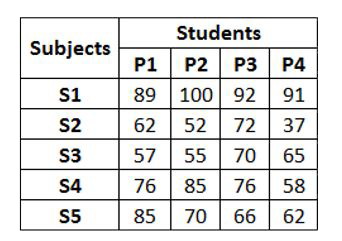
What are the average marks per subject obtained by P2?
View SolutionStudy the table and answer the questions:
The table given below shows the highest and average marks of a class in four subjects in four years. The maximum marks in each subject are 100.
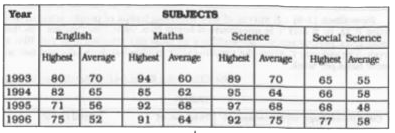
In which year, the difference between the highest and average marks in Social Science was the least ?
View SolutionWhat is the average percentage of marks obtained by all the students in subject C and D together.
View Solution
