A plot of log (xm) against log P for the adsorption of a gas on a sloid gives a straight a straight line with slope equal to :Solution in Telugu
1n
n
logK
K
The correct Answer is:a
Step by step video & image solution for A plot of log (x/m) against log P for the adsorption of a gas on a sloid gives a straight a straight line with slope equal to : by Chemistry experts to help you in doubts & scoring excellent marks in Class 12 exams.
Topper's Solved these Questions
- BOOK - NARENDRA AWASTHICHAPTER - SURFACE CHEMISTRYEXERCISE - Level -21videos
SURFACE CHEMISTRY
- BOOK - NARENDRA AWASTHICHAPTER - SURFACE CHEMISTRYEXERCISE - Level 3 - Assertion - Reason Type Questions1videos
SURFACE CHEMISTRY
- BOOK - NARENDRA AWASTHICHAPTER - CHEMICAL KINETIC & NUCLEAR CHEMISTRYEXERCISE - Level 3 - Subjective Problems3videos
CHEMICAL KINETIC & NUCLEAR CHEMISTRY
Similar Questions
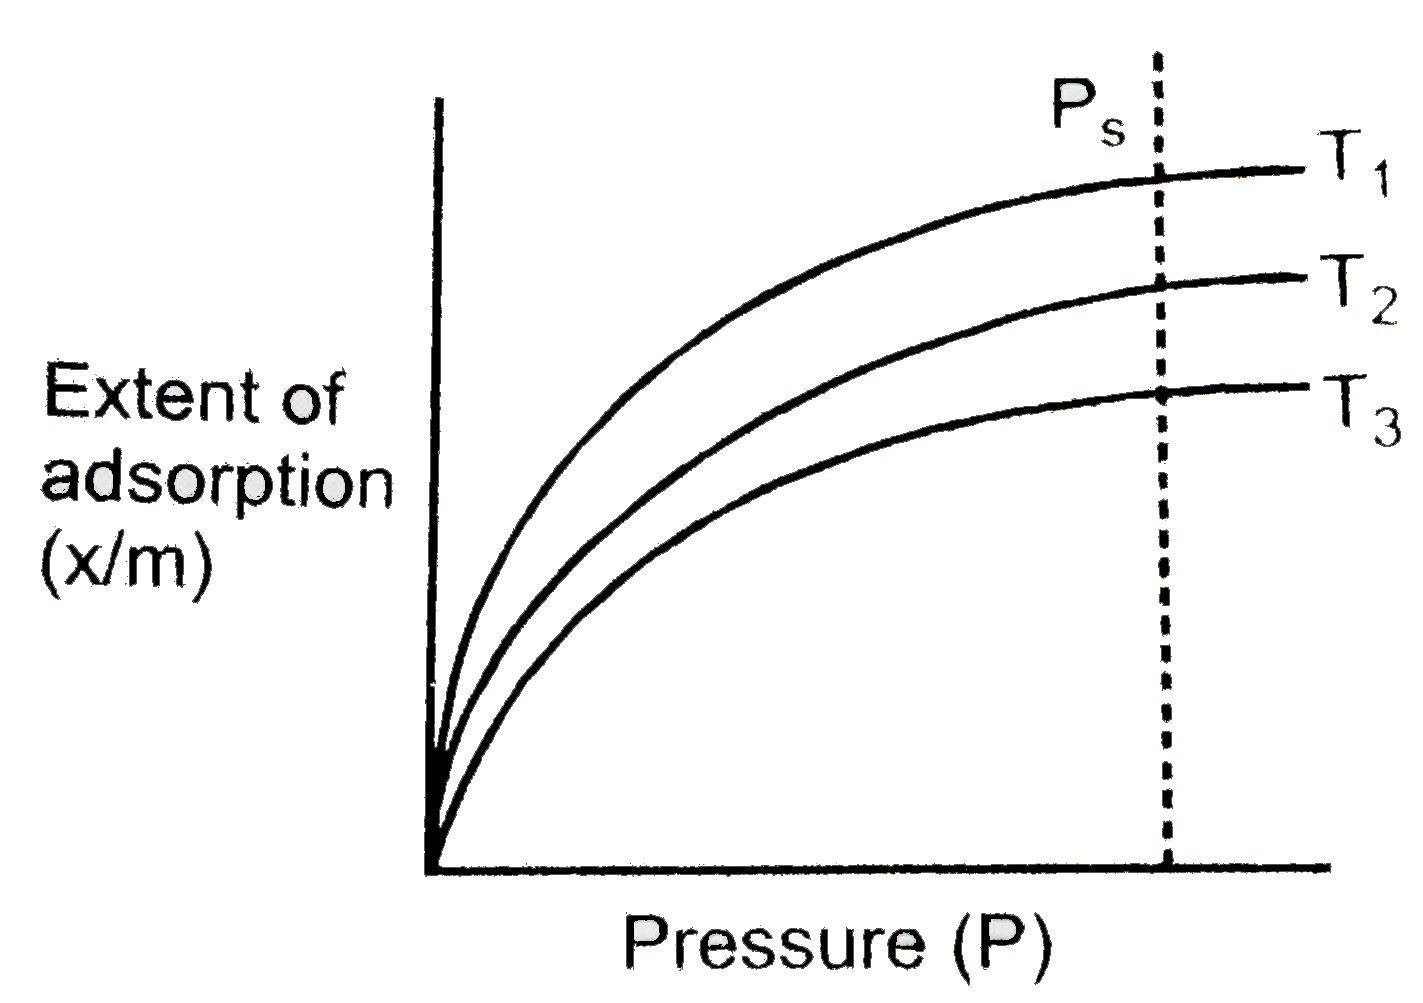
for the graph below, select correct order of temperture ?
 00:52View Solution
each question constain STATEMENT-1(Assertion ) and STATEMENT - 2 (reason). examine the statement carefully and work the correct answer accoridng to the instructions given below :
STATEMENT-1: Dispersed phase particles of colloidal solution cannot pass through ultra -filter paper.
STATEMENT-2: The size of colloidal particles are larger than the size of true solution particles.01:56View Solution5A→Product
In above reaction, half-life period is directly proportional to initial concentration of reactant. The initial rate of reaction is 400 mol lit−1 min−1. Calculate the half - life period ( in sec ) when initial concentration of reactant is 200 mol lit−1 min−1.01:43View SolutionA plt of log X/m vs. log P for the adsorption of a gasd on a solid gives a straight line with slope equal to :
View SolutionFor adsorption of gas on solid suface. The plots of log x//m versus log P is linear with a slope equal to
02:23View SolutionA plot of log (x/m) against log P for the adsorption of a gas on a sloid gives a straight a straight line with slope equal to :
01:36View SolutionA plot of x/m versus log p for the adsorption of a gas on a solid gives a straight line with slope equal to
01:08View SolutionA plot of log (x/m) versus log p for the adsorption of a gas on the surface of a solid gives a straight line which slope equal to :
View SolutionAdsorption of a gas on a surface follows Freundlich adsorption isotherm. Plot of log xm versus log P gives a straight line with slope equal to 0.5, then :
(xm is the mass of the gas adsorbed per gram of adsorbent)View SolutionA plot of log x/m versus log p for the adsorption of a gas on a solid gives a straight line with slope equal to:
02:37View SolutionFor the adsorption of a gas on a solid, the plot of log(x/m) versus log P is linear with slope equal to:
02:02View SolutionFor the adsorption of a gas on a solid, the plot of log(x/m) versus log p is linear with slope equal to
02:36View Solutionएक ठोस की सतह पर एक गैस के अधिशोषण के लिए log(xm) तथा logP के मध्य खींचा गया ग्राफ एक सीधी रेखा के रूप में प्राप्त होता है। जिसका ढ़ाल है
02:39View SolutionFor a adsorption of gas on solid surface, the plots of log x/m vs. log P is linear with a slope equal to
02:39View SolutionA plot of log (xm) against log P for the adsorption of a gas on a sloid gives a straight a straight line with slope equal to :
02:06View SolutionFor adsorption of gas on solid surface the plots of log x/m vs log P is linear with a slope equal to :
02:49View Solution

