Read the given Bar Graph which shows the percentage of marks obtained by Brinda in different subjects in an assessment test
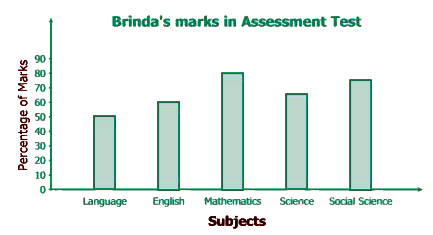
Observe the Bar Graph and answer the following questions.
Brinda scored 60% marks in the subject _____
The correct Answer is:English
Similar Questions
Knowledge Check
Study the following bar graph which shows the marks obtained by Shyam in different subjects of 100 marks each in an examination.
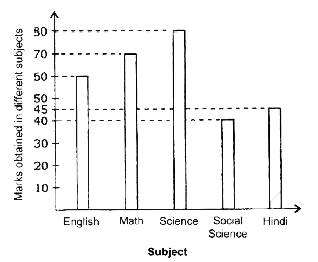
What is the percentage marks of Shyam in Science?A50B80C70D60
The percentage of marks obtained, in different subjects by Ashok Sharma (in an examination) are given below. Draw a bar graph to represent it.

View SolutionThe bar graph shows the marks obtained by Kashish in half-yearly examination in various subjects.
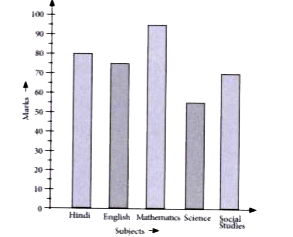
Draw a pictograph for the above data and then answer the following questions.
Find the total marks scored by Kashish.
View SolutionThe given bar graph shows the marks obtained by students in a Science test.
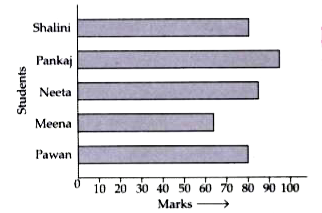
Who scored the highest marks in the test ? Whats in the score ?
View SolutionObserve this bar graph which shows the marks obtained by Aziz in half-yearly examination in different subjects.
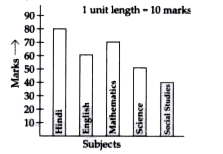
Answer the given questions.
Name the subject in which he has scored minimum marks.
View SolutionObserve this bar graph which shows the marks obtained by Aziz in half-yearly examination in different subjects.
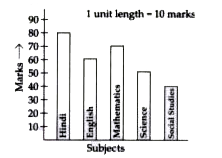
Answer the given questions.
Name the subject in which Aziz scored maximum marks.
View SolutionRead the given bar graph and answer the question that follow :
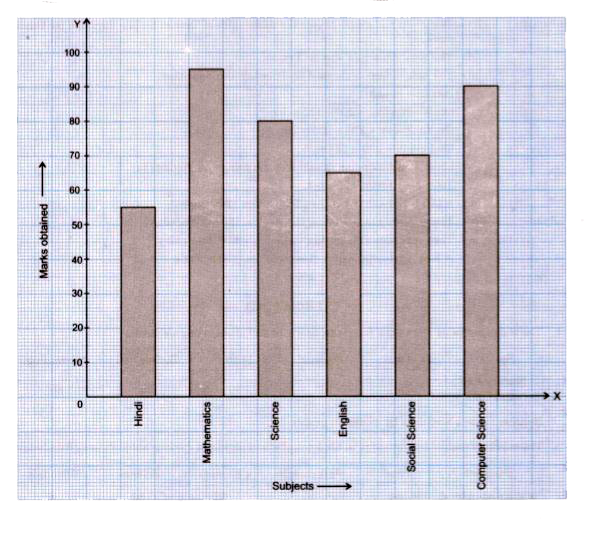
What was the total marks obtained in all the subjects together?
View SolutionObserve this bar graph which shows the marks obtained by Aziz in half-yearly examination in different subjects.
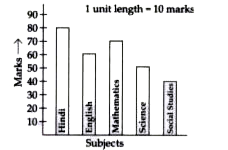
Answer the given questions.
What information does the bar graph give ?
View Solution
