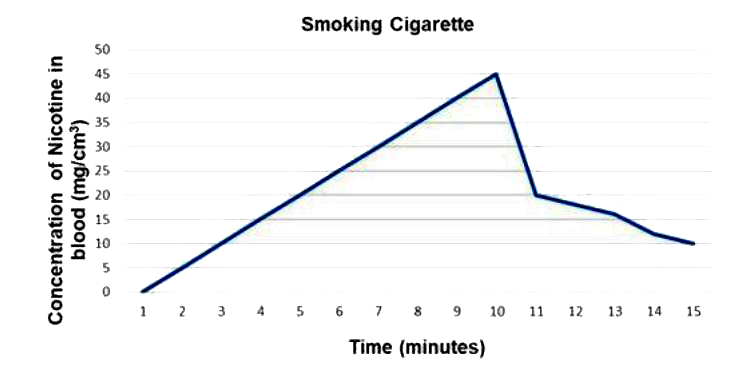
The data below shows the concentration of nicotine smoked by a smoker taking 10 puffs/ minute.

With reference to the above graph explain the concentration of nicotine in blood at 10 minutes.
Step by step video & image solution for The data below shows the concentration of nicotine smoked by a smoker taking 10 puffs/ minute. With reference to the above graph explain the concentration of nicotine in blood at 10 minutes. by Biology experts to help you in doubts & scoring excellent marks in Class 12 exams.
Topper's Solved these Questions
- BOOK - CBSE MODEL PAPERCHAPTER - SAMPLE PAPER 2023 TERM IEXERCISE - SECTION - E13videos
SAMPLE PAPER 2023 TERM I
- BOOK - CBSE MODEL PAPERCHAPTER - SAMPLE PAPER 2023 TERM IEXERCISE - SECTION - C15videos
SAMPLE PAPER 2023 TERM I
- BOOK - CBSE MODEL PAPERCHAPTER - SAMPLE PAPER 2022 TERM IIEXERCISE - SECTION C2videos
SAMPLE PAPER 2022 TERM II
- BOOK - CBSE MODEL PAPERCHAPTER - SAMPLE QUESTION PAPER (BIOLOGY)EXERCISE - SECTION-D6videos
SAMPLE QUESTION PAPER (BIOLOGY)
Similar Questions
Knowledge Check
- Question 1 - Select One
The concentration of a reactant decreases from 0.2 M to 0.1 M in 10 minutes . The rate of the reaction is ______.
A0.01 MB10−2C0.01moldm−3min−1D1 mol - Question 2 - Select One
The concentration of a reactant decreases from 0.2 M to 0.1 M in 10 minutes . The rate of the reaction is ______.
A0.01MB10−2C0.01 mol dm−3min−1D1 moldm−3min−1 - Question 3 - Select One
The concentration of a reactant decreases from 0.2 M to 0.1 M in 10 minutes . The rate of the reaction is ______.
A0.01MB10−2−1minmol−1C0.01moldm−3−1minD1moldm−3−1min
For the reaction A+B→C. The following data were obtained. In the first experiment, when the initial concentrations of both A and B are 0.1M, the observed initial rate of formation of C is 1×10⁻⁴mollitre−1minute−1. In the second experiment when the initial concentrations of A and B are 0.1M and 0.3M, the initial rate is 9.0×10⁻⁴molliter−1minute−1. In the third experiment when the initial concentrations of both A and B are 0.3M the initial rate is 2.7×10⁻³mollitre−1minute−1.
(a) Write rate law for this reaction.
(b) Calculate the value of specific rate constant for this reaction.View SolutionThe rate constant of the reaction A→B is 0.6×10⁻³ mole per second. If the concentration of A is 5M, then concentration of B after 20 minutes is:
View SolutionThe rate constant of the reaction A→B is 0.6×10³ mole per litre per second. If the concentration of A is 5 M, then concentration of B after 20 minutes is
View SolutionThe half life period of a first order reaction is 10 minutes . The time required for the concentration of the reactant to change from 0.08M→0.02is :
View SolutionFor the elem entary reaction 2A→C the concentration of A after 30 minutes was found to be 0.01 mole/lit. If the rate constant of the reaction is 2.5×10⁻² lit mole−1sec−1 the rate of the reaction at 30 minutes is
View Solution


