The diagram given here is the standard ECG of a normal person. The P-wave represents the :

A
Contraction of both the atria
B
Initiation of the ventricular contraction
C
Beginning of the systole
D
End of systole
Text Solution
The correct Answer is:A
P wave in an ECG shows contraction of both the atria
|
Topper's Solved these Questions
- NEETBOOK - NEET PREVIOUS YEAR (YEARWISE + CHAPTERWISE)CHAPTER - NEETEXERCISE - QUESTION
187 Videos
- MORPHOLOGY OF FLOWERING PLANTSBOOK - NEET PREVIOUS YEAR (YEARWISE + CHAPTERWISE)CHAPTER - MORPHOLOGY OF FLOWERING PLANTSEXERCISE - Exercise
91 Videos
- NEET 2018BOOK - NEET PREVIOUS YEAR (YEARWISE + CHAPTERWISE)CHAPTER - NEET 2018EXERCISE - Exercise
90 Videos
Similar Questions
Knowledge Check
In the standard ECG of a normal person, the P-wave represents the
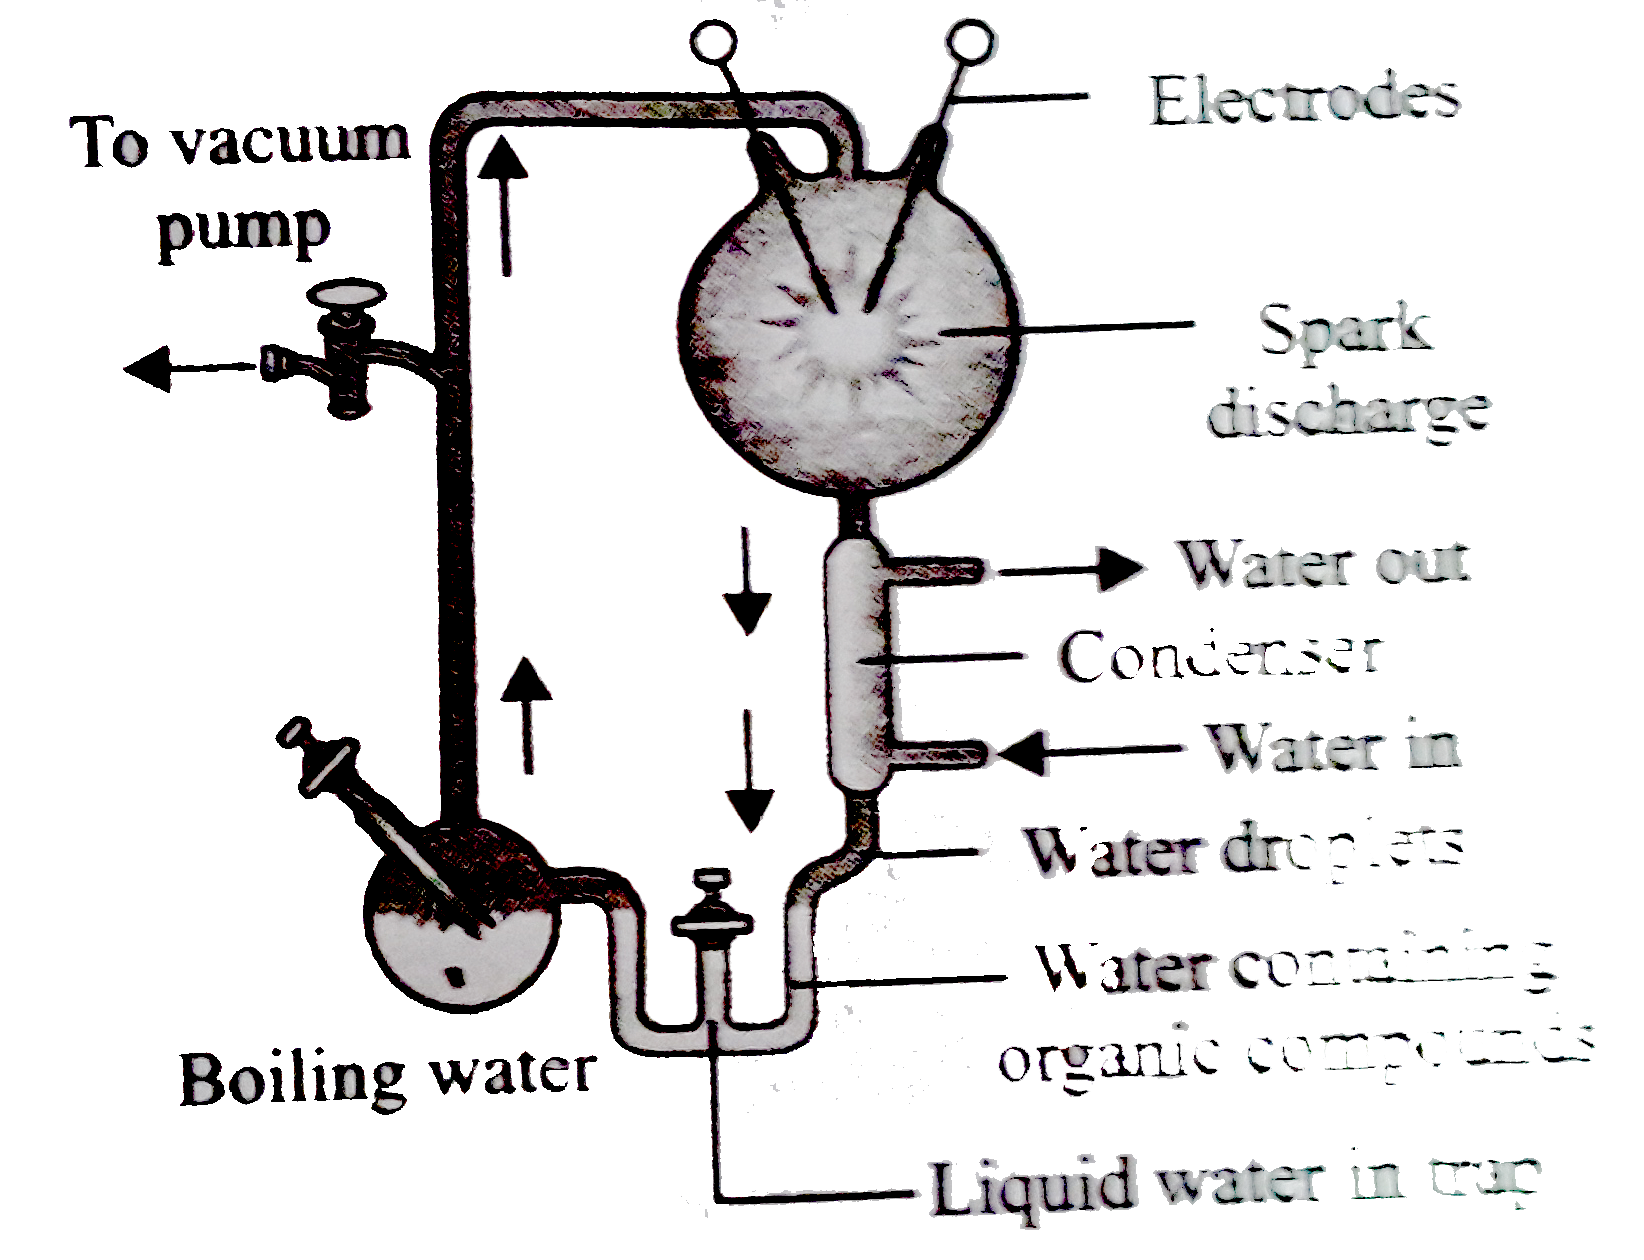
Aatrial depolarisationBventricular depolarisationCatrial repolarisationDventricular repolarisationThe diagram given here is the representation of
 AMiller's experimentBRedi's experimentCLouis pasteur's experimentDSpallanzani's experiment
The diagram given here is the representation of
 AMiller's experimentBRedi's experimentCLouis pasteur's experimentDSpallanzani's experiment

