Is it possible that productivity and diversity of a natural community remain constant over a time period of, say one hundred years ?
No, it is not possible that productivity of a natural community remain constant over a certain time period.
This is because
(i) The natural habitat is never maintained in real.
(ii) Abundant resources are never available, they are always in short supply or just enough.
(iii) Environment conditions for survival and reproduction are continuously changing.
Topper's Solved these Questions
Similar Questions
The line chart given below shows the ratio of poduction to sales of two bike-manufacturing firms over the period of 6 years.
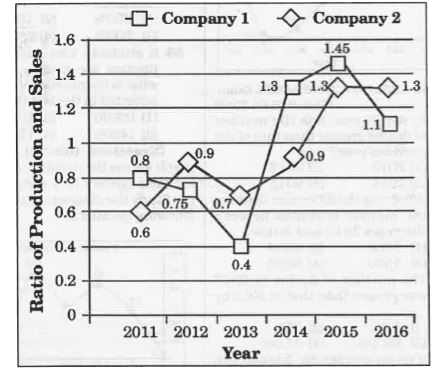
Assume if in any year sales is more than production then both the companies have sufficient stock to meet such instances.
The production of company 1 in year 2014 is 18000 and sales of comapny 2 in year 2012 is 15000. What is the ratio of difference in sales and production of company 1 in year 2014 and that of company 2 in year 2012?
View SolutionThe line chart given below shows the ratio of production to sales of two bike-manufacturing firms over the period of 6 years.
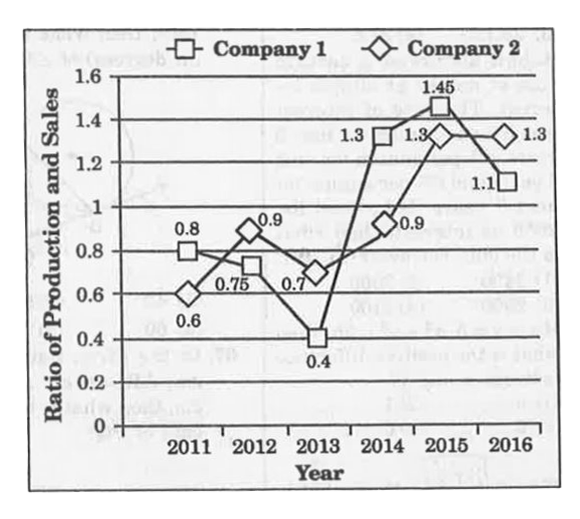
Assume if in any year sales is more than production then both the companies have sufficient stock to meet such instances.
The production of company 2 in year 2012 is 30000. If sales of company 2 in year 2012 and 2013 are same, then what was its production (in units) in year 2013?
View Solution
Knowledge Check
The table given below represents the production and sales of wheat in 4 different countries A, B, C and D over a period of 4 years. At the end of year 2010 A, B, C and D had a stock of 5200, 3500, 7835 and 1956 (in '000 quintals) of wheat respectively. For any given year, the stock of wheat is calculated as :
Stock of year (n + 1) = stock at end of year (n) + production in year (n + 1) - sales in year (n + 1)
And Surplus or year (n) = production in year (n) - sales in year (n)
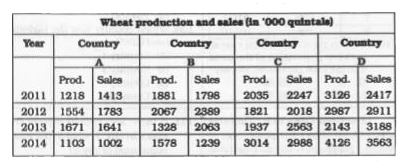
What can be said about total surplus of country B and country D over the 4 years?ASurplus of B = Surplus of DBSurplus of D > Surplus of BCSurplus of B > Surplus of DDNo relation is thereThe table given below represents the production and sales of wheat in 4 different countries A, B, C and D over a period of 4 years. At the end of year 2010 A, B, C and D had a stock of 5200, 3500, 7835 and 1956 (in '000 quintals) of wheat respectively. For any given year, the stock of wheat is calculated as :
Stock of year (n + 1) = stock at end of year (n) + production in year (n + 1) - sales in year (n + 1)
And Surplus or year (n) = production in year (n) - sales in year (n)
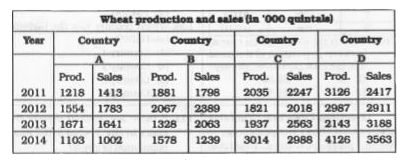
What is the stock (in '000 quintals) of country C at end of the four year period?A5926B6213C6826D8844The table given below represents the production and sales of wheat in 4 different countries A, B, C and D over a period of 4 years. At the end of year 2010 A, B, C and D had a stock of 5200, 3500, 7835 and 1956 (in '000 quintals) of wheat respectively. For any given year, the stock of wheat is calculated as :
Stock of year (n + 1) = stock at end of year (n) + production in year (n + 1) - sales in year (n + 1)
And Surplus or year (n) = production in year (n) - sales in year (n)
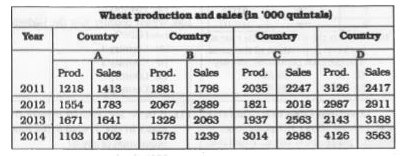
What is the difference between (in '000 quintals) in average production and average sales respectively country C in the given four years?A-252.25B-415.5C350.75D275.25
The table given below represents the production and sales of wheat in 4 different countries A, B, C and D over a period of 4 years. At the end of year 2010 A, B, C and D had a stock of 5200, 3500, 7835 and 1956 (in '000 quintals) of wheat respectively. For any given year, the stock of wheat is calculated as :
Stock of year (n + 1) = stock at end of year (n) + production in year (n + 1) - sales in year (n + 1)
And Surplus or year (n) = production in year (n) - sales in year (n)
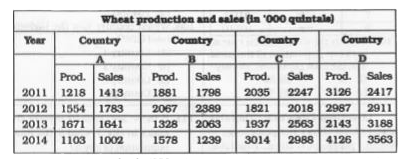
What is the surplus (in '000 quintals) of country A of years 2013 and 2014 taken together?
View SolutionAssertion: The bob of a simple pendulum is a full of water if a fine hole is made at the bottom of the of the ball , then the time period will no more remain constant
Reason : The time period of simple pendulum does not depend open mass
View SolutionThe following table shows the productions of food-grains (in million tons) in a state for the period 1999 - 2000 to 2003 - 2004. Read the table and the questions.
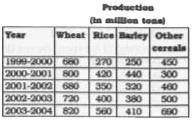
The different of average production of rice and the average production of barley over the years is (in million tonnes) :
View SolutionThe energy stored by a community over a specific period a time is called its
View SolutionThe line chart given below shows the ratio of poduction to sales of two bike-manufacturing firms over the period of 6 years.

Assume if in any year sales is more than production then both the companies have sufficient stock to meet such instances.
The production of company 1 in year 2014 is 18000 and sales of comapny 2 in year 2012 is 15000. What is the ratio of difference in sales and production of company 1 in year 2014 and that of company 2 in year 2012?
View Solution
