Temperature affects
metabolic rate
morphology
geographical distribution
all the above
The correct Answer is:D
To answer the question "Temperature affects," we will analyze the options provided and determine the correct answer step by step.
1. Understanding the Question: The question asks about the effects of temperature on various biological aspects. We have four options to consider: metabolic rates, morphology, geographical distribution, and all of the above.
2. Analyzing Option 1: Metabolic Rates:
- Temperature has a significant impact on metabolic rates. Enzymatic activity, which is crucial for metabolic processes, is influenced by temperature.
- As temperature increases, the kinetic energy of molecules also increases, leading to higher enzymatic activity up to a certain point.
- Therefore, temperature does affect metabolic rates.
3. Analyzing Option 2: Morphology:
- Morphology refers to the physical appearance and structure of organisms.
- Temperature can influence the development and physical characteristics of organisms. For example, organisms may adapt their morphology to survive in varying temperature conditions.
- Hence, temperature also affects morphology.
4. Analyzing Option 3: Geographical Distribution:
- Temperature plays a crucial role in determining the geographical distribution of species.
- Different species are found in specific temperature ranges. For instance, polar regions have organisms adapted to cold temperatures, while tropical deserts host species that thrive in high temperatures.
- Thus, temperature affects geographical distribution as well.
5. Conclusion:
- Since temperature affects metabolic rates, morphology, and geographical distribution, we can conclude that all the options are correct.
- Therefore, the correct answer is "all of the above."
Final Answer:
Temperature affects metabolic rates, morphology, and geographical distribution. Therefore, the correct option is "all of the above."
---
- Temperature has a significant impact on metabolic rates. Enzymatic activity, which is crucial for metabolic processes, is influenced by temperature.
- As temperature increases, the kinetic energy of molecules also increases, leading to higher enzymatic activity up to a certain point.
- Therefore, temperature does affect metabolic rates.
- Morphology refers to the physical appearance and structure of organisms.
- Temperature can influence the development and physical characteristics of organisms. For example, organisms may adapt their morphology to survive in varying temperature conditions.
- Hence, temperature also affects morphology.
- Temperature plays a crucial role in determining the geographical distribution of species.
- Different species are found in specific temperature ranges. For instance, polar regions have organisms adapted to cold temperatures, while tropical deserts host species that thrive in high temperatures.
- Thus, temperature affects geographical distribution as well.
- Since temperature affects metabolic rates, morphology, and geographical distribution, we can conclude that all the options are correct.
- Therefore, the correct answer is "all of the above."
Temperature affects metabolic rates, morphology, and geographical distribution. Therefore, the correct option is "all of the above."
Topper's Solved these Questions
- ORGANISMS AND POPULATIONSBOOK - AAKASH SERIESCHAPTER - ORGANISMS AND POPULATIONSEXERCISE - EXERCISE-II (RESPONSE TO ABIOTIC FACTORS)
5 Videos
- ORGANISMS AND POPULATIONSBOOK - AAKASH SERIESCHAPTER - ORGANISMS AND POPULATIONSEXERCISE - EXERCISE-II (WATER)
2 Videos
- ORGANISMS AND POPULATIONSBOOK - AAKASH SERIESCHAPTER - ORGANISMS AND POPULATIONSEXERCISE - EXERCISE-II (ORGANISM AND ENVIRONMENT - INTRODUCTION)
6 Videos
- NEURAL CONTROL AND COORDINATIONBOOK - AAKASH SERIESCHAPTER - NEURAL CONTROL AND COORDINATIONEXERCISE - EXERCISE-III( PREVIOUS AIPMT / NEET QUESTIONS)
33 Videos
- PHOTOSYNTHESIS IN HIGHER PLANTS BOOK - AAKASH SERIESCHAPTER - PHOTOSYNTHESIS IN HIGHER PLANTS EXERCISE - Exercise - III
27 Videos
Similar Questions
Study the following statements and select the correct ones.
i) Organisms restricted to a narrow range of temperatures are called eurythermal.
ii) Organisms capable of tolerating a wide range of temperature are called stenothermal organisms.
iii) The levels of thermal tolerance of different species determine to a large extent their geographical disrributio.
iv) Temperature affects the kinetics of enzymes.
View SolutionHow does temperature affect the electrical conductivity of electrolytes ?
View Solution
Knowledge Check

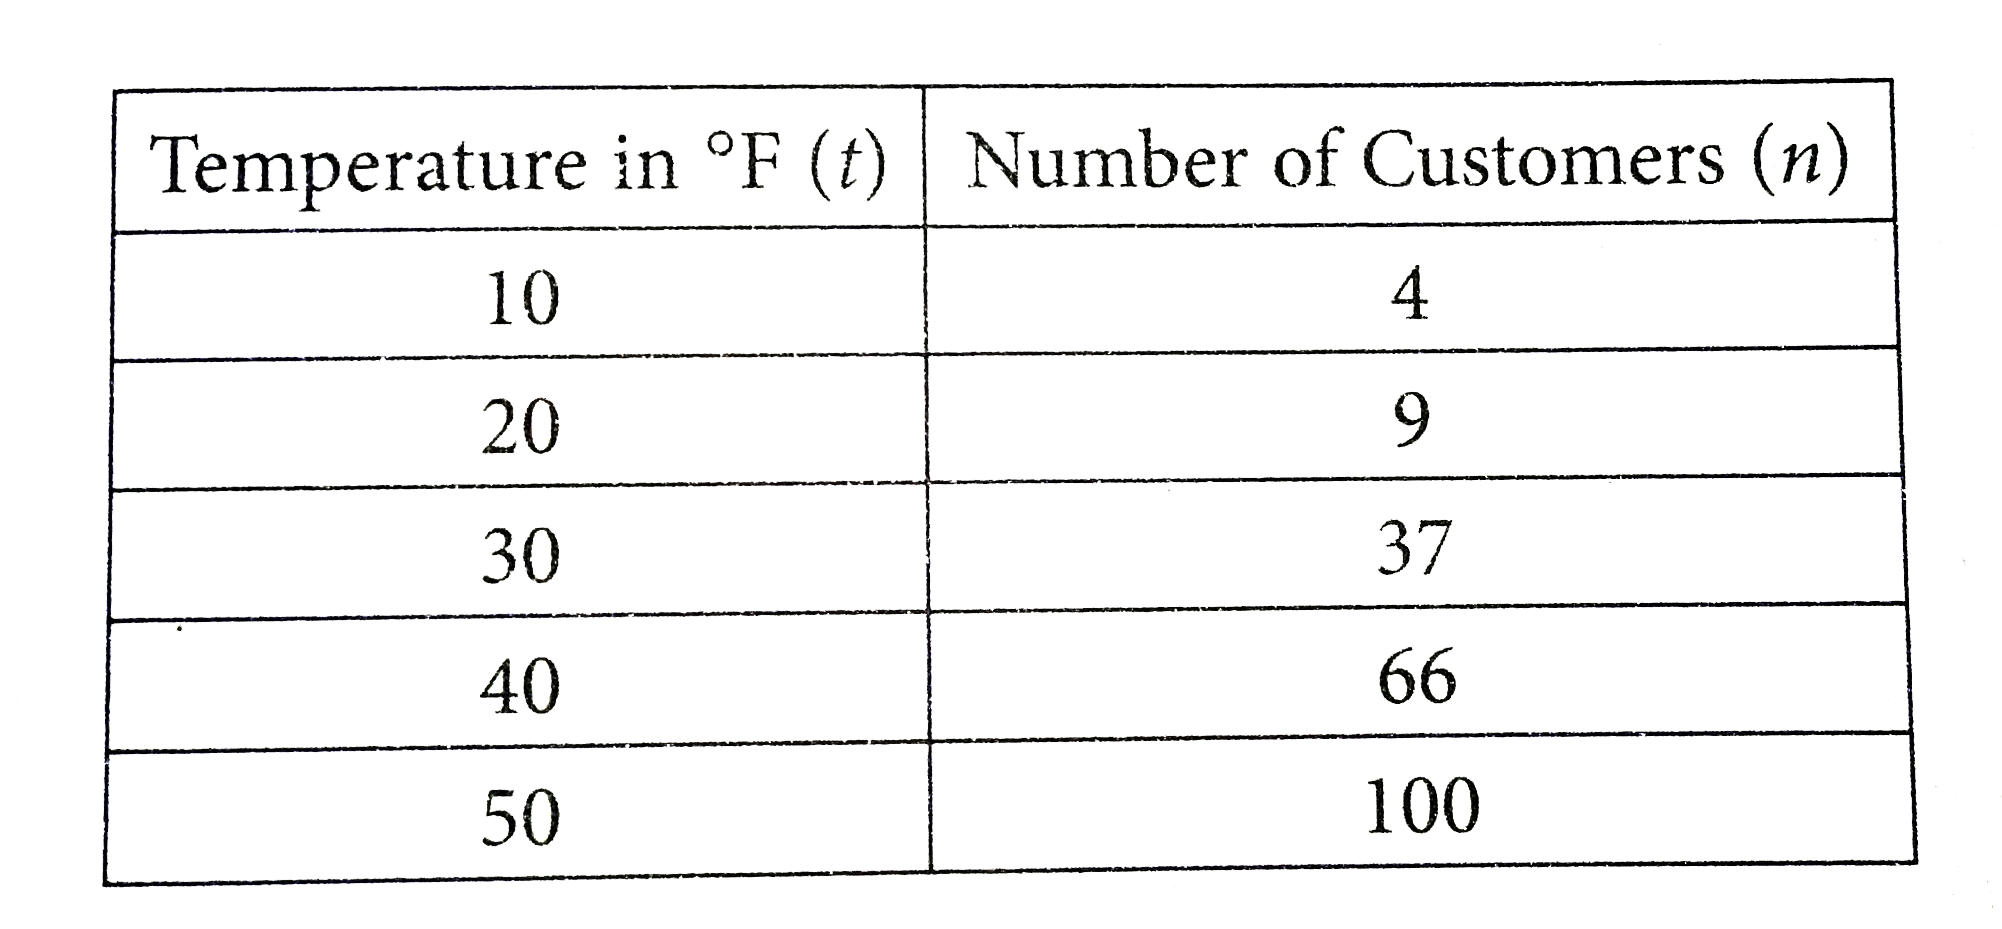
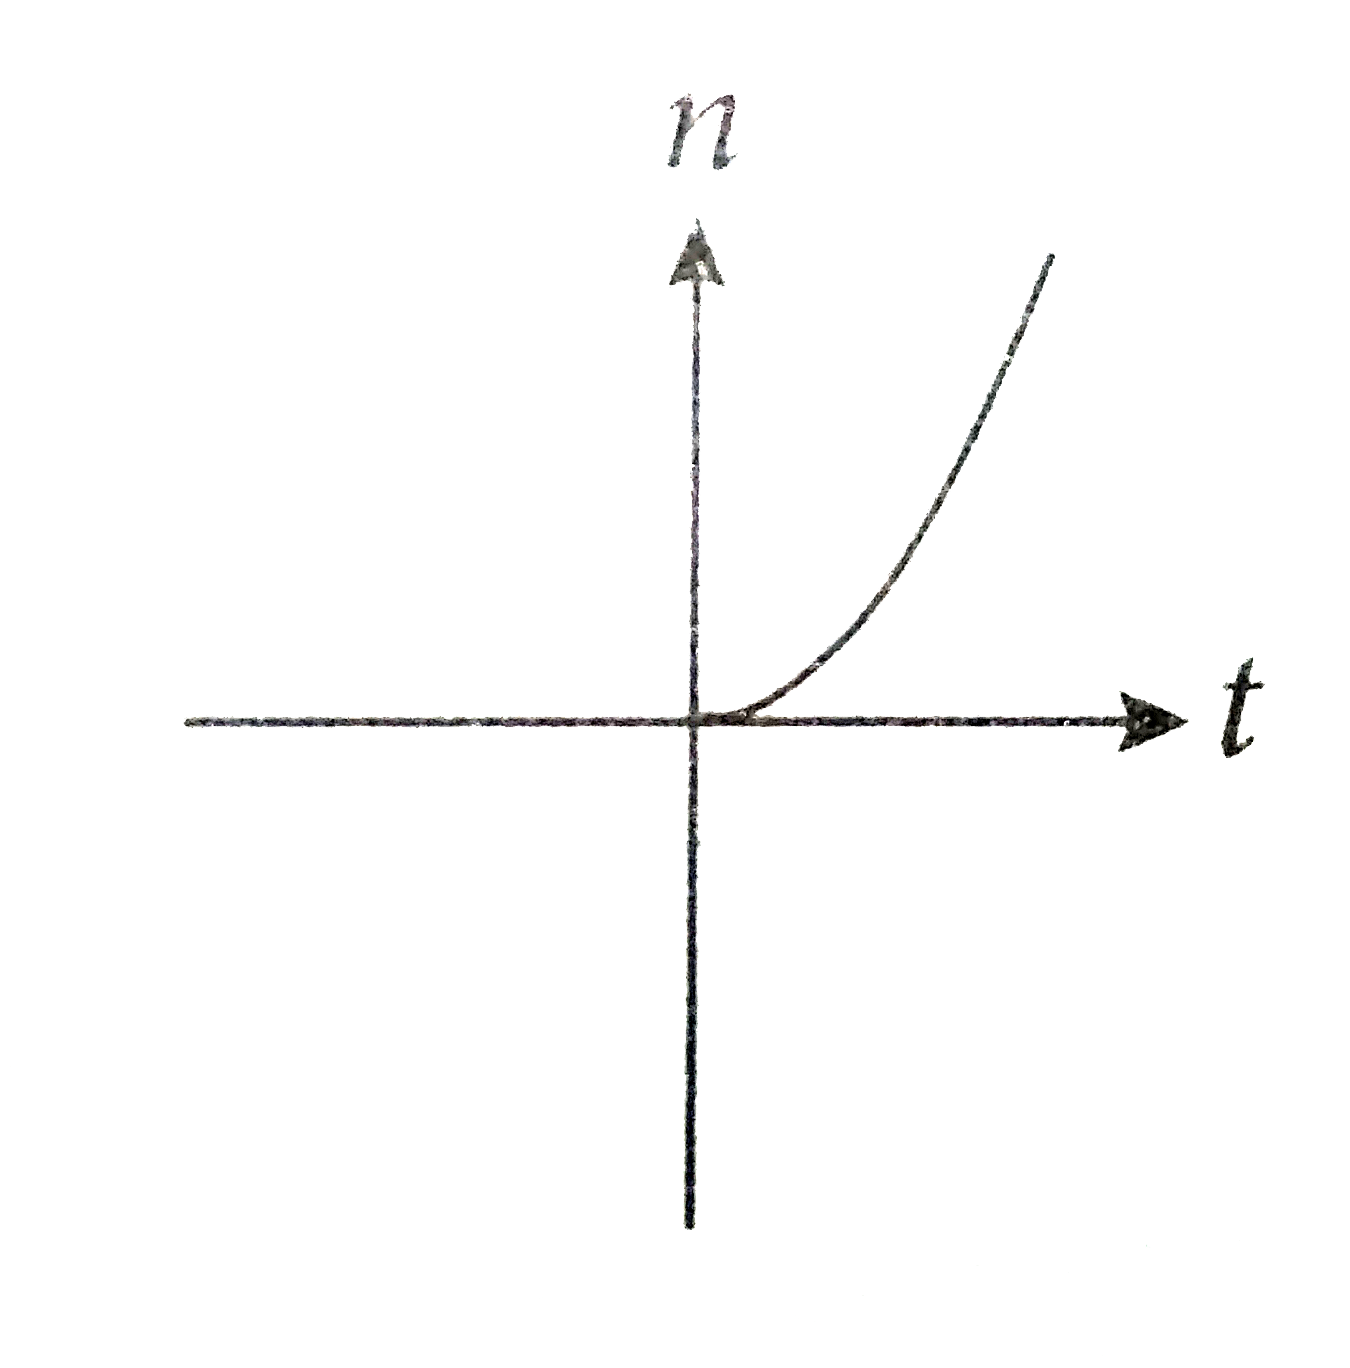
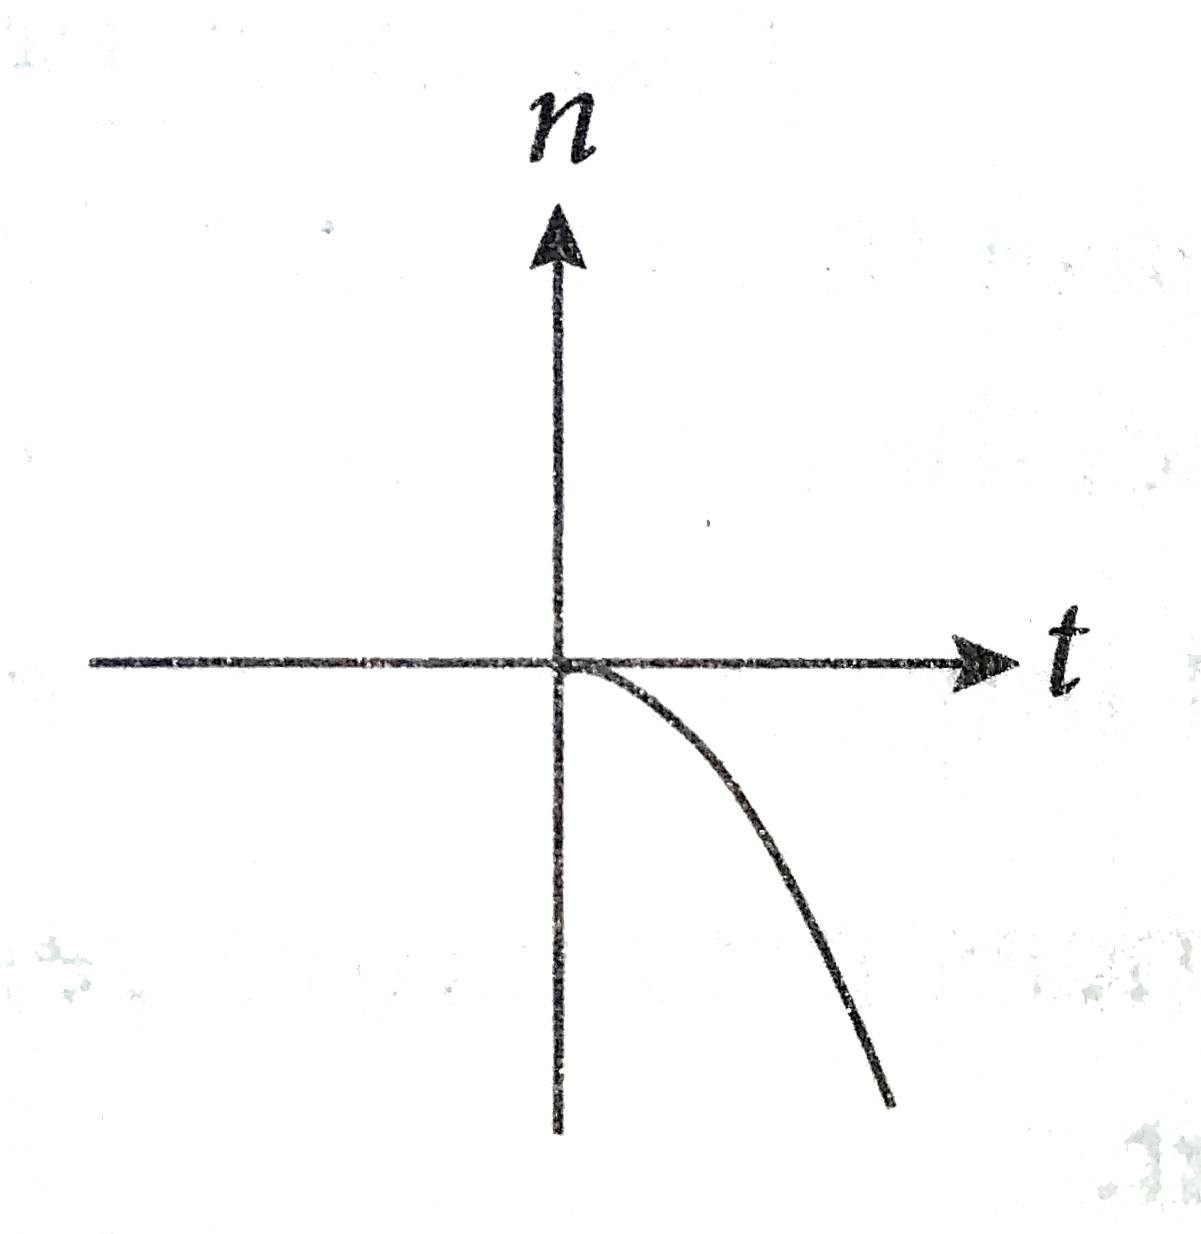
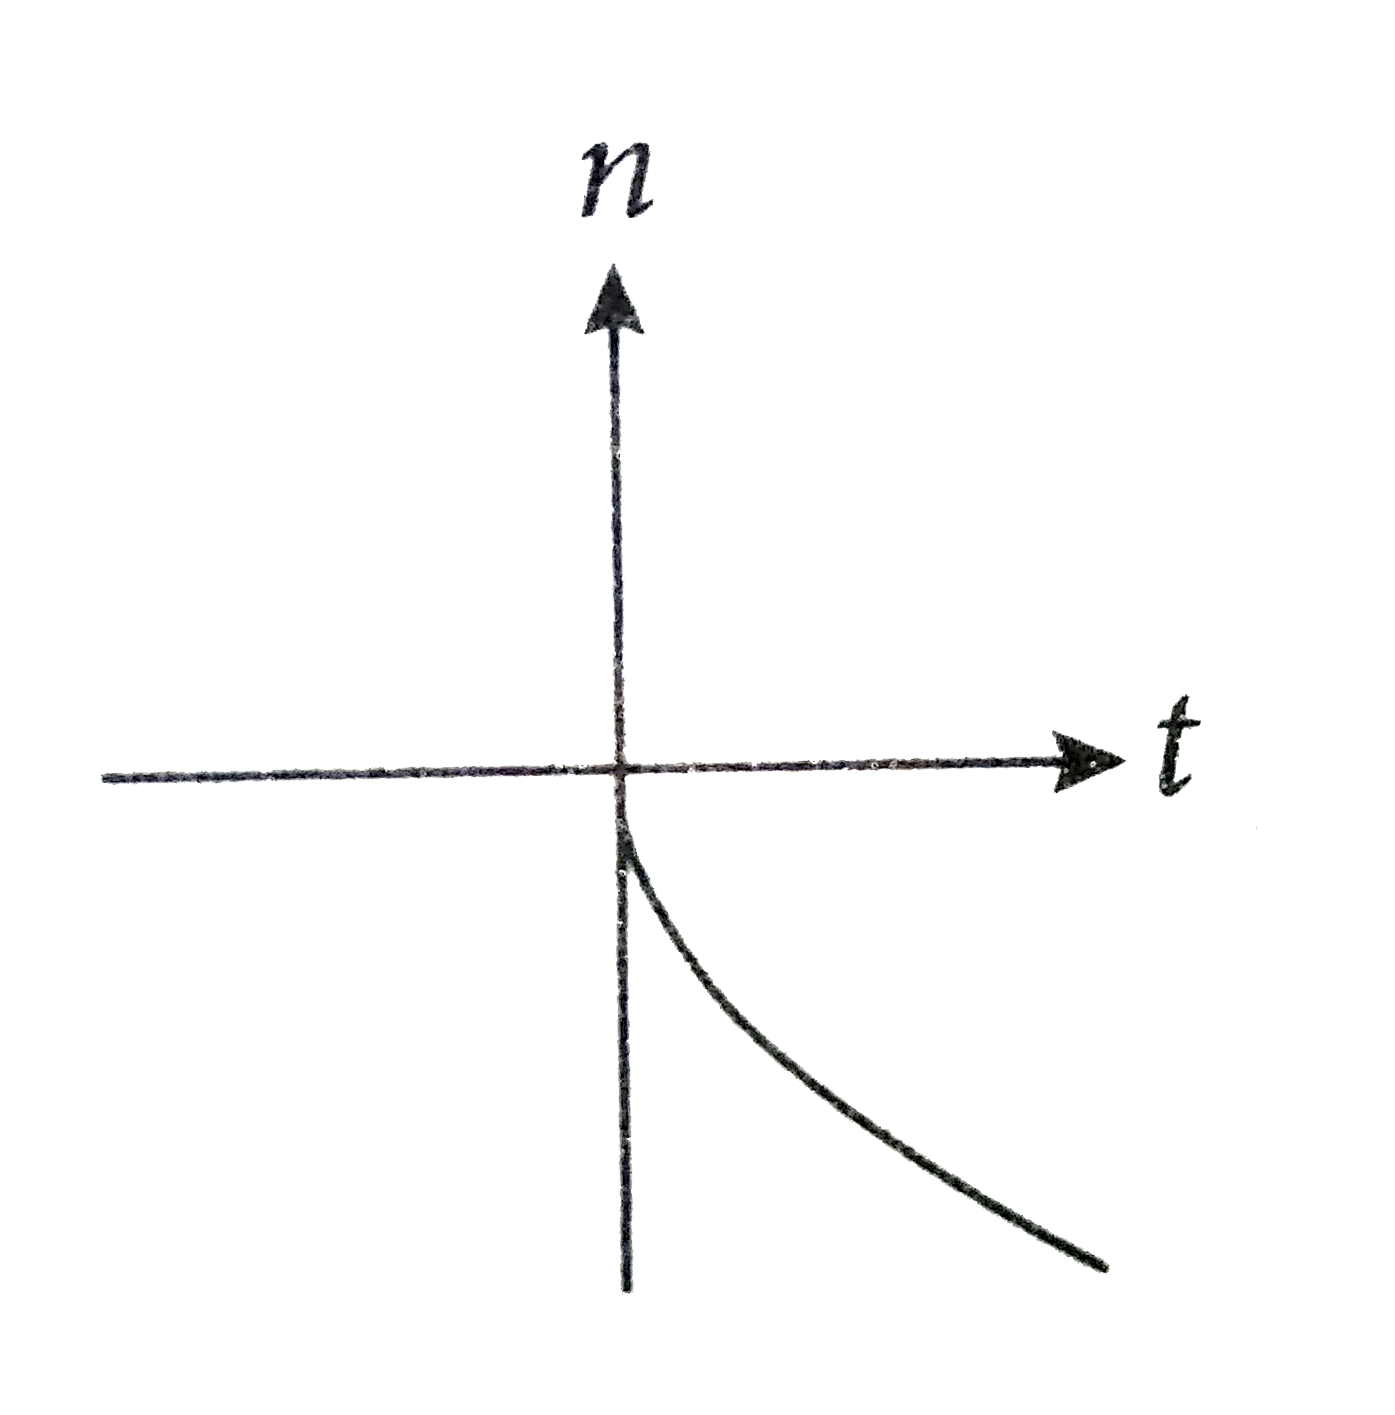
A coffee shop noticed that the outside temperature affected the number of customers who came to the shop that day, as shown in the table above. Which of the following graphs best represents the relationship between the outside temperature t, and the number of customers,n, as indicated by the table?A B
B C
C D
D
How do light and temperature affect rate of photosynthesis?
View SolutionHow does an increase in the temperature affect the specific resistance of a :
Semiconductor ?
View SolutionHow does an increase in the temperature affect the specific resistance of a :
Metal and
View SolutionHow will the lowering of temperature affect the chemical equilibrium in the system
2NO+O2⇔2NO2,ΔH<0
View SolutionHow does temperature affect the rate of a reaction ? Is there a corresponding equal increase in number of collisions among molecules of a gaseous reaction ? How is this effect explained by the concept of activation energy and activated molecules?
View SolutionAmong light and dark reaction which reaction is more temperature affected?
View SolutionTemperature changes in the environment affect most of the animals which are
View Solution
