The density of a population in a given habit during a given period, fluctuates due to changes in certain basic processes. On this basis, fill up boxes A and B in the given flow chart with correct option.

A
A− Natality, B− Mortality
B
A− Immigration, B−Emigration
C
A−Natality, B−Immigration
D
Both (a) and (b)
Video Solution
Text Solution
The correct Answer is:D
Natality and Immigration add to the population density Mortality and emigration decrease the population density.
|
Updated on:21/07/2023
Topper's Solved these Questions
- BOOK - NCERT FINGERTPS ENGLISHCHAPTER - ORGANISMS AND POPULATIONEXERCISE - HOTS5videos
ORGANISMS AND POPULATION
- BOOK - NCERT FINGERTPS ENGLISHCHAPTER - ORGANISMS AND POPULATIONEXERCISE - NCERT20videos
ORGANISMS AND POPULATION
- BOOK - NCERT FINGERTPS ENGLISHCHAPTER - MOLECULAR BASIS OF INHERITANCEEXERCISE - Molecular Basis Of Inheritance151videos
MOLECULAR BASIS OF INHERITANCE
- BOOK - NCERT FINGERTPS ENGLISHCHAPTER - PRACTICE PAPERSEXERCISE - Practice paper150videos
PRACTICE PAPERS
Similar Questions
Knowledge Check
- Question 1 - Select One
Identify A,B,C and D in the given flow chart and slect the correct option.
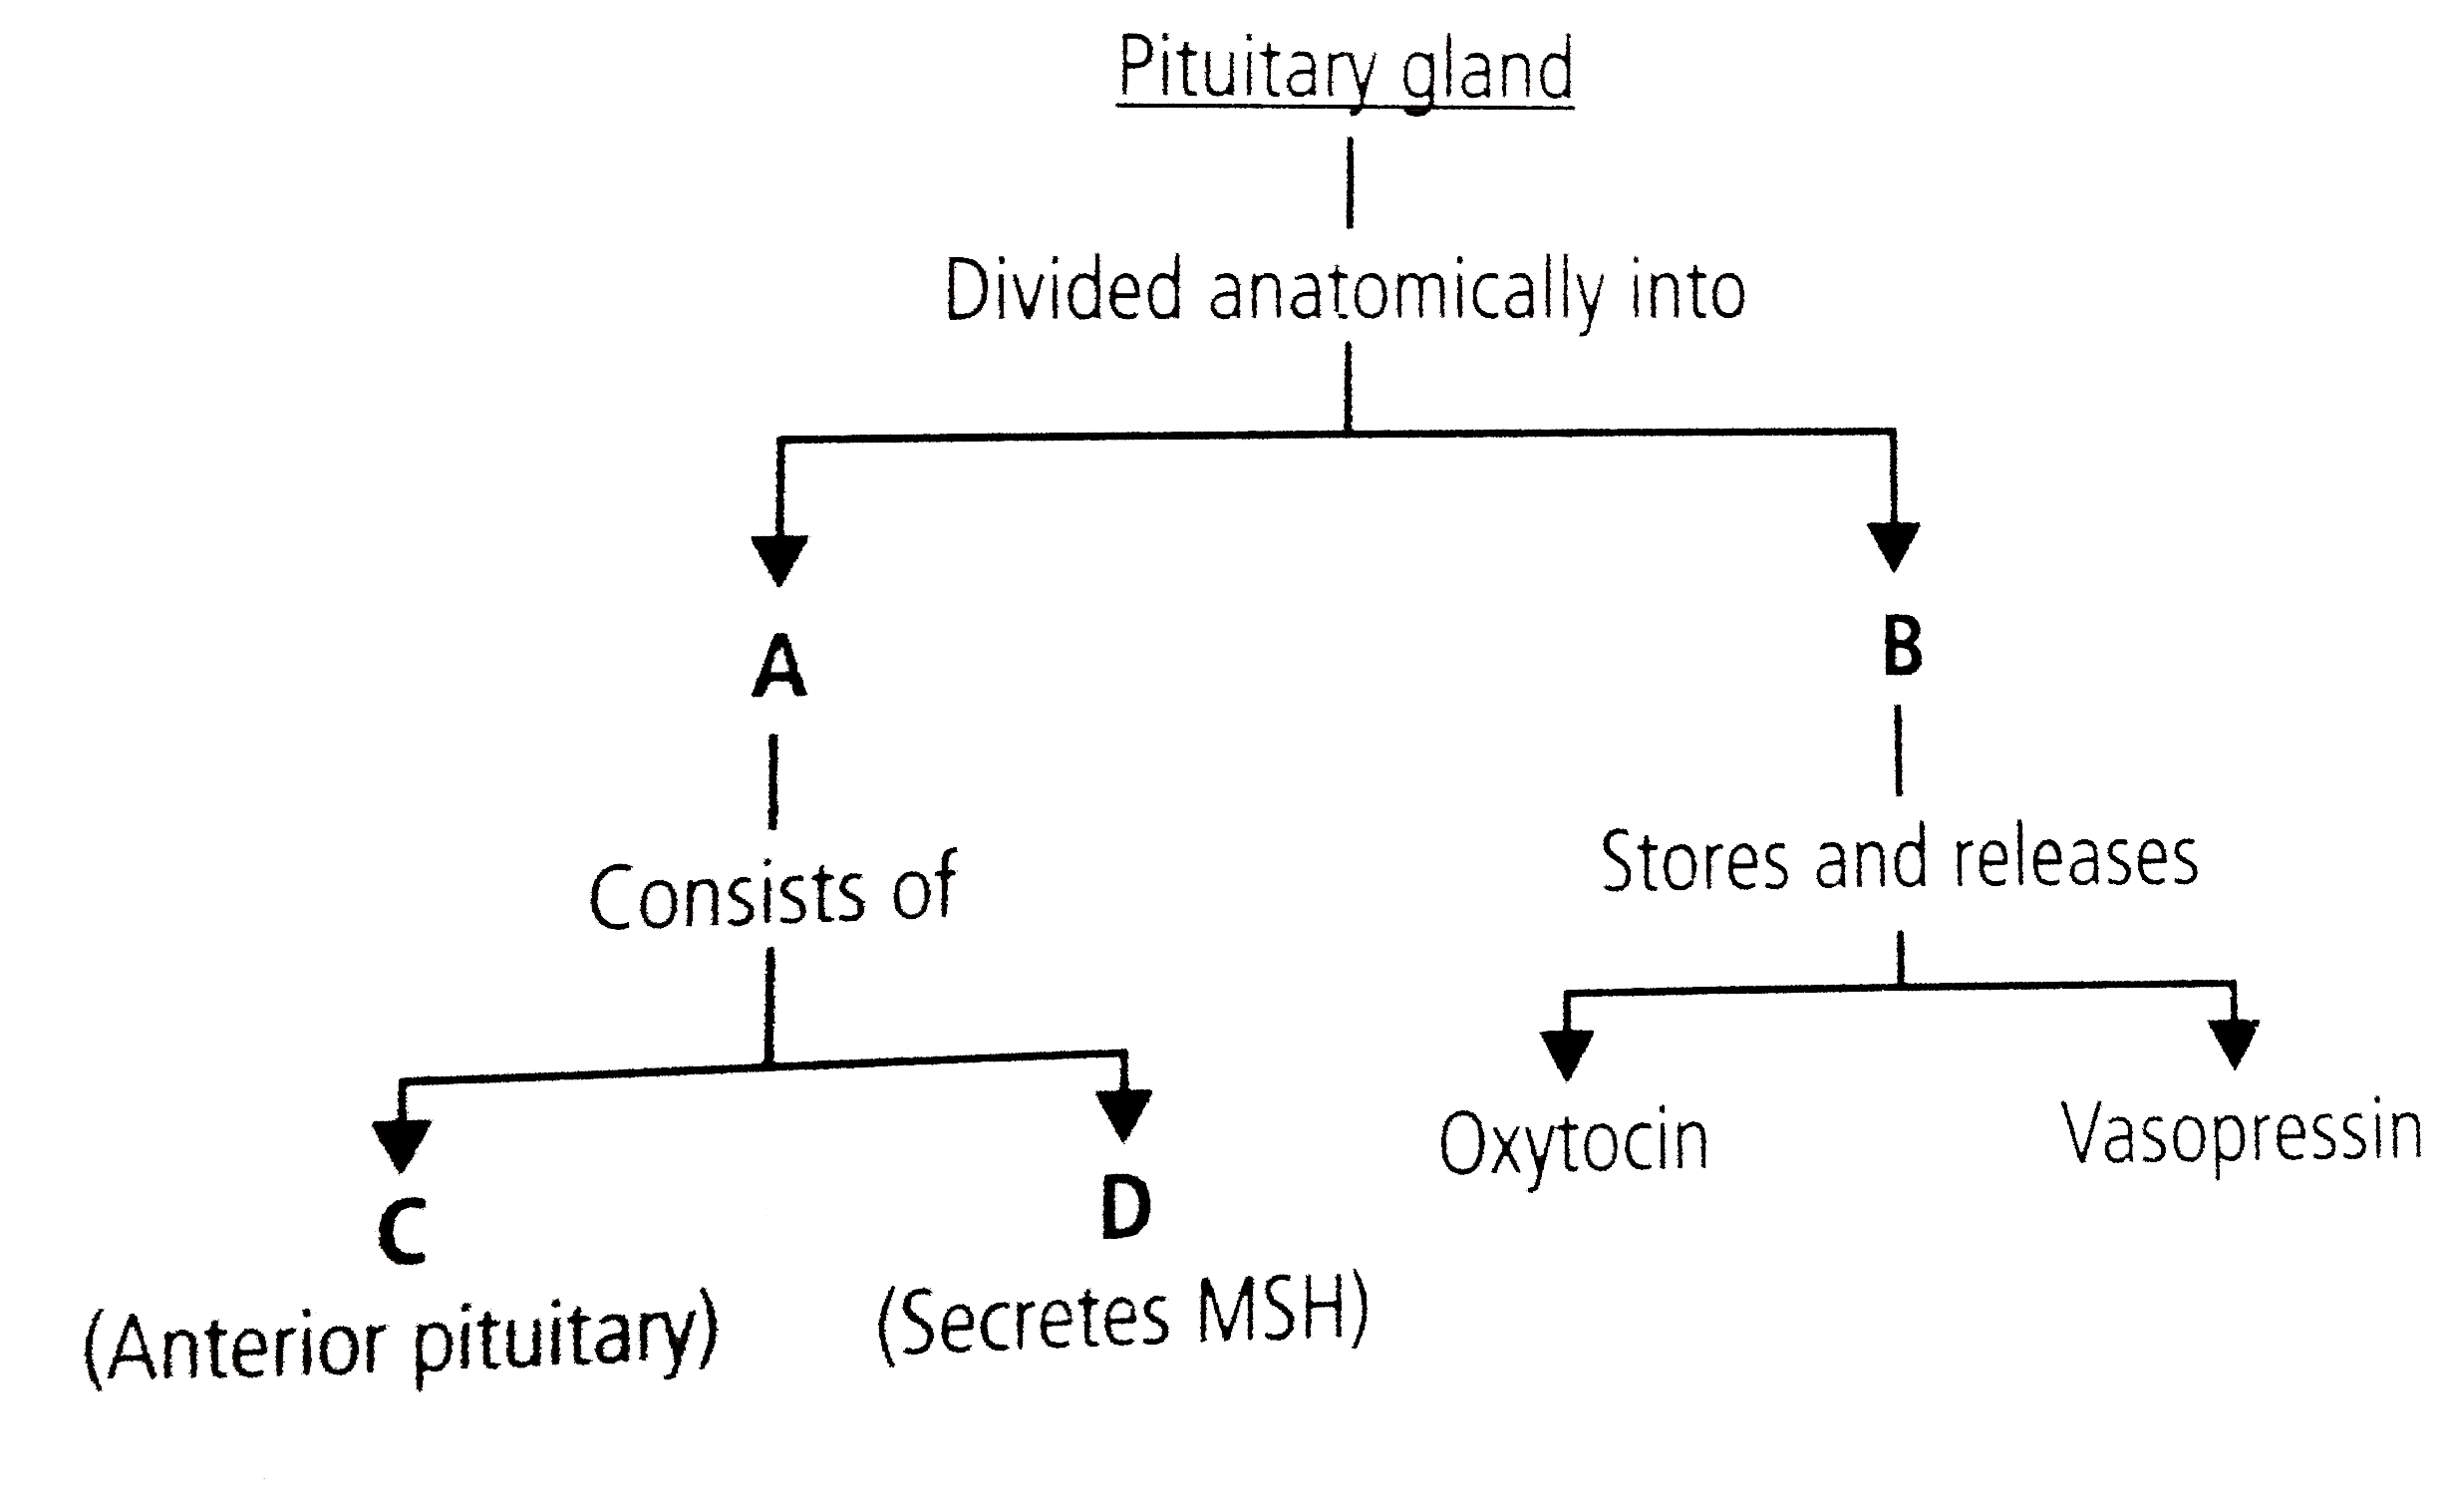 AABCDNeurohypophysisAdenohypophysisParsdistalisPars intermediaBABCDAdeno-hypophysisNeurohypophysisPars intermediaPars distailsCABCDAdenohypophysisNeuro-hypophysisParsdistailsPars intermediaDABCDNeuro-hypophysisAdeno-hypophysisPars intermediaPars distails
 - Question 2 - Select One
In the following diagram label A and B
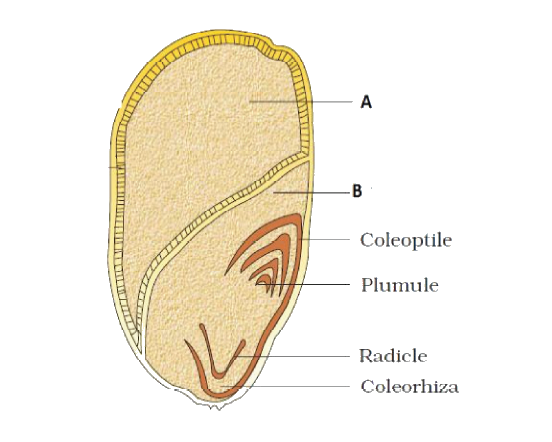 AABCScutellumColeorhizaColeoptileBABCScutellumColeoptileColeorhizaCABCColeoptileScutellumColeorhizaDABCColeorhizaScutellumColeoptile
 - Question 3 - Select One
Refer to the given flow chart.

Identify X and select the correct option.ACommunitiesBBiospheresCBiomesDSpecies
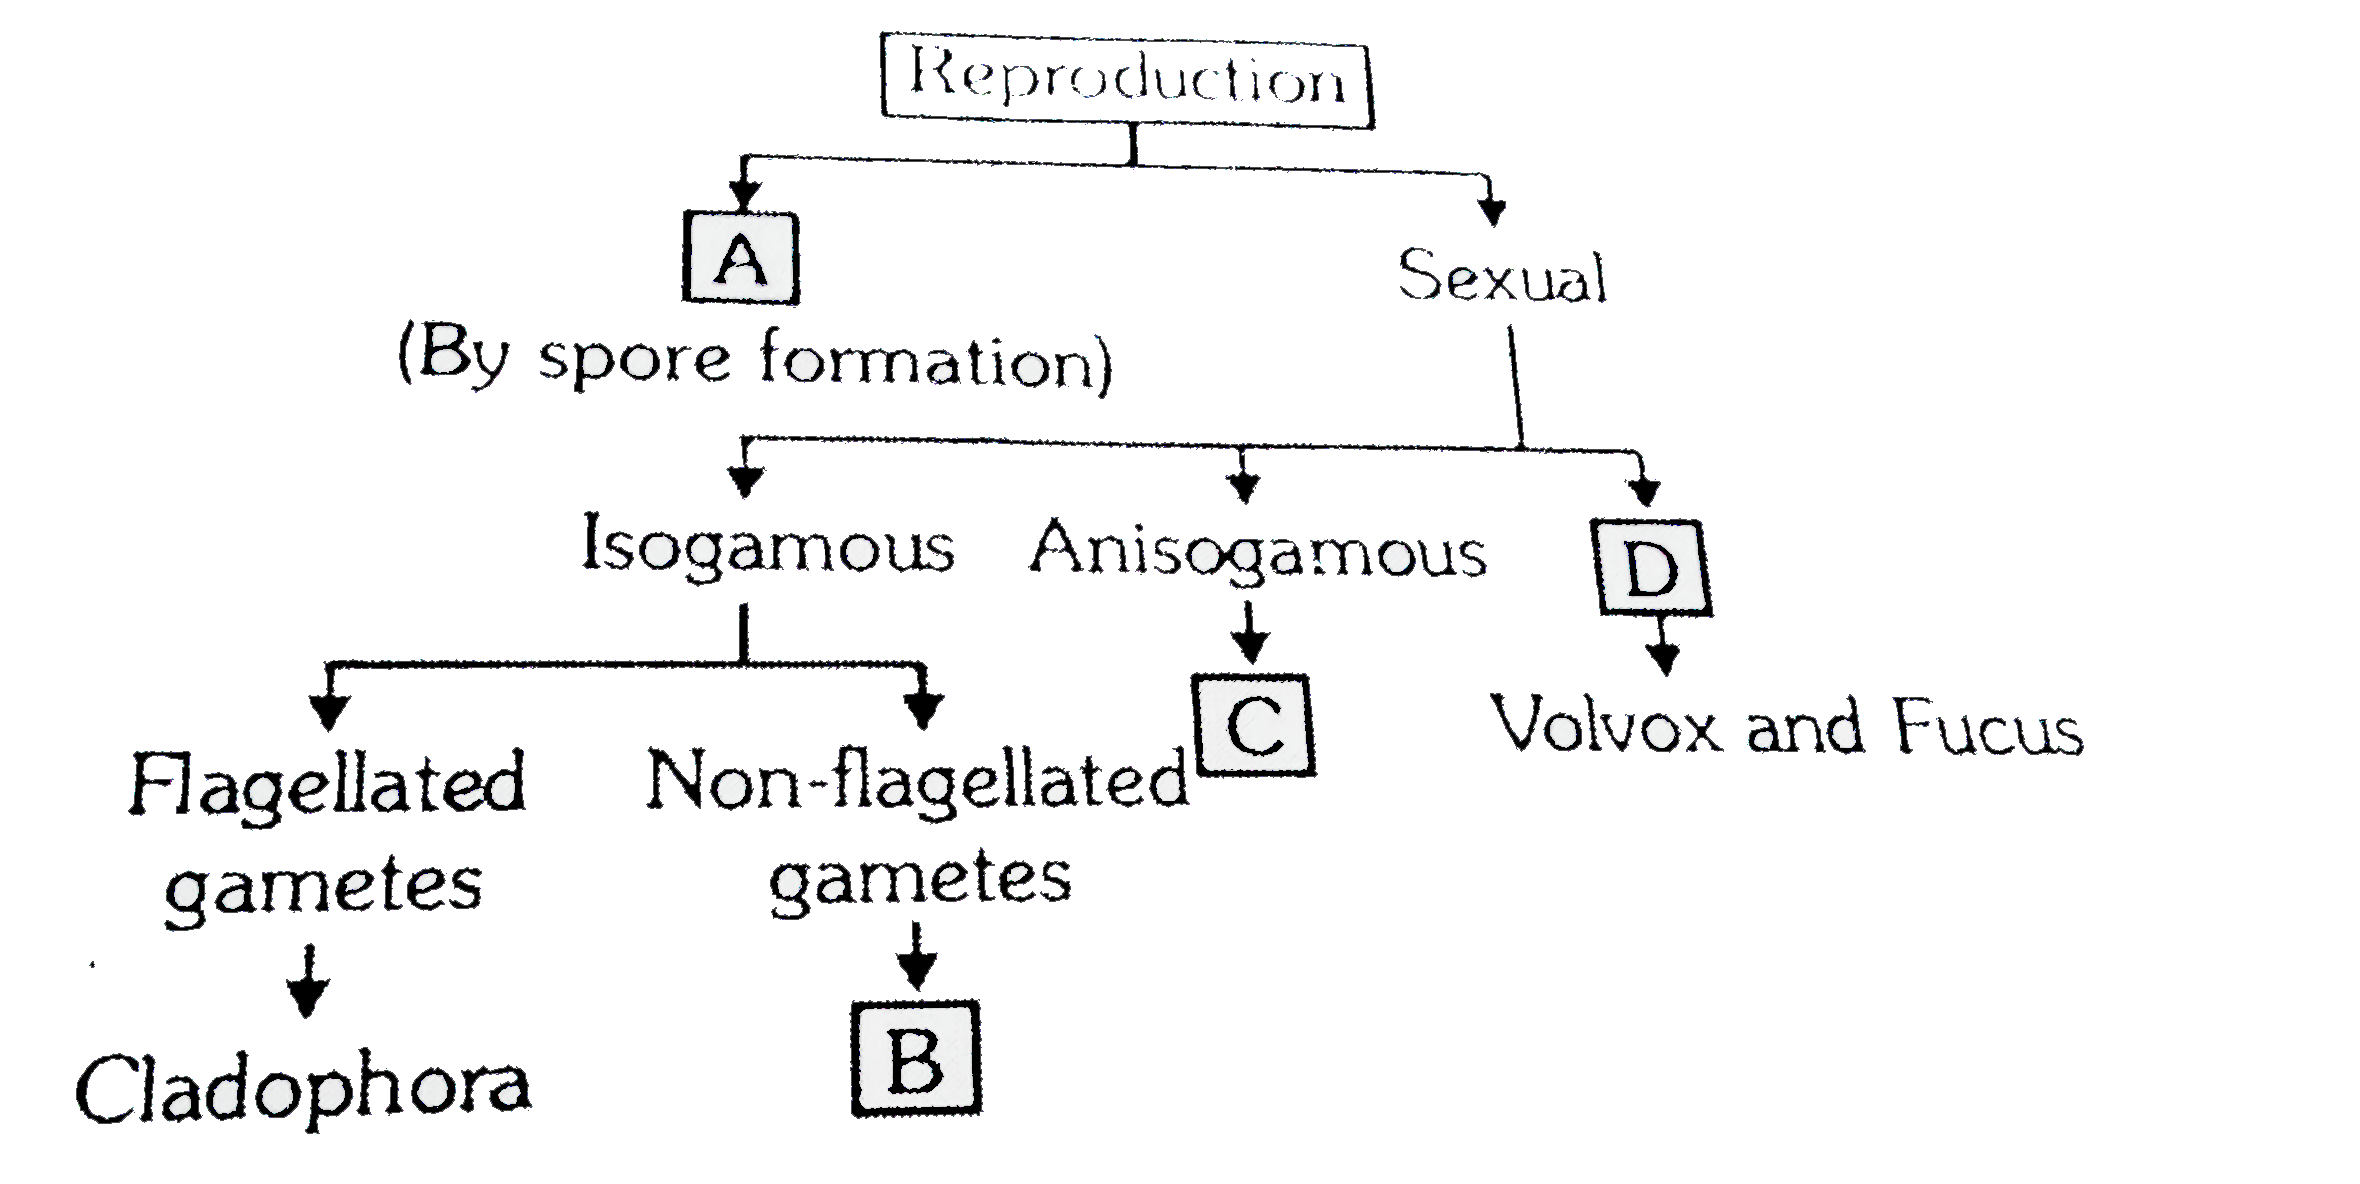
Identify A,B,C and D in given flow chart:-
 View Solution
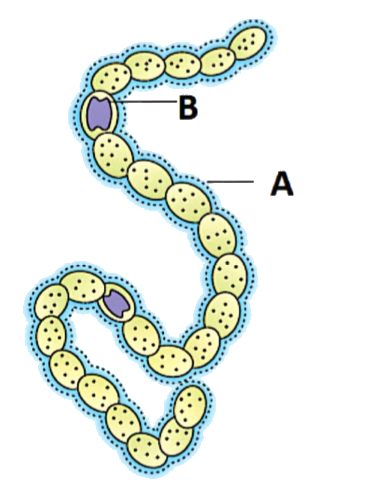
Identify parts labeled A and B in the given diagram and selecte the correct option.
 View Solution
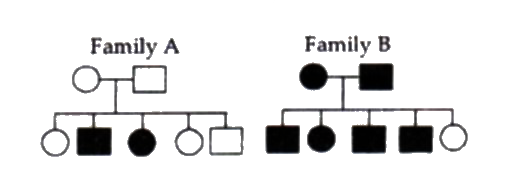
Analyze the pedigree chart of families A and B given below and select the correct option.
 View Solution
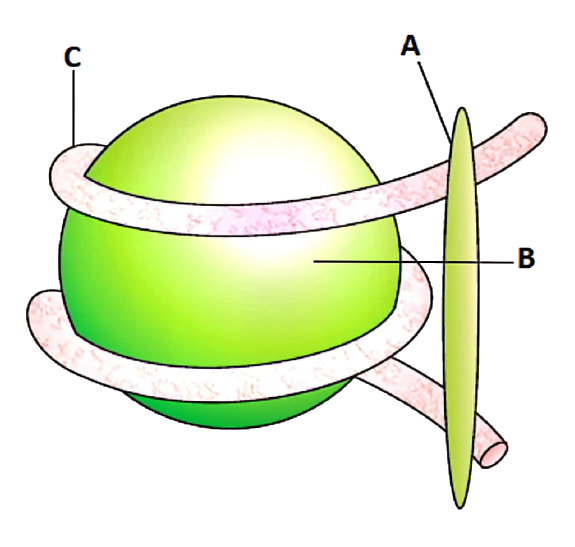
Identify parts labelled A, B, and C in the given diagram and select the correct option.
 View Solution
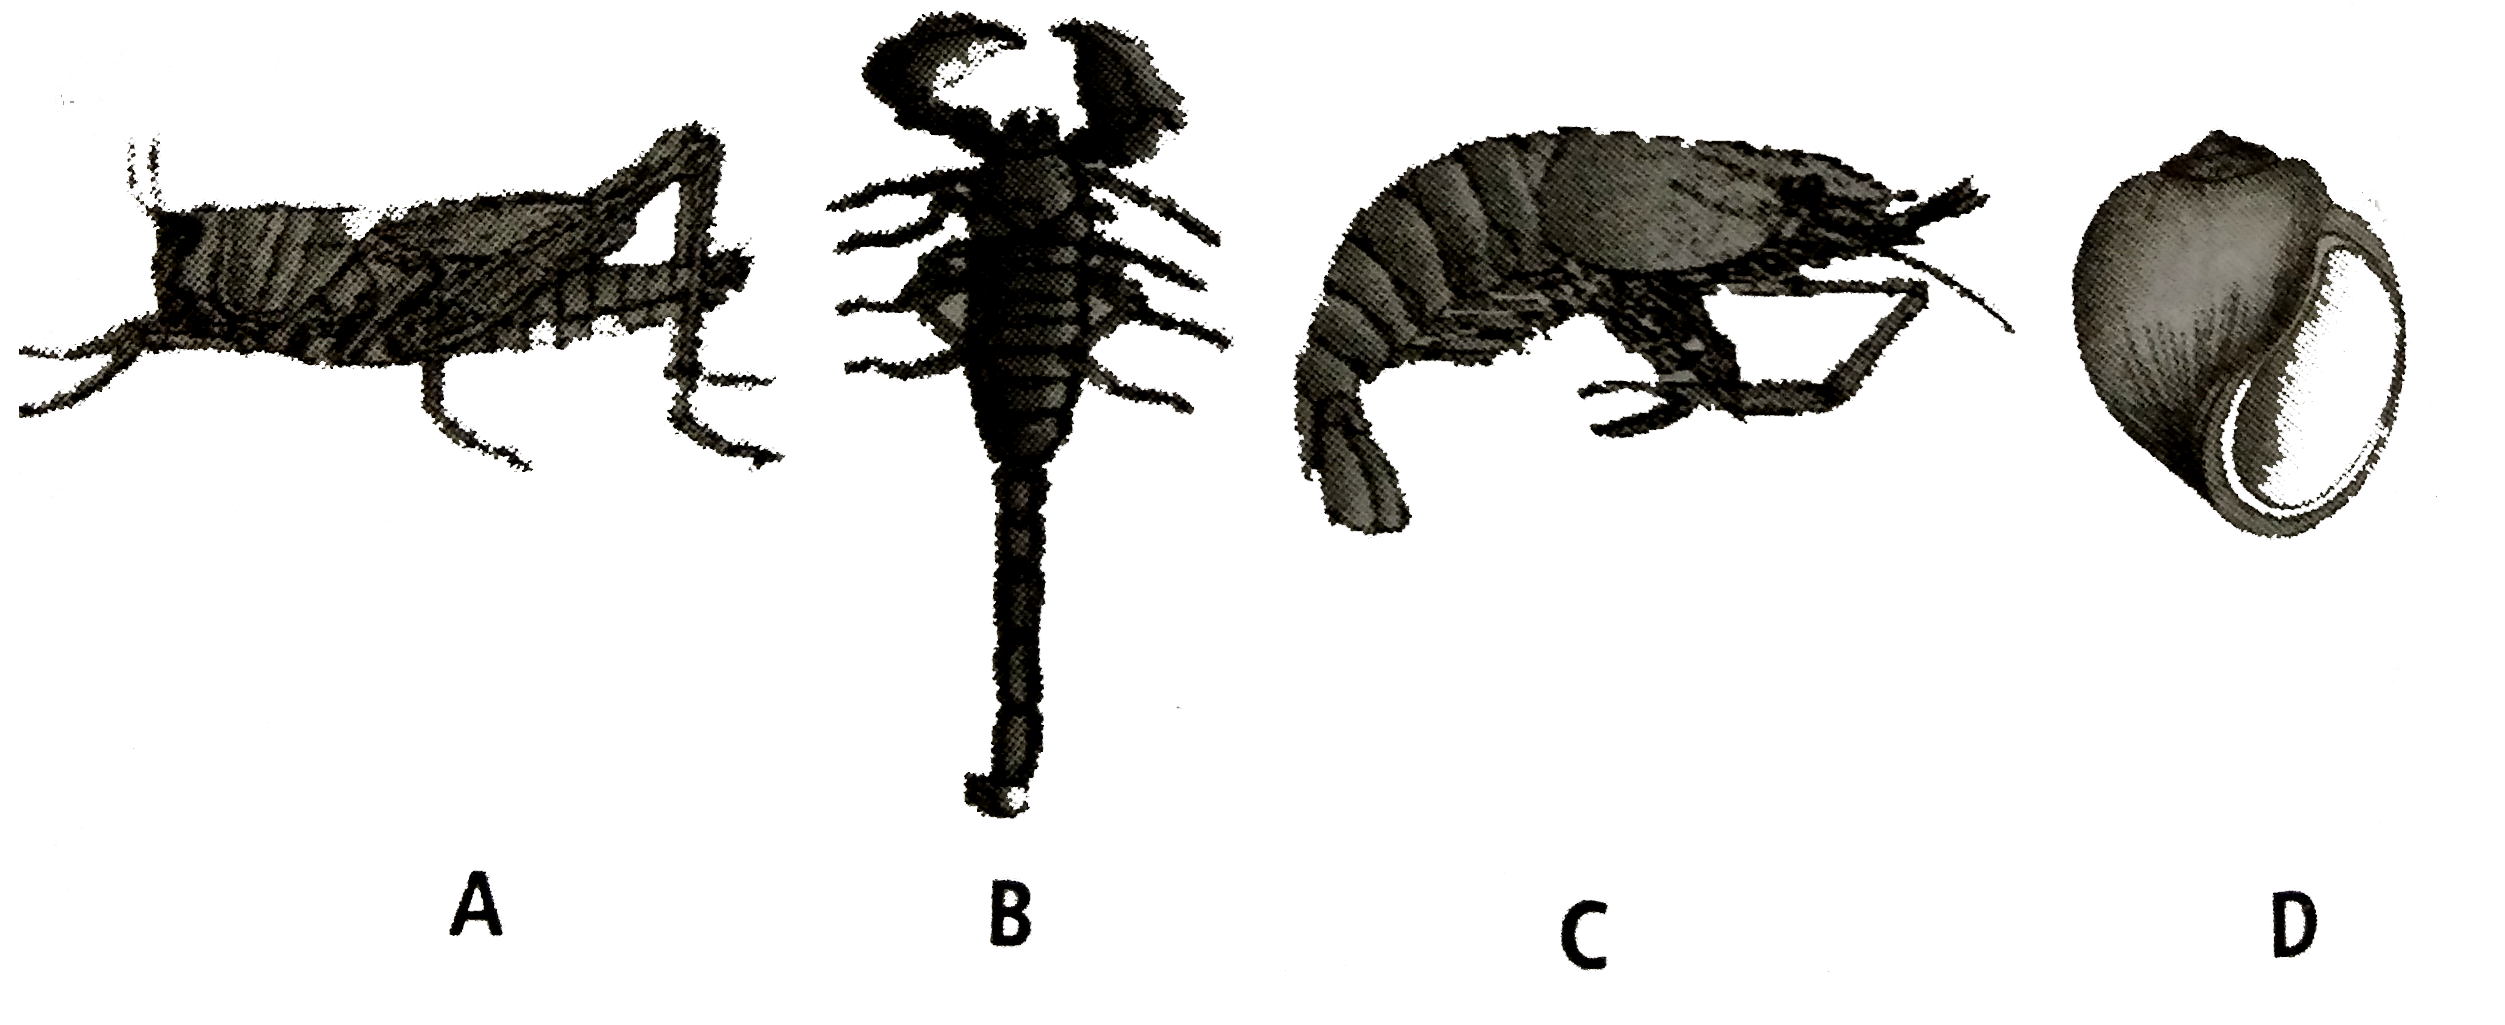
Identify the figures A, B ,C and D given below and select the correct option.
 View Solution


