The graphical representation to calculate the probability of all possible genotypes of offspring in a genetic cross is called a) Pedigree analysis b) Karyotype c) Punnett square d) Chromosome map
Pedigree analysis
Karyotype
Punnett square
Chromosome map
The correct Answer is:C
To solve the question, "The graphical representation to calculate the probability of all possible genotypes of offspring in a genetic cross is called," we will analyze the options provided and identify the correct answer step by step.
1. Understanding the Question: The question asks for a graphical representation used to calculate the probabilities of genotypes in offspring resulting from a genetic cross.
2. Analyzing the Options:
- a) Pedigree analysis: This is a diagram that shows the occurrence of a genetic trait across generations in a family. It does not calculate probabilities of offspring genotypes.
- b) Karyotype: This is a visual representation of an individual's chromosomes, used to diagnose chromosomal abnormalities. It does not relate to calculating genotype probabilities.
- c) Punnett square: This is a diagram that predicts the genotypes of offspring from a genetic cross by combining the gametes of the parents. It is specifically designed for this purpose.
- d) Chromosome map: This represents the arrangement of genes on chromosomes but does not calculate probabilities of offspring genotypes.
3. Identifying the Correct Answer: Based on the analysis, the only option that fits the description of a graphical representation used to calculate the probability of all possible genotypes of offspring is c) Punnett square.
4. Conclusion: Therefore, the correct answer is c) Punnett square.
- a) Pedigree analysis: This is a diagram that shows the occurrence of a genetic trait across generations in a family. It does not calculate probabilities of offspring genotypes.
- b) Karyotype: This is a visual representation of an individual's chromosomes, used to diagnose chromosomal abnormalities. It does not relate to calculating genotype probabilities.
- c) Punnett square: This is a diagram that predicts the genotypes of offspring from a genetic cross by combining the gametes of the parents. It is specifically designed for this purpose.
- d) Chromosome map: This represents the arrangement of genes on chromosomes but does not calculate probabilities of offspring genotypes.
Topper's Solved these Questions
- BOOK - ICSECHAPTER - PRINCIPLES OF INHERITANCE AND VARIATIONEXERCISE - COMPETITION CORNER (OBJECTIVE TYPE QUESTIONS (ASSERTION AND REASON TYPE QUESTIONS))20videos
PRINCIPLES OF INHERITANCE AND VARIATION
- BOOK - ICSECHAPTER - PRINCIPLES OF INHERITANCE AND VARIATIONEXERCISE - MULTIPLE CHOICE QUESTION98videos
PRINCIPLES OF INHERITANCE AND VARIATION
- BOOK - ICSECHAPTER - PRINCIPLES OF INHERITANCE AND VARIATIONEXERCISE - REVIEW QUESTIONS19videos
PRINCIPLES OF INHERITANCE AND VARIATION
- BOOK - ICSECHAPTER - ORGANISMS AND POPULATIONSEXERCISE - COMPETITION CORNER (ASSERTION AND REASON TYPE QUESTIONS)22videos
ORGANISMS AND POPULATIONS
- BOOK - ICSECHAPTER - QUESTION PAPER 2022 TERM 1EXERCISE - MULTIPLE CHOICE QUESTIONS45videos
QUESTION PAPER 2022 TERM 1
Similar Questions
Assertion :- Punnett sequare is a graphical representation to calculate the probability of all possible genotypes of offsprings in a genetic cross.
Reason :- It was developed by a British geneticist, Raginald C. Punnett.View SolutionSelect the option with correct set of statements for Punnett square. (a) Developed by a British geneticist. (b) Used to calculate the probability of genotypes of offsprings. (c) Useful for monohybrid crosses only. (d) It is a mathematical formula which helps to calculate the types of gametes.
View SolutionSelect the option with correct set of statements for Punnett square. (1) Developed by British geneticist. (2)Used to calculate the probability of genotypes offsprings. (3)Useful for monohybrid crosses only. (4) It is a mathematical formula which helps to calculate the types of gametes.
View SolutionWhat will be the probability of genotype TTrr in F2 generation of a typical Mendelian dihybrid cross ?
(a) 1/16
(b) 3/16
(c) 9/16
(d) 6/16View SolutionComplete haploid set of chromosomes of a species is
(a) Genome
(b) Genotype
(c) Genetic code
(d) AlleleView SolutionMedel proposed something was being stably passed down unchanged from parents to offspring called
(a) Genes
(b) Genotype
(c) Factors
(d) AllelesView SolutionBritish geneticist R.C. Punnett developed a graphical representation of gentic cross called "Punnett Square". Mention the possible result this representation predicts of the genetic cross carried.
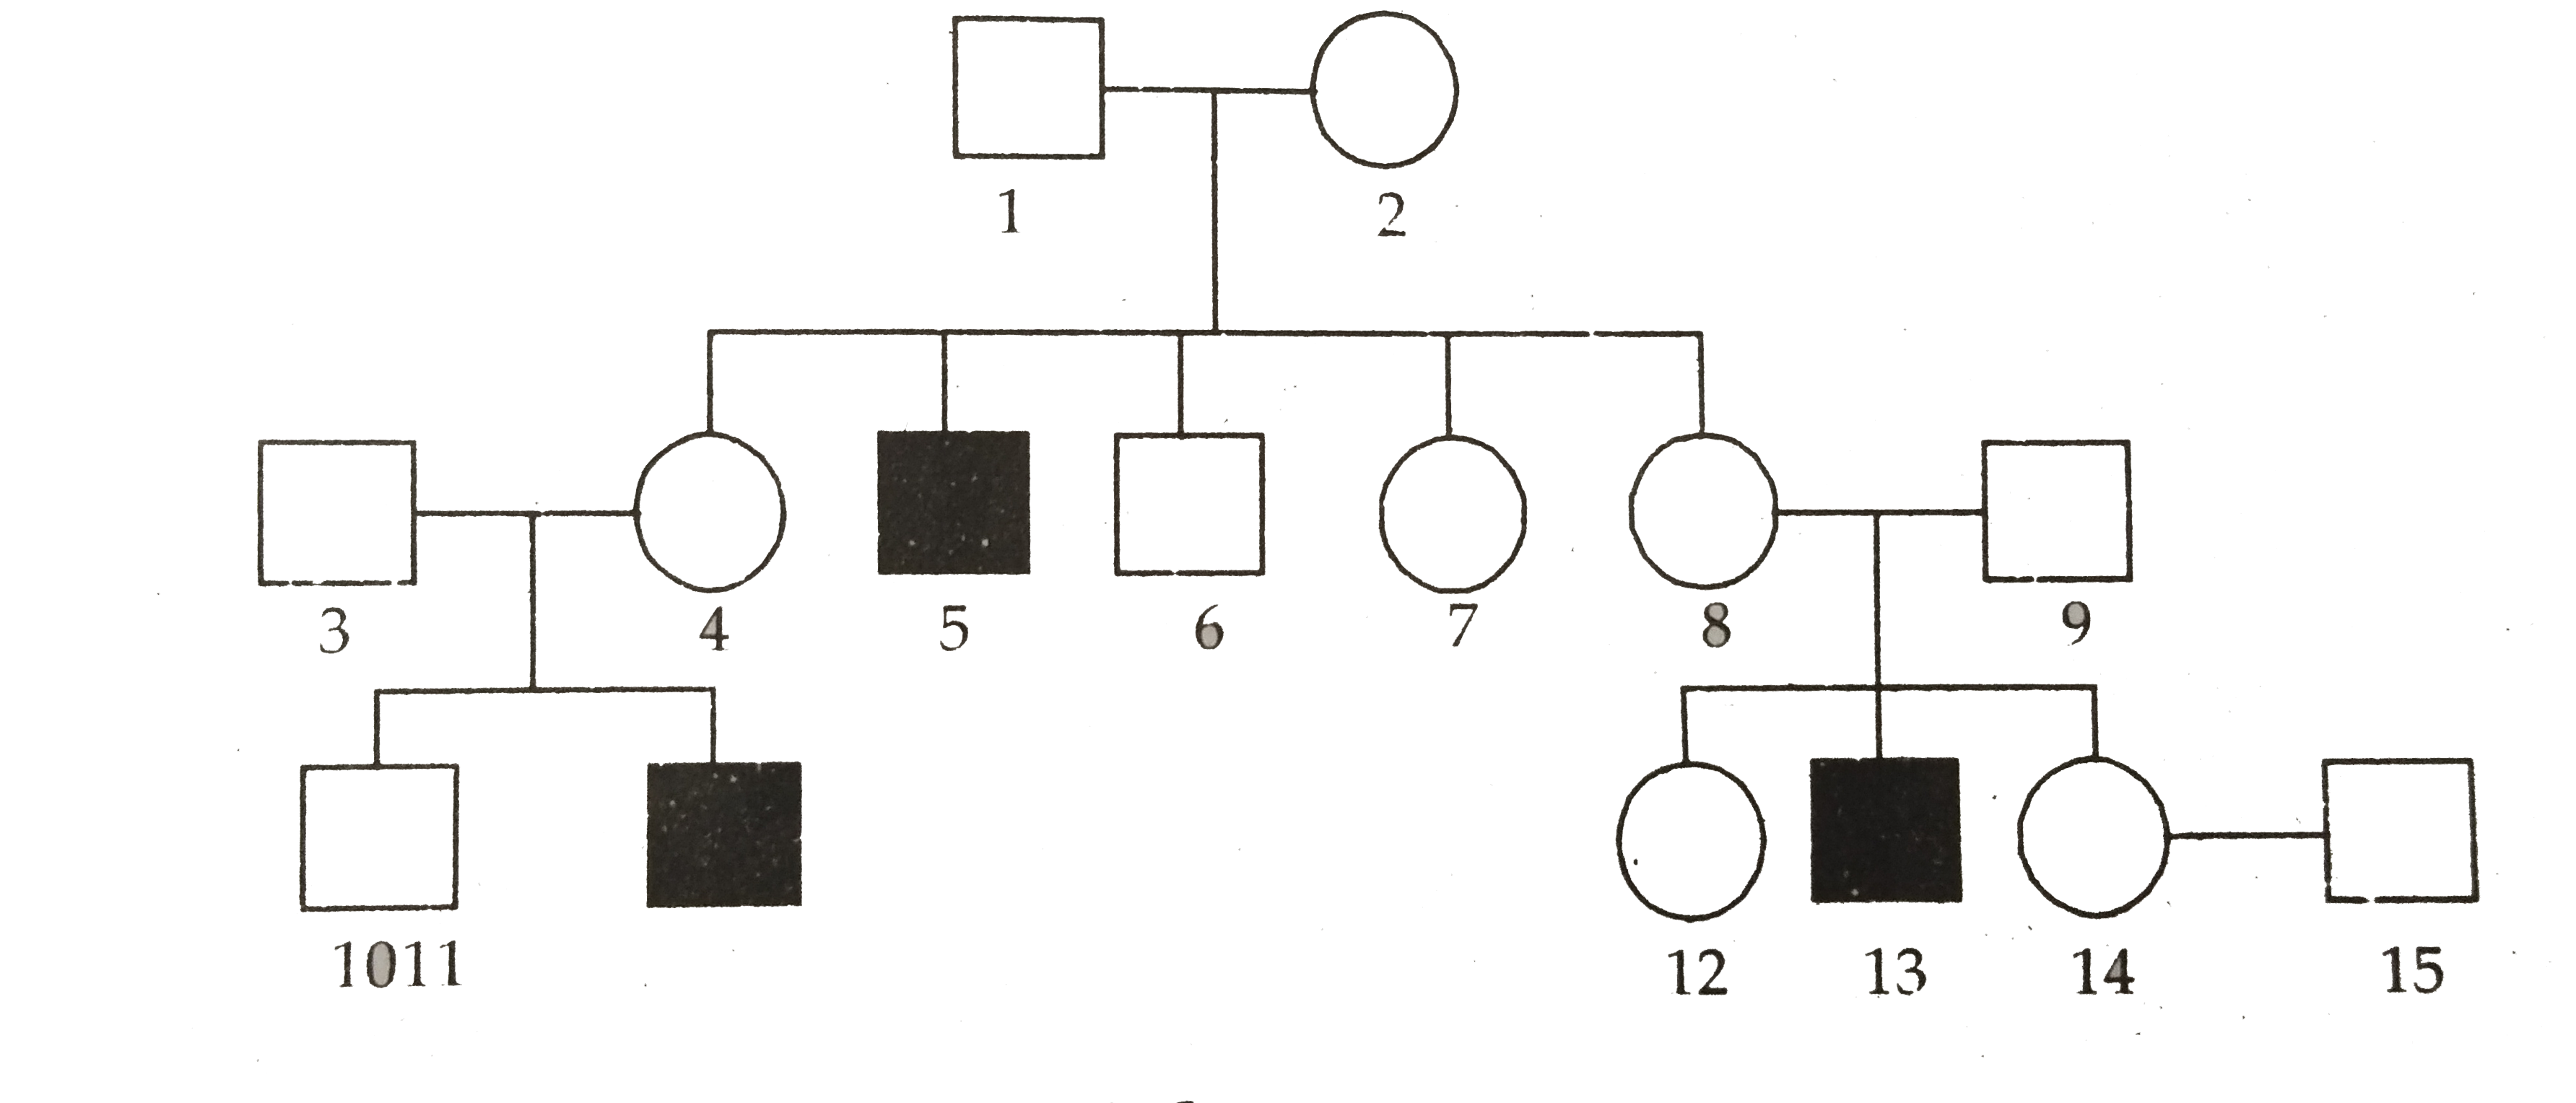
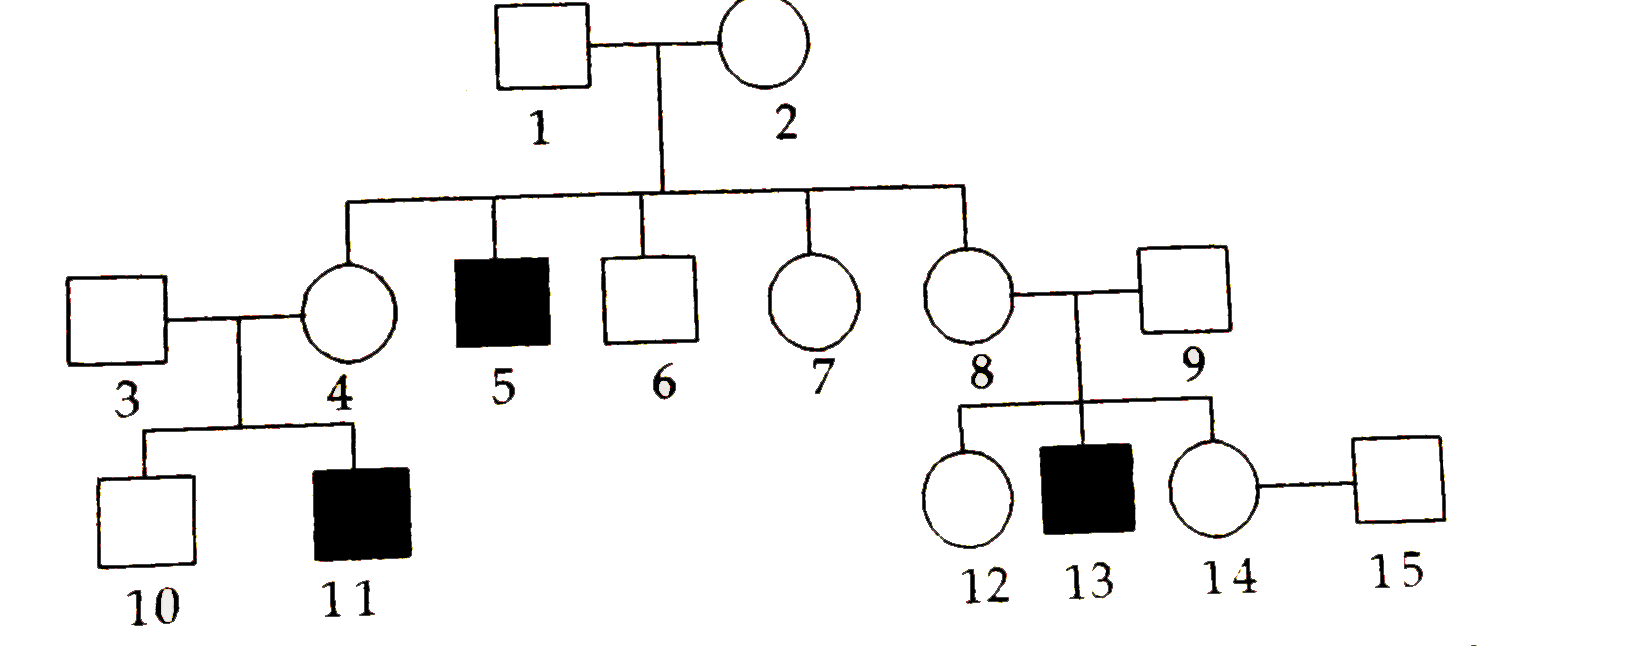
View SolutionHaemophilia is a sex linked recessive disorder of humans. The pedigree chart given below shows the inheritance of haemophilia in one family. Study the pattern of inheritance and answer the questions given

Give all the possible genotypes of the members 4,5 and 6 in the pedigree chart.
(b) A blood test shows that the individual 14 is a carrier of haemophilia. The member numbered 15 has recently married the member numbered 14. What is the probability that their first child will be a haemophilic male? Show with the help of Punnett square.View SolutionHaemophilia is a sex linked recessive disorder of humans. The pedigree chart given below shows the inheritance of Haemophilia in one family. Study the pattern of inheritance and answer the questions given.

(a) Give all the possible genotypes of the members 4, 5 and 6 in the pedigree chart.
(b) A blood test shows that the individual 14 is a carrier of gaemophilia. The member numbered 15 has recently married the member numbered 14. What is the probability that their first child will be a haemophilic male ? Show with the help of Punnett square.View SolutionGiven below are assertion and reason. Point out if both are true with reason being correct explanation (A), both are true but reason is not correct explanation (B), assertion is true but reason is wrong ( C) and both are wrong (D).
Assertion. In a pedigree analysis,a circle represents unaffected offspring.
Reason. In the pedigree analysis, the offspring are numbered with arabic numerals (1,2,3...) and generation is numbered with roman numeralsView Solution

