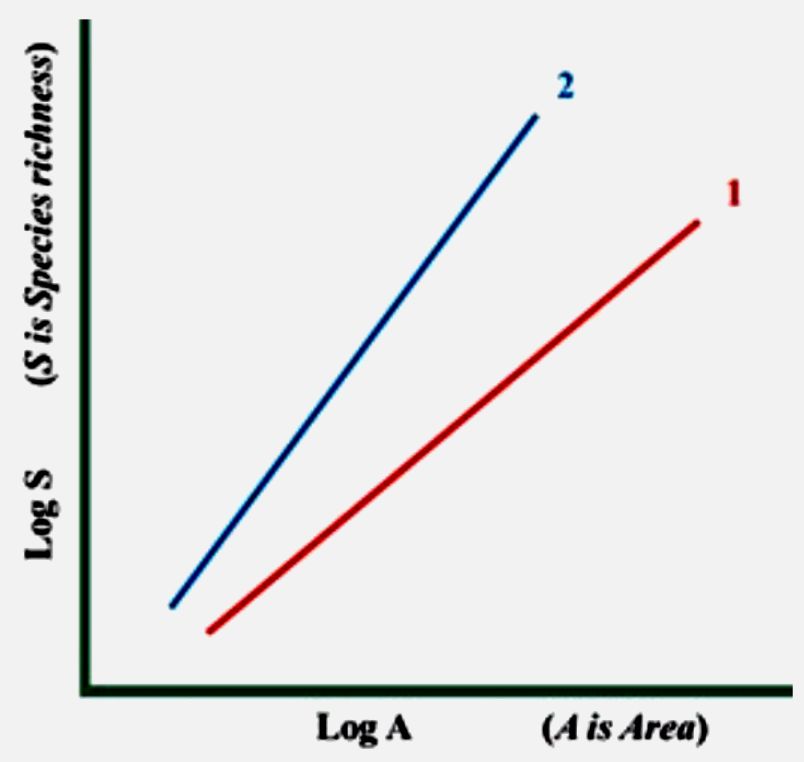
Value of Z (regression coefficient) is considered for measuring the species richness of an area. If the value of Z is 0.7 for area A ,and 0.15 for area B, which area has higher species richness and a steeper slope?
To determine which area has higher species richness and a steeper slope based on the given regression coefficients (Z values), we can follow these steps:
1. Understand the Concept of Z:
- Z, known as the regression coefficient, is a parameter that measures species richness in a given area. A higher Z value indicates a steeper slope in the species-area relationship, suggesting greater species richness.
2. Identify the Z Values:
- For Area A, Z = 0.7
- For Area B, Z = 0.15
3. Compare the Z Values:
- Area A has a Z value of 0.7, while Area B has a Z value of 0.15.
4. Determine Species Richness:
- Since a higher Z value indicates greater species richness, Area A, with Z = 0.7, has higher species richness compared to Area B, which has Z = 0.15.
5. Assess the Steepness of the Slope:
- The slope of the species-area relationship is directly related to the Z value. A higher Z value means a steeper slope. Therefore, Area A, with Z = 0.7, has a steeper slope than Area B, with Z = 0.15.
Conclusion:
- Area A has higher species richness and a steeper slope compared to Area B.
- Z, known as the regression coefficient, is a parameter that measures species richness in a given area. A higher Z value indicates a steeper slope in the species-area relationship, suggesting greater species richness.
- For Area A, Z = 0.7
- For Area B, Z = 0.15
- Area A has a Z value of 0.7, while Area B has a Z value of 0.15.
- Since a higher Z value indicates greater species richness, Area A, with Z = 0.7, has higher species richness compared to Area B, which has Z = 0.15.
- The slope of the species-area relationship is directly related to the Z value. A higher Z value means a steeper slope. Therefore, Area A, with Z = 0.7, has a steeper slope than Area B, with Z = 0.15.
- Area A has higher species richness and a steeper slope compared to Area B.
Topper's Solved these Questions
- SAMPLE PAPER 2022 TERM IIBOOK - CBSE MODEL PAPERCHAPTER - SAMPLE PAPER 2022 TERM IIEXERCISE - SECTION C
2 Videos
- SAMPLE PAPER 2022 TERM IIBOOK - CBSE MODEL PAPERCHAPTER - SAMPLE PAPER 2022 TERM IIEXERCISE - SECTION C
2 Videos
- SAMPLE PAPER 2022BOOK - CBSE MODEL PAPERCHAPTER - SAMPLE PAPER 2022EXERCISE - Questions in lieu of diagram based questions for VI candidates (Section - C)
11 Videos
- SAMPLE PAPER 2023 TERM IBOOK - CBSE MODEL PAPERCHAPTER - SAMPLE PAPER 2023 TERM IEXERCISE - SECTION - E
13 Videos
Similar Questions
If z,izandz+iz are the vertices of a triangle whose area is 2units, the value of |z|is
View Solution
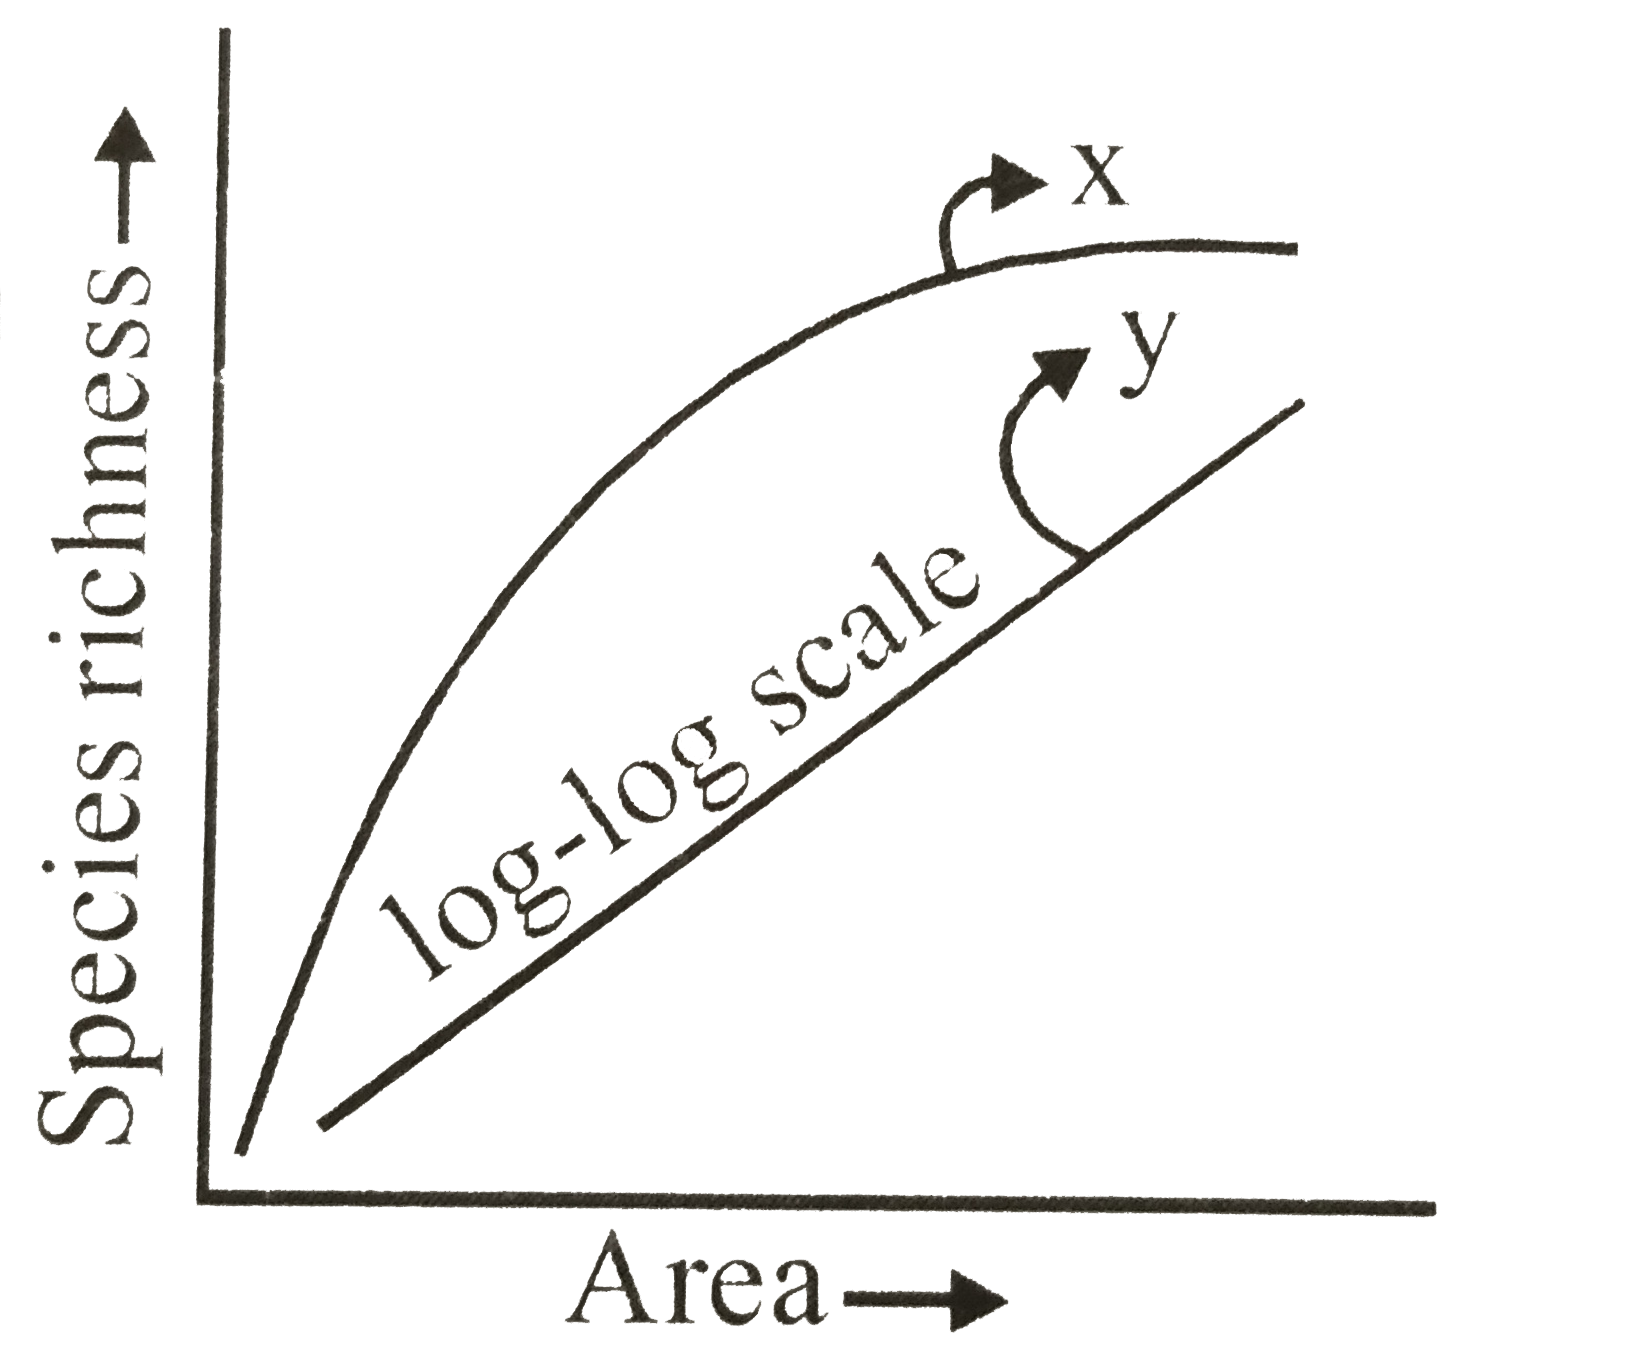
Study the above graph and answer the following questions -
(i) Identify x and y
(ii) The relation between species richness and area can be denoted as generally
(iii) The value of z lies in range of
(iv) On a log scale the relation between species richness and area is
View Solution
Knowledge Check
The relation between species richness and area is correctly depicted by
ALogS=logC−ZlogABLogS=ZlogACLogS=logC+ZlogADLogS=logCA graph of species richness vs area on log-log axes is
AlinearBsigmoidalCoscillatoryDparabolicWhich of the following species are restricted to an area??
ASibling speciesBEndemic speciesCAllopathic speciesDsympatric species
The relation between species richness and area for a wide variety of taxa turns out to be a rectangular hyperbola. Give a brief explanation.
View SolutionObserve the graph of area versus species richness and select the options that explain lines 1 and 2.

View SolutionThe relation between species richness and area for a wide variety of taxa (angiosperm plants, birds, bats, freshwater fishes) is a
View SolutionThe value of Z , the slope of the line ( regression coefficient ) is …..... for mammals in the tropical forest of different continents.
View SolutionThe graph formed by plotting species richness against area for a wide variety of taxa (angiosperm plants, birds , bats , fresh water fishes , etc) turns out to be a
View Solution
