When pH or temperature is plotted against enzyme activity the shape of curve obtained is
A parabola
A bell shaped curve
A rectangular hyperbola
A sigmoid curve
The correct Answer is:B
To solve the question about the shape of the curve obtained when pH or temperature is plotted against enzyme activity, we can follow these steps:
1. Understanding Enzyme Activity: Enzymes are biological catalysts that speed up chemical reactions in the body. Their activity can be influenced by various factors, including pH and temperature.
2. Effect of pH on Enzyme Activity: Each enzyme has an optimal pH at which it functions best. Deviations from this optimal pH can lead to a decrease in enzyme activity.
3. Effect of Temperature on Enzyme Activity: Similarly, enzymes have an optimal temperature range. Below or above this range, the activity of the enzyme decreases, often leading to denaturation at high temperatures.
4. Graphing the Relationship: When we plot enzyme activity against pH or temperature, we observe that the activity increases to a maximum point and then decreases. This results in a curve that resembles a bell shape.
5. Identifying the Curve Shape: The curve obtained from this relationship is typically described as a bell-shaped curve, which looks like an inverted U. This indicates that there is an optimal pH or temperature for enzyme activity.
6. Conclusion: Therefore, when pH or temperature is plotted against enzyme activity, the shape of the curve obtained is a bell-shaped curve.
Final Answer:
The shape of the curve obtained when pH or temperature is plotted against enzyme activity is a bell-shaped curve.
---
The shape of the curve obtained when pH or temperature is plotted against enzyme activity is a bell-shaped curve.
Topper's Solved these Questions
- BIOMOLECULESBOOK - AAKASH SERIESCHAPTER - BIOMOLECULESEXERCISE - EXERCISE - I (Enzymes -Introduction)
13 Videos
- BIOMOLECULESBOOK - AAKASH SERIESCHAPTER - BIOMOLECULESEXERCISE - EXERCISE - I (Chemical reactions)
4 Videos
- BIOLOGICAL CLASSIFICATIONBOOK - AAKASH SERIESCHAPTER - BIOLOGICAL CLASSIFICATIONEXERCISE - EXERCISE-III (Previous AIPMT/NEET Question)
37 Videos
- CELL CYCLE AND CELL DIVISIONBOOK - AAKASH SERIESCHAPTER - CELL CYCLE AND CELL DIVISIONEXERCISE - Exercise-III
18 Videos
Similar Questions
What is the influence of temperature on enzyme activity?
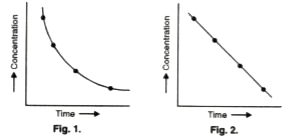
View SolutionIn the reaction A→ B , if the concentration of A is plotted against time, the curves obtained will be as shown in Fig. 1 and 2. Predict the order of the reactions.

View SolutionIn the reaction A→ B , if the concentration of A is plotted against time, the curves obtained will be as shown in Fig. 1 and 2. Predict the order of the reactions.

View SolutionIn the reaction A→ B , if the concentration of A is plotted against time, the curves obtained will be as shown in Fig. 1 and 2. Predict the order of the reactions.

View SolutionThe growth curve of bacterial population is lab is plotted against time. What will be the shape of graph ?
View SolutionWhen the product of pressure and volume is plotted against pressure for a given amount of gas, the line obtained is
View SolutionSemilog of per minutes growing bacteria is plotted against time. What will be shape of graph?
View SolutionWhen the temperature is increased then enzyme substrate reaction
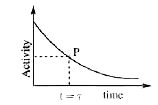
View SolutionThe activity of a certain radioactive sample is plotted against time in graph. If the initial slope of the curve is m, then find the slope of the curve at point P ?

View SolutionWhat are optimum temperature and pH for the enzymes to act best ?
View Solution
