A graph between vapour pressure and temperature of few liquids is given below . Study the graph and answer the following :
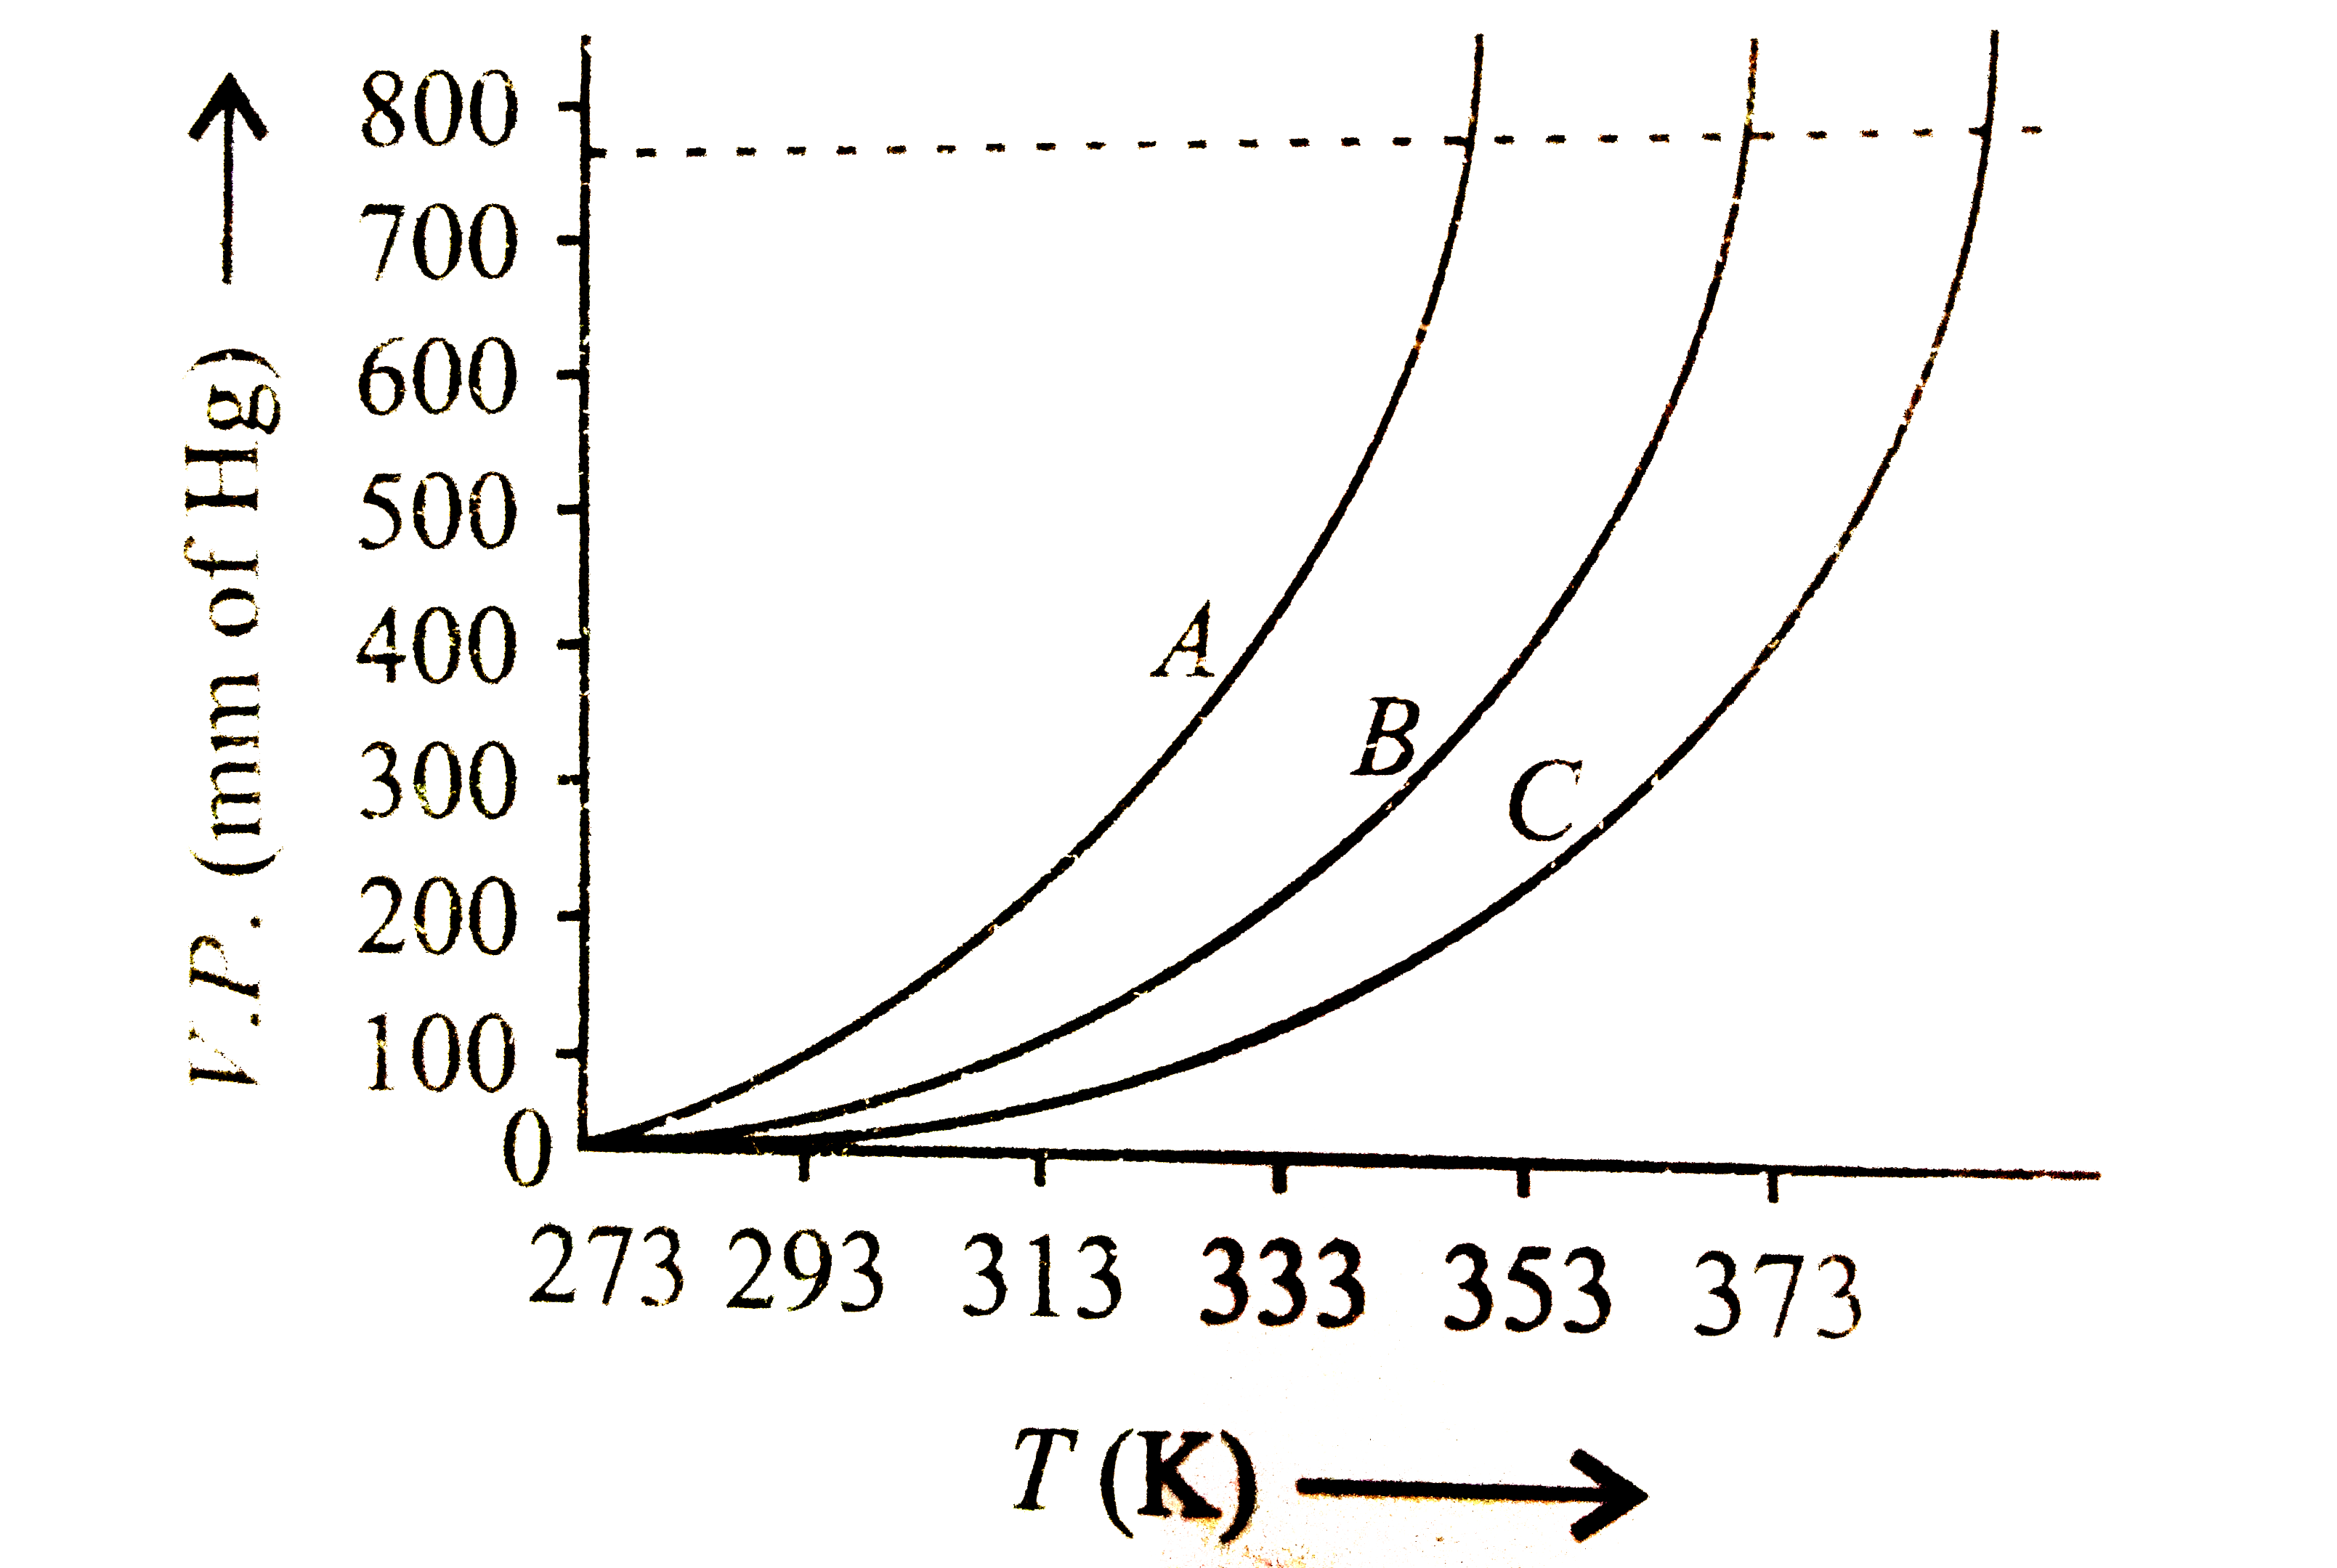
Which of the following statements is true ?
Boiling point of a liquid is the temperature at which its vapour pressure become equal to atmospheric pressure .
Boiling point of water can be increased by increasing the pressure above the atmospheric pressure .
Liquid C has higher boiling point than B due to higher intermolecular forces .
All of the these .
The correct Answer is:D
Step by step video & image solution for A graph between vapour pressure and temperature of few liquids is given below . Study the graph and answer the following : Which of the following statements is true ? by Chemistry experts to help you in doubts & scoring excellent marks in Class 11 exams.
Topper's Solved these Questions
- BOOK - NCERT FINGERTPS ENGLISHCHAPTER - STATES OF MATTER EXERCISE - HOTS (HIGHER ORDER THINKING SKILLS)10videos
STATES OF MATTER
- BOOK - NCERT FINGERTPS ENGLISHCHAPTER - STATES OF MATTER EXERCISE - NCERT (EXEMPLAR PROBLEMS)11videos
STATES OF MATTER
- BOOK - NCERT FINGERTPS ENGLISHCHAPTER - SOME BASIC CONCEPTS OF CHEMISTRY EXERCISE - NCERT Exemplar11videos
SOME BASIC CONCEPTS OF CHEMISTRY
- BOOK - NCERT FINGERTPS ENGLISHCHAPTER - STRUCTURE OF ATOM EXERCISE - Assertion And Reason15videos
STRUCTURE OF ATOM
Similar Questions
Knowledge Check
- Question 1 - Select One
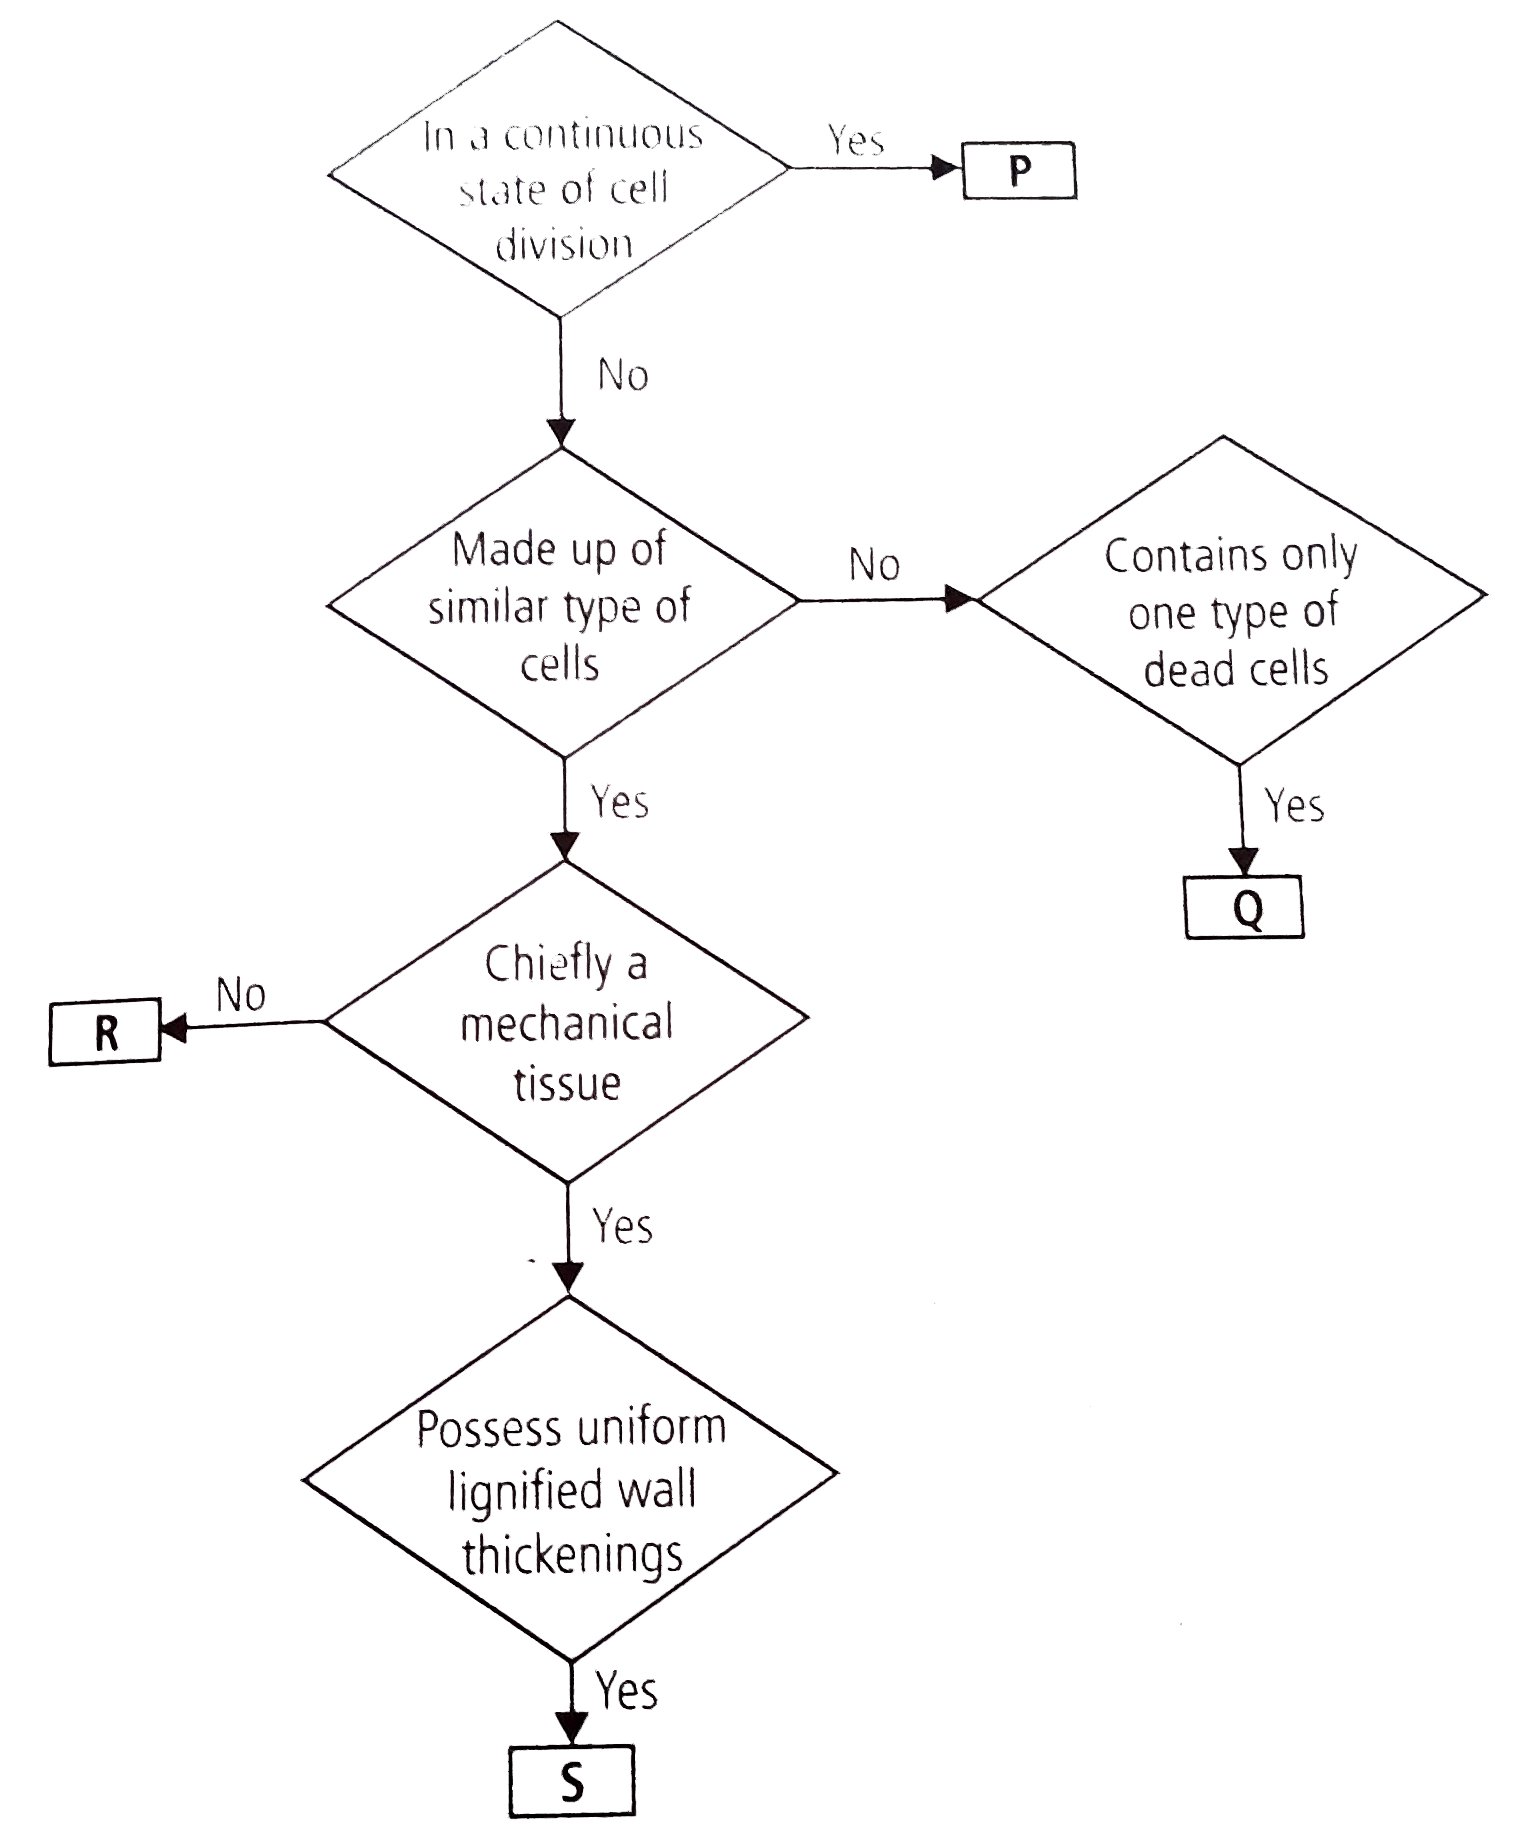
Study the flow chart given below:
Which of the following statements is incorrect regarding this?AP can be root apical meristemwhich is generally sub-terminal in position.BQ can bephloem which is also called bast.CR can be parenchyma which comprises of thin walled isodiametric cells.DS can becollenchyma which is a living mechanical - Question 2 - Select One
Study the table given below and answer the following questions :

Which is the hottest month?AJuneBMayCJulyDApril
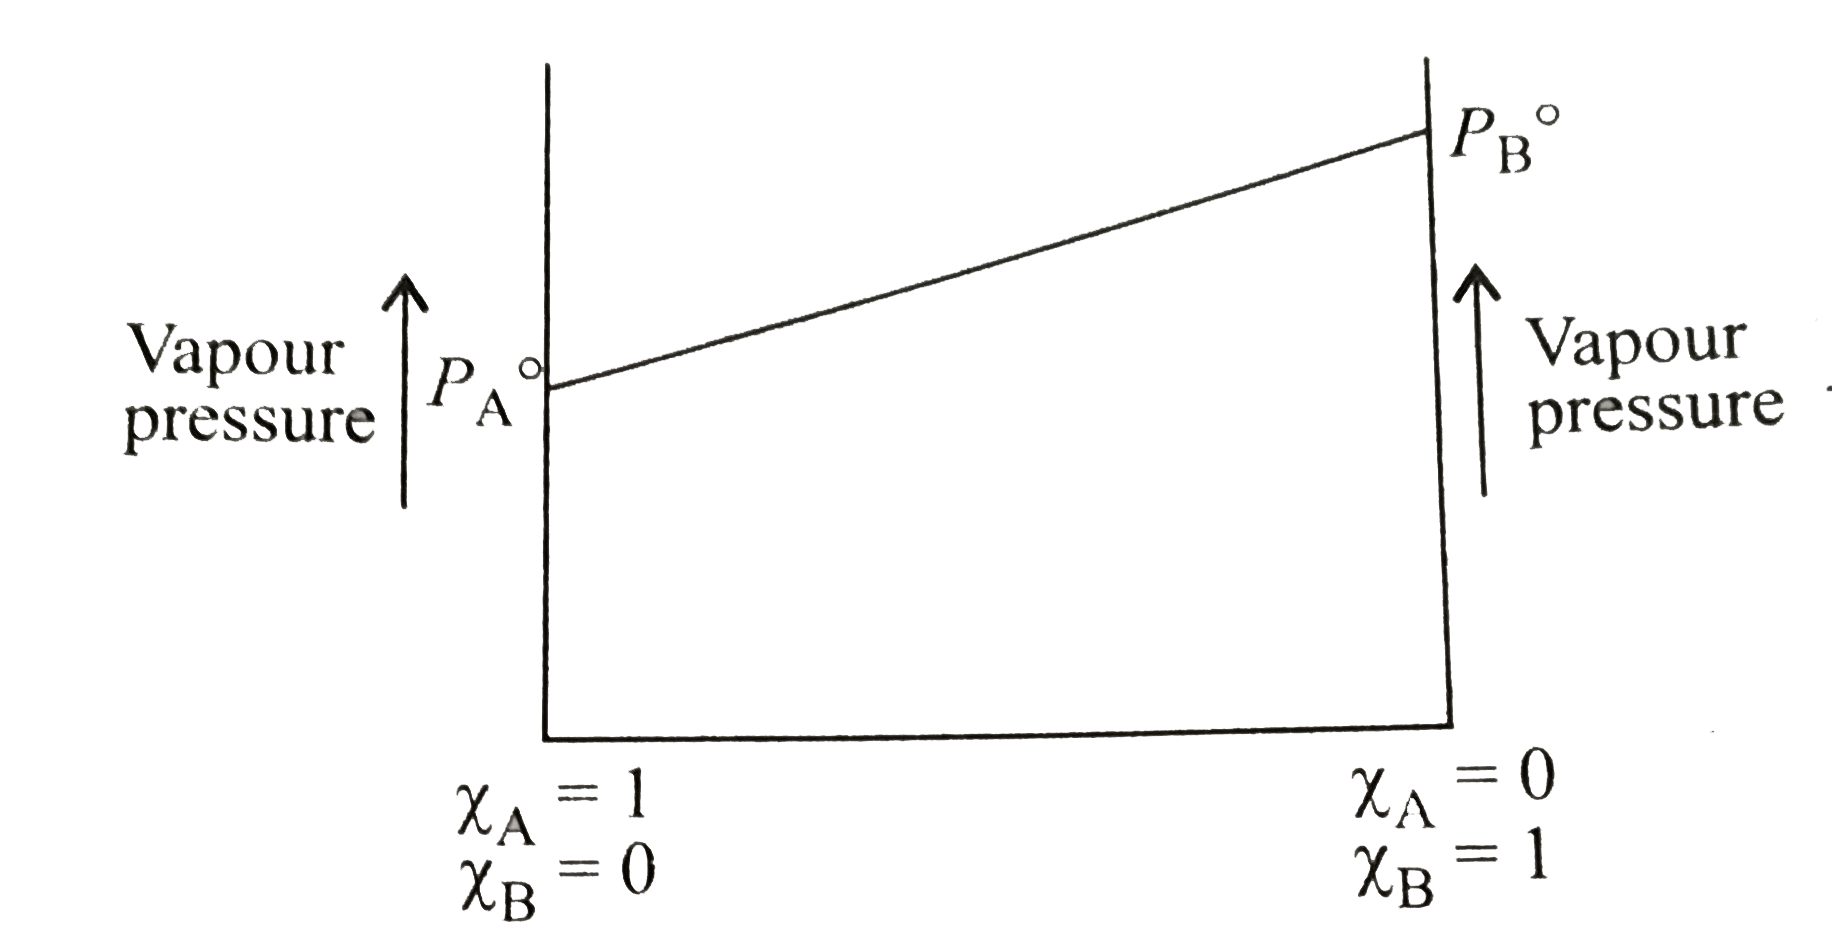
The following is a graph plotted between the vapour pressure of two volatile liquids against their respective mole fractions. Which of the following statements is/are correct?
 View Solution
Which of the following statements is true for the reaction given below?
 View Solution
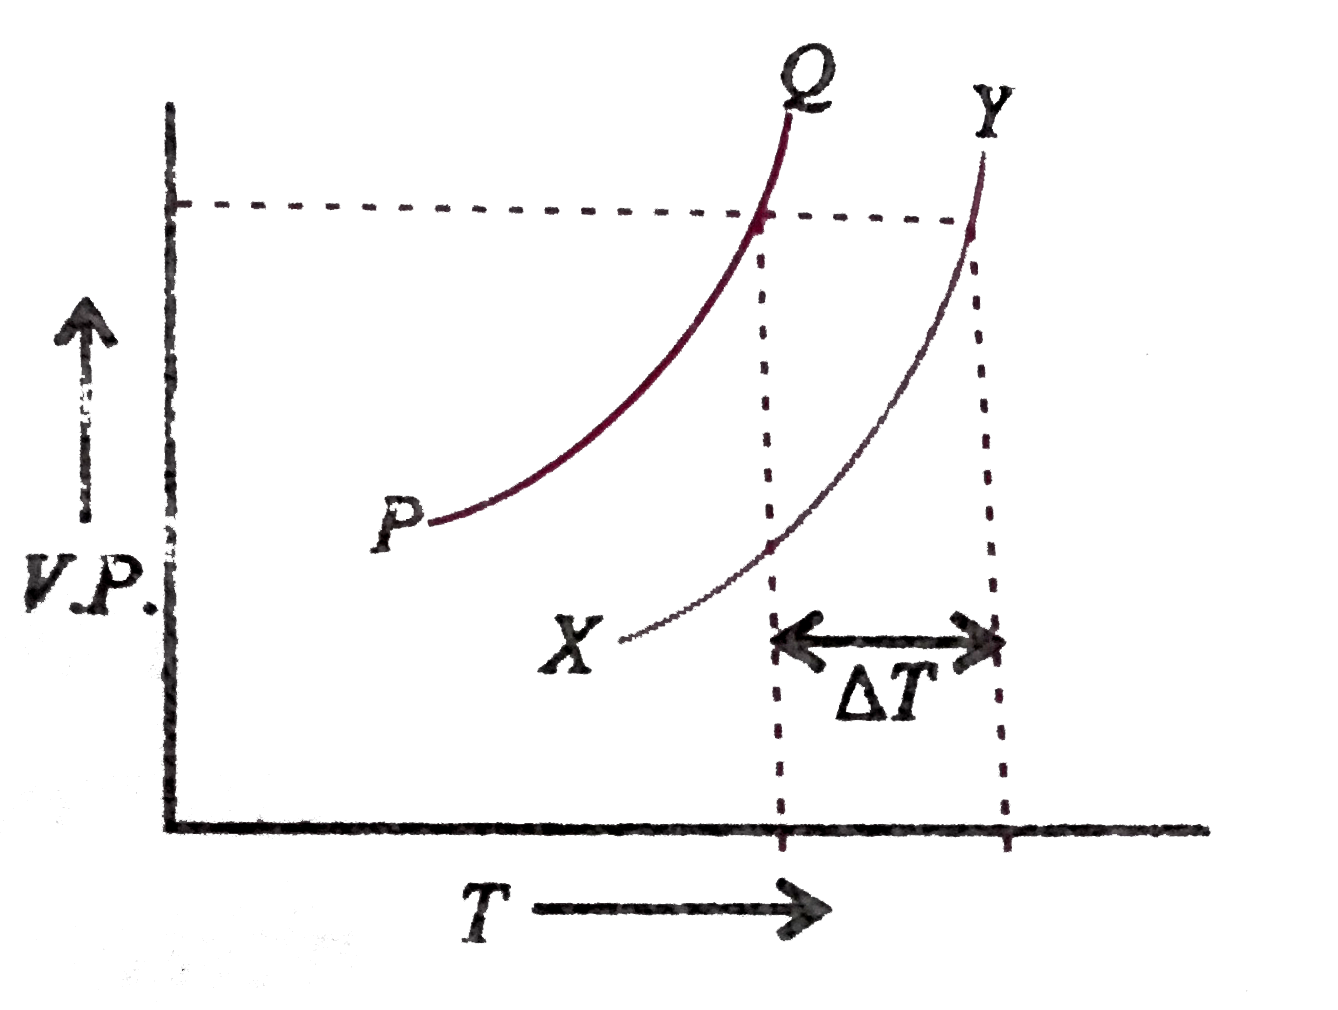
In the graph plotted between vapour pressure (V.P.) and temperature (T),
 View Solution
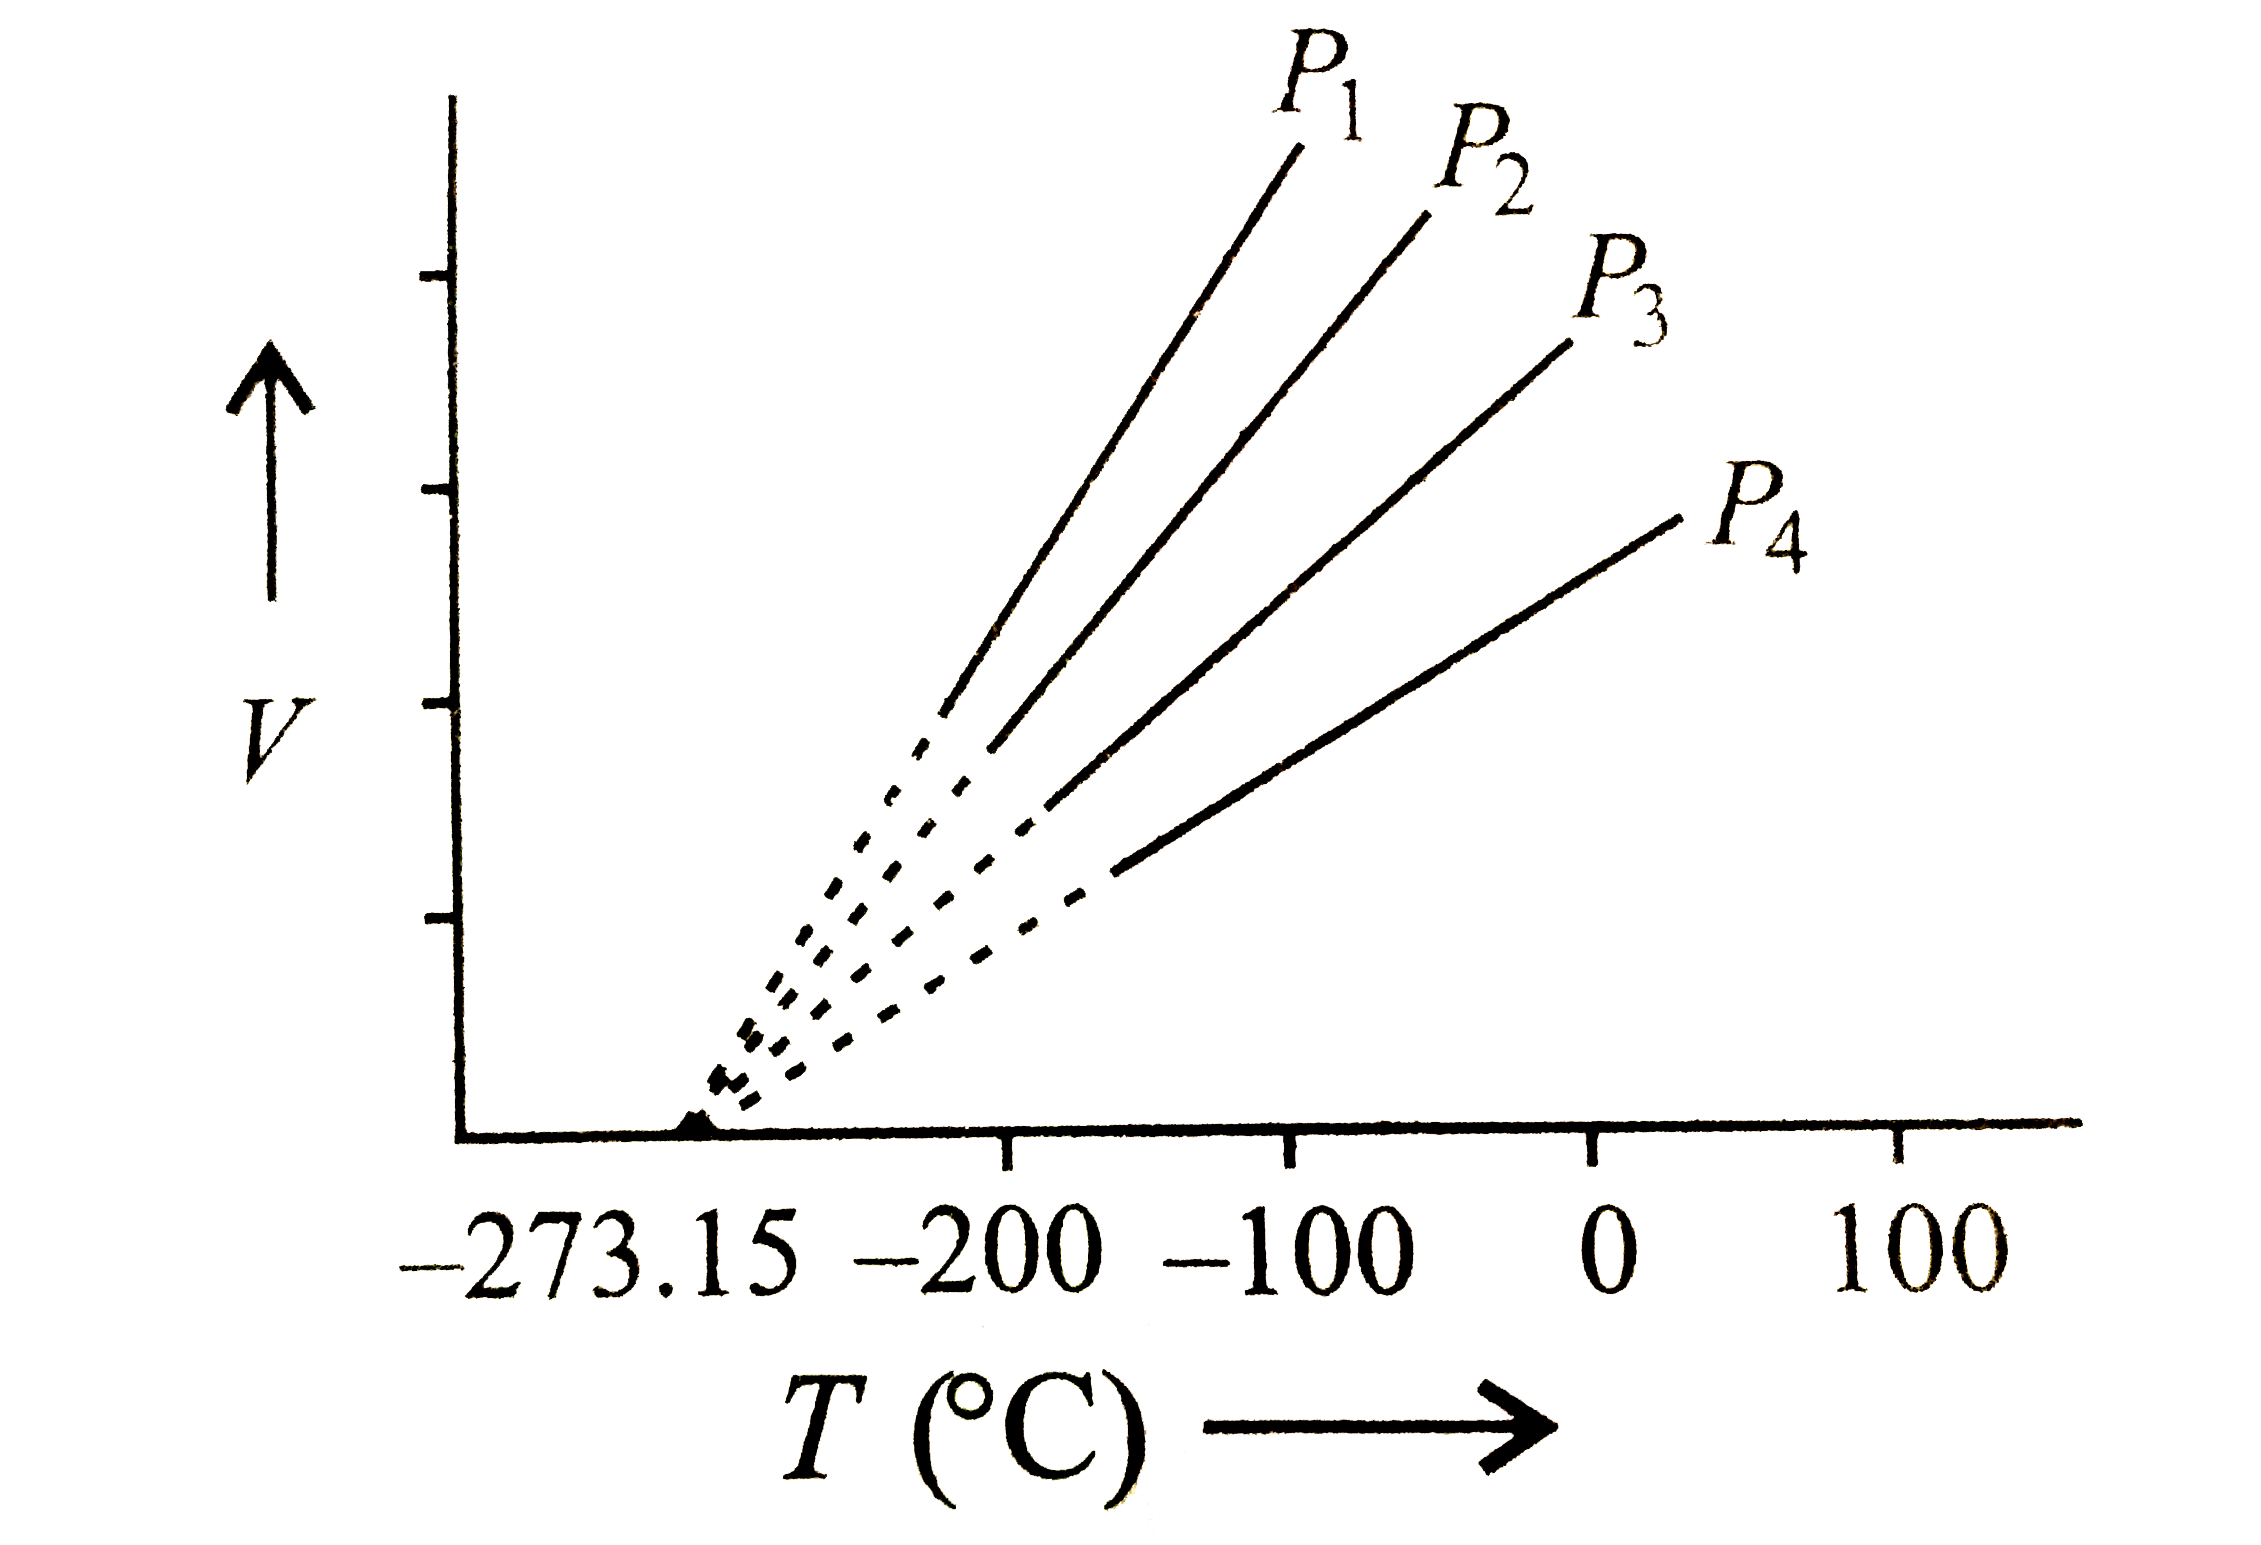
Study the following graph and mark the incorrect statement following it .
 View Solution
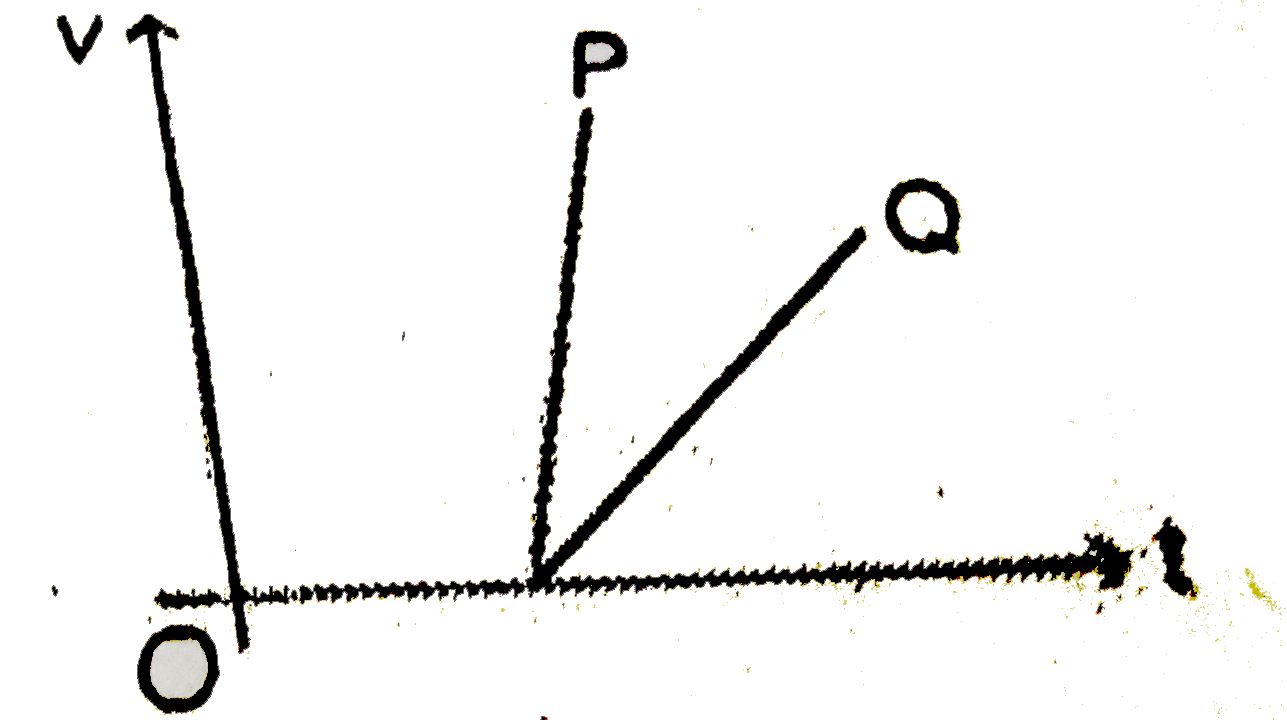
The v−t graph for two particles P and Q are given in the figure. Consider the following statements(s). Then, which of the following statement(s) is/are True:
 View Solution
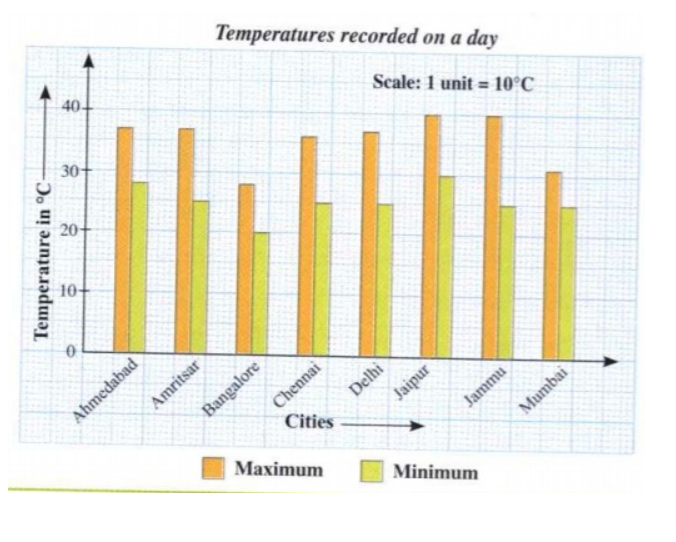
The following graph gives the minimum and maximum temperatures of various cities on a specific day. Read the graph and answer the following questions
Which are the hottest and the coldest cities on the given day?
 View Solution


