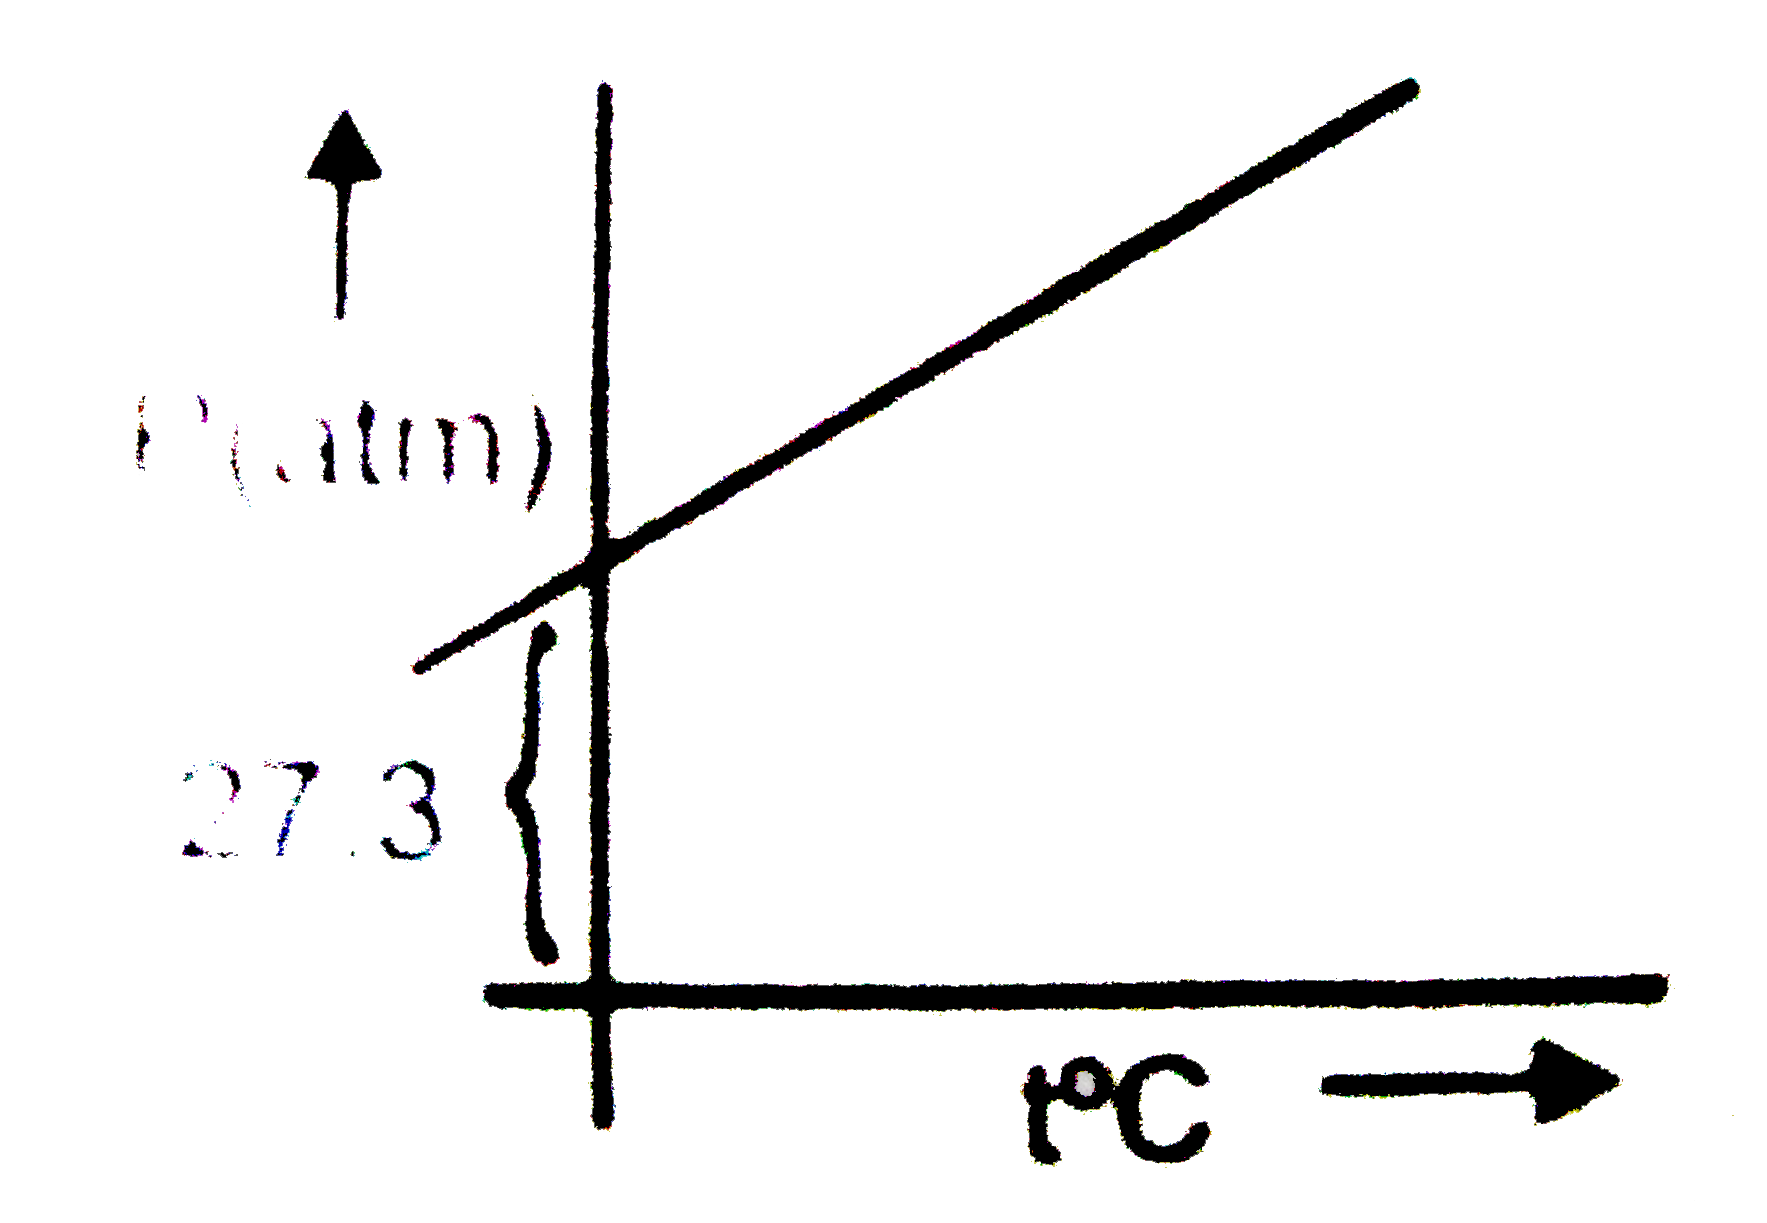
A graph is plotted between p (atm) vs t∘C for 10 mol of an ideal gas as follows:
Then slope of curve and volume of container (L) respectively, are:
 Solution in Telugu
0.1,8.21
8.21,0.1
27.3,8.21
8.21,27.3
The correct Answer is:a
Step by step video & image solution for A graph is plotted between p (atm) vs t^(@)C for 10 mol of an ideal gas as follows: Then slope of curve and volume of container (L) respectively, are: by Chemistry experts to help you in doubts & scoring excellent marks in Class 11 exams.
Updated on:21/07/2023Topper's Solved these Questions
- GASEOUS STATEBOOK - NARENDRA AWASTHICHAPTER - GASEOUS STATEEXERCISE - Level 3 - Passage
1 Videos
- GASEOUS STATEBOOK - NARENDRA AWASTHICHAPTER - GASEOUS STATEEXERCISE - Level 3 - Subjective Problems
1 Videos
- GASEOUS STATEBOOK - NARENDRA AWASTHICHAPTER - GASEOUS STATEEXERCISE - Level 1 (Q.151 To Q.176)
1 Videos
- ELECTROCHEMISTRYBOOK - NARENDRA AWASTHICHAPTER - ELECTROCHEMISTRYEXERCISE - Level 3 - Subjective Problems
1 Videos
- IONIC EEQUILIBRIUMBOOK - NARENDRA AWASTHICHAPTER - IONIC EEQUILIBRIUMEXERCISE - Assertin-Reason Type Questions
1 Videos
Similar Questions
Collision cross-section is an area of an imaginary sphere of radius σ around the molecule within which the centre of another molecule cannot penetrate.
The volume swept by a single molecule in unit time is

V=(πσ2)¯u where ¯u is the average speed
If N∗ is the number of molecules per unit volume, then the number of molecules within the volume V is
N=VN∗=(πσ2¯u)N∗
Hence, the number of collision made by a single molecule in unit time will be
Z=N=(πσ2¯u)N∗
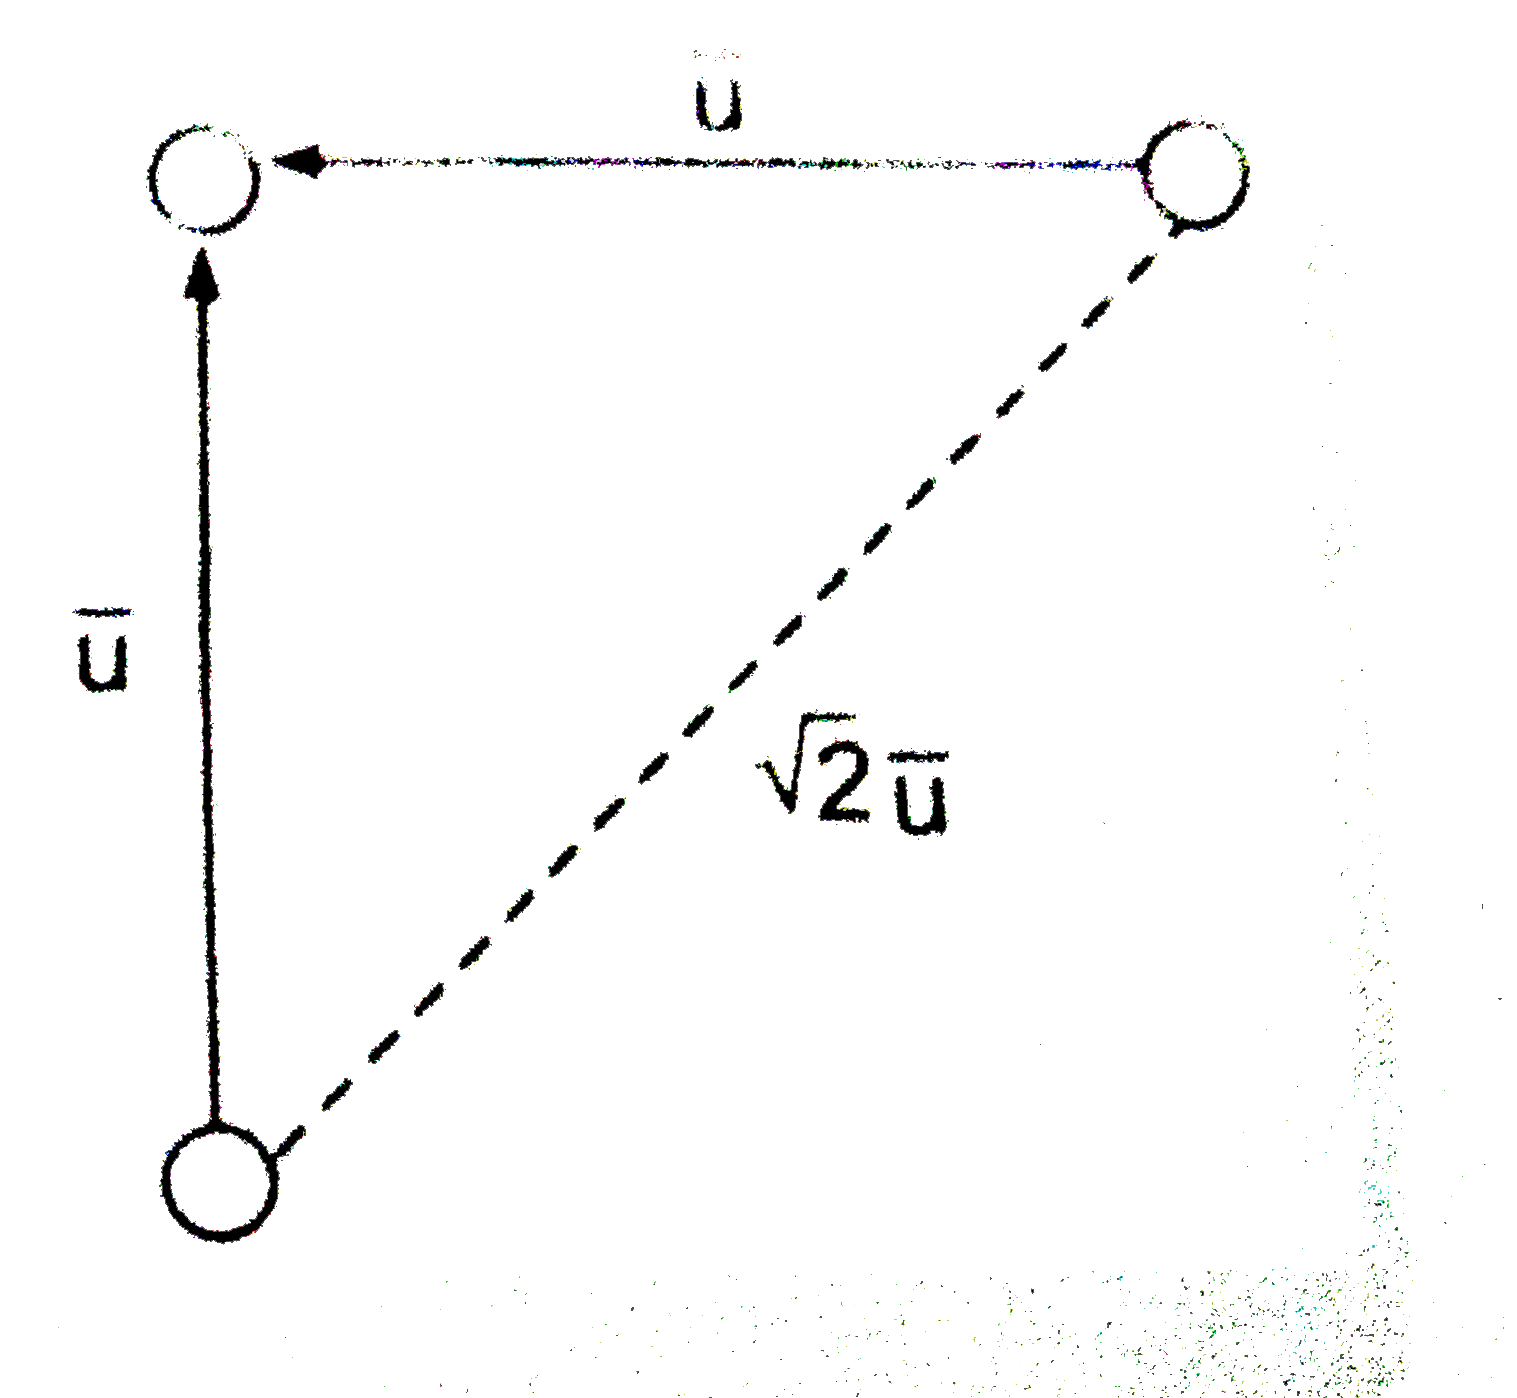
In order to account for the movements of all molecules, we must consider the average velocity along the line of centres of two coliding molecules instead of the average velocity of a single molecule . If it is assumed that, on an average, molecules collide while approaching each other perpendicularly, then the average velocity along their centres is √2¯u as shown below.
Number of collision made by a single molecule with other molecule per unit time is given by
Z1=πσ2(¯urel)N∗=√2πσ2¯uN∗
The total number of bimolecular collisions Z11 per unit volume per unit time is given by
Z11=12(Z1N∗)orZ11=12(√2πσ2¯uN∗)N∗=1√2πσ2¯uN∗2
If the collsion involve two unlike molecules then the number of collisions Z12 per unit volume per unit time is given as
Z12=πσ212(√8kTπμ)N1N2
where N1 and N2 are the number of molecules per unit volume of the two types of molecules, σ12 is the average diameter of the two molecules and μ is the reduced mass. The mean free path is the average distance travelled by a molecule between two successive collisions. We can express it as follows :
λ=Average distance travelled per unit timeNO. of collisions made by a single molecule per unit time=¯uZ1
or λ=¯u√2πσ2¯uN∗⇒1√2πσ2¯uN∗
For a given gas the mean free path at a particular pressure is :
View SolutionOne mole of a gas changed from its initial state (15L,2 atm) to final state (4L,10 atm) reversibly. If this change can be represented by a straight line in P - V curve maximum temperature (approximate), the gas attained is x×102K. Then find the value of x.
View SolutionThe temperature at which real gases obey the ideal gas laws over a wide range of low pressure is called:
View SolutionA solution containing 1MXSO4(aq) and 1MYSO4(aq) is electrolysed. If conc. Of X2+ is 10−zM when deposition Y2+ and X2+ starts simultaneously, calculate the value of Z.
Given: 2.303RTF=0.06
E∘x2+|X=−0.12V,E∘Y2+|Y=−0.24V
View SolutionSTATEMENT-1: All strong monoprotic acid with same concentration in dilute solution show same pH.
STATEMENT-2: Water shows levelling effect.
View SolutionFor 1 mole of an ideal gas, a graph of pressure vs volume is plotted as shown. Which of the following option is correct ?
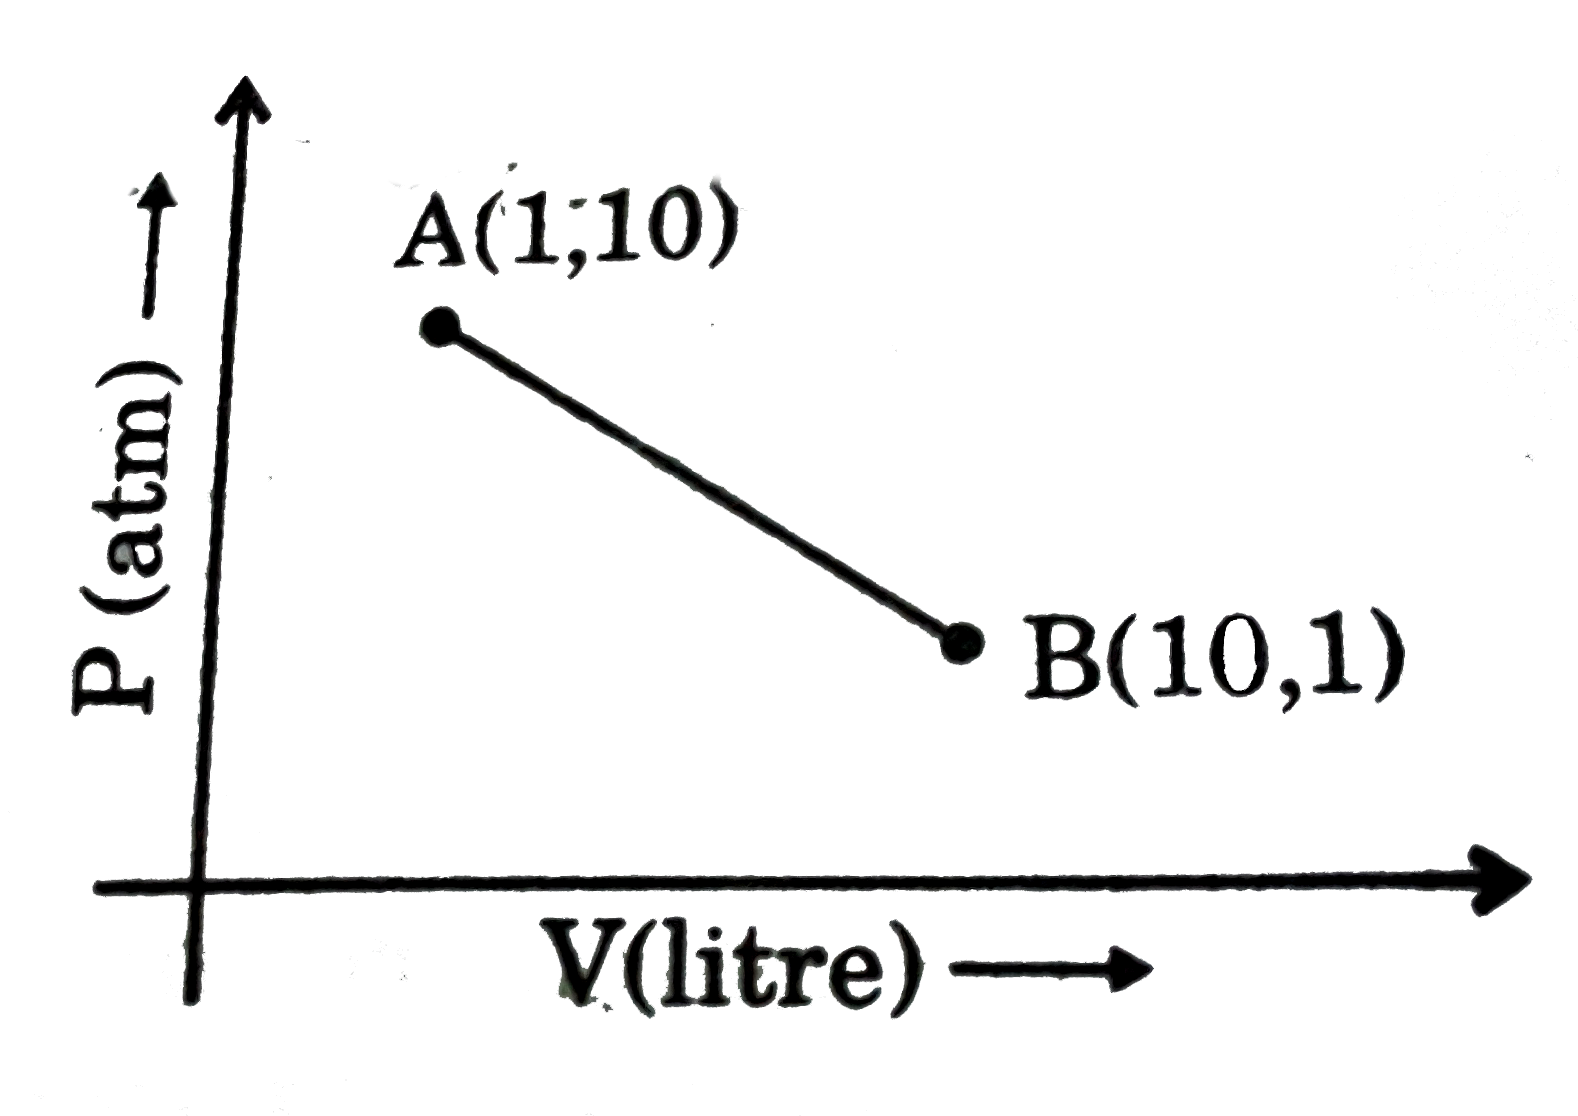
View SolutionConsider the given graph: Graph is plotted for 1 mol of gas at 400K, find slope of curve [take: R = 0.08(L-atm)/(mol-K)]
View Solution10 moles of an ideal gas is subjected to an isochoric process (volume constant) and a graph of log P us log T is plotted where P is in 'atm' and is in 'Kelvin'. If volume of the container is 82.1 ml then calculate sum of a,b and c. Where : a = slope of the graph b = x intercept of the graph c = y intercept of the graph
View SolutionThe intercept on y-axis and slope of curve plotted between P/T vs. T
( For an ideal gas having 10 moles in a closed rigid container of volume 8.21 L. (P= Pressure in atm and T = Temp. in K, log102=0.30)) are respectively :
View SolutionA graph is plotted between p (atm) vs t^(@)C for 10 mol of an ideal gas as follows: Then slope of curve and volume of container (L) respectively, are:
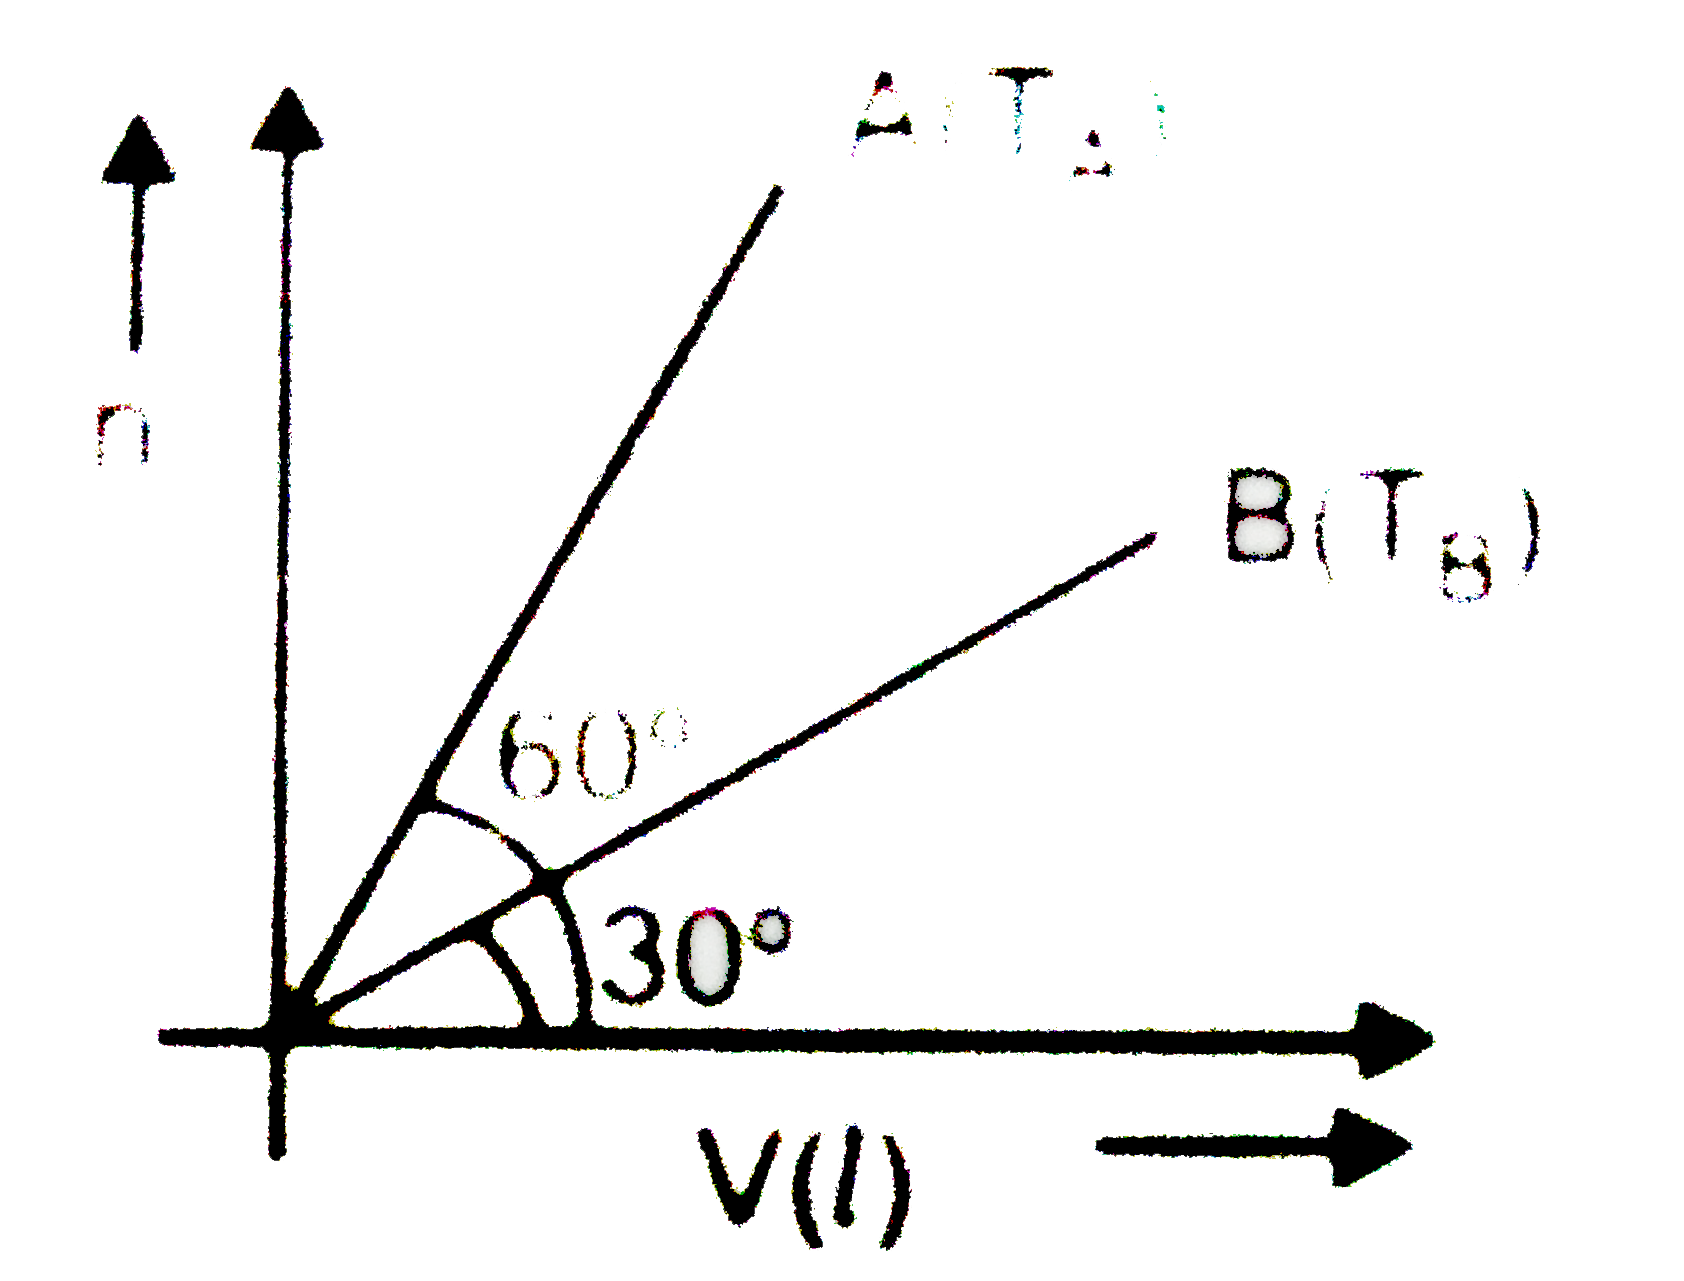
View SolutionFor two samples of ideal gases A and B curves are plotted n vs V (volume of container ) at 16.42 atm pressure. Then temperature of A and B respectively are:
View SolutionAt a constant pressure P, the plot of volume (V) as a function of temperature (T) for 2 moles of an ideal gas gives a straight line with a slope 0.328 L K^(-1) . The value of P (in atm) is closest to [Gas constant, R = 0.0821 L atm mol^(-1)" "K^(-1) ]
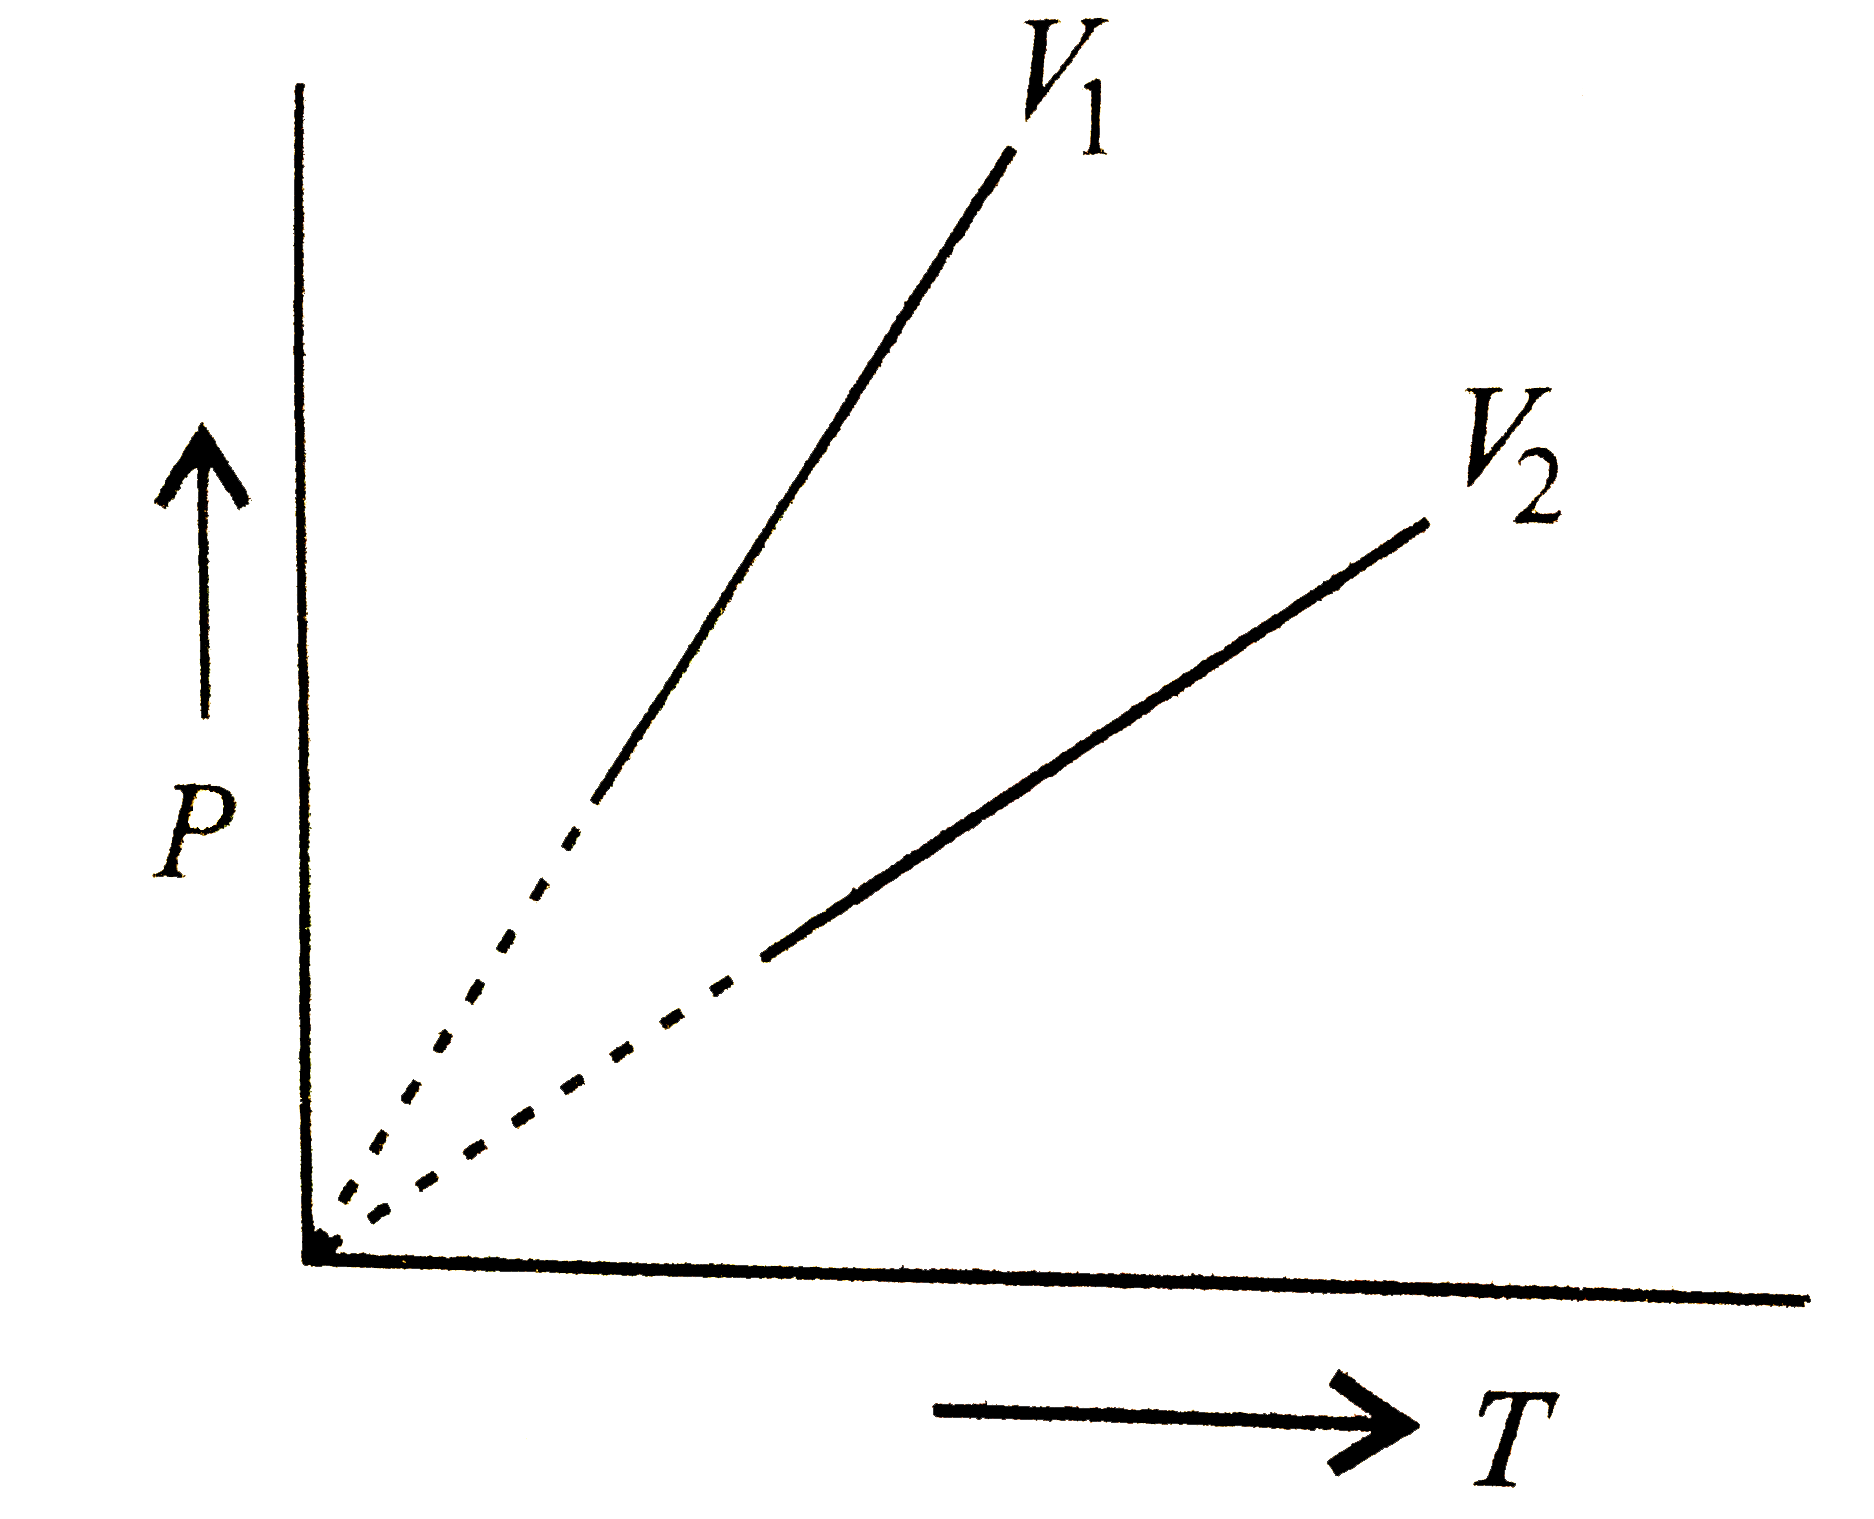
View SolutionA plot of P vs T for a given mass of gas at constant volume is a straight line . P vs T at constant volumes V1 and V2 for an ideal gas are shown below :
Which of the following is correct ?
View SolutionFor one mole of an ideal gas the slope of V vs. T curve at constant pressure of 2 atm is XL⋅mol−1⋅K−1. The value of the ideal universal gas constant 'R' in terms of X is-
View SolutionOn the recently discovered 10^(th) planet it has been found that the gases follow the relationship Pe^(V//2) =nCT where C is constant other notation are as usual( V in lit.,P in atm andTinKelvin) . A curve is plotted between P and V at 500 K & 2 moles of gas as shown in figure. Find the slope of the curve plotted between P Vs T for closed container of volume 2 lit. having same moles of gas
View SolutionThe ideal gas equation for 1 mol of ideal gas is PV = nRT
graph between P and T at constant volume, i.e. isochores are plotted as under
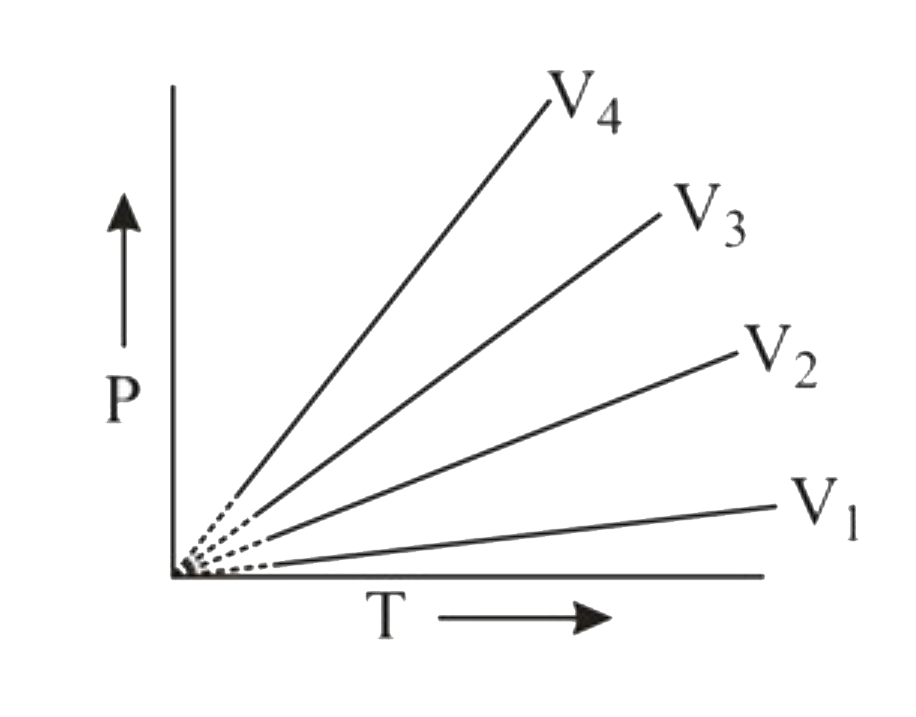
Which of the following order of volume is correct ?
View Solution
