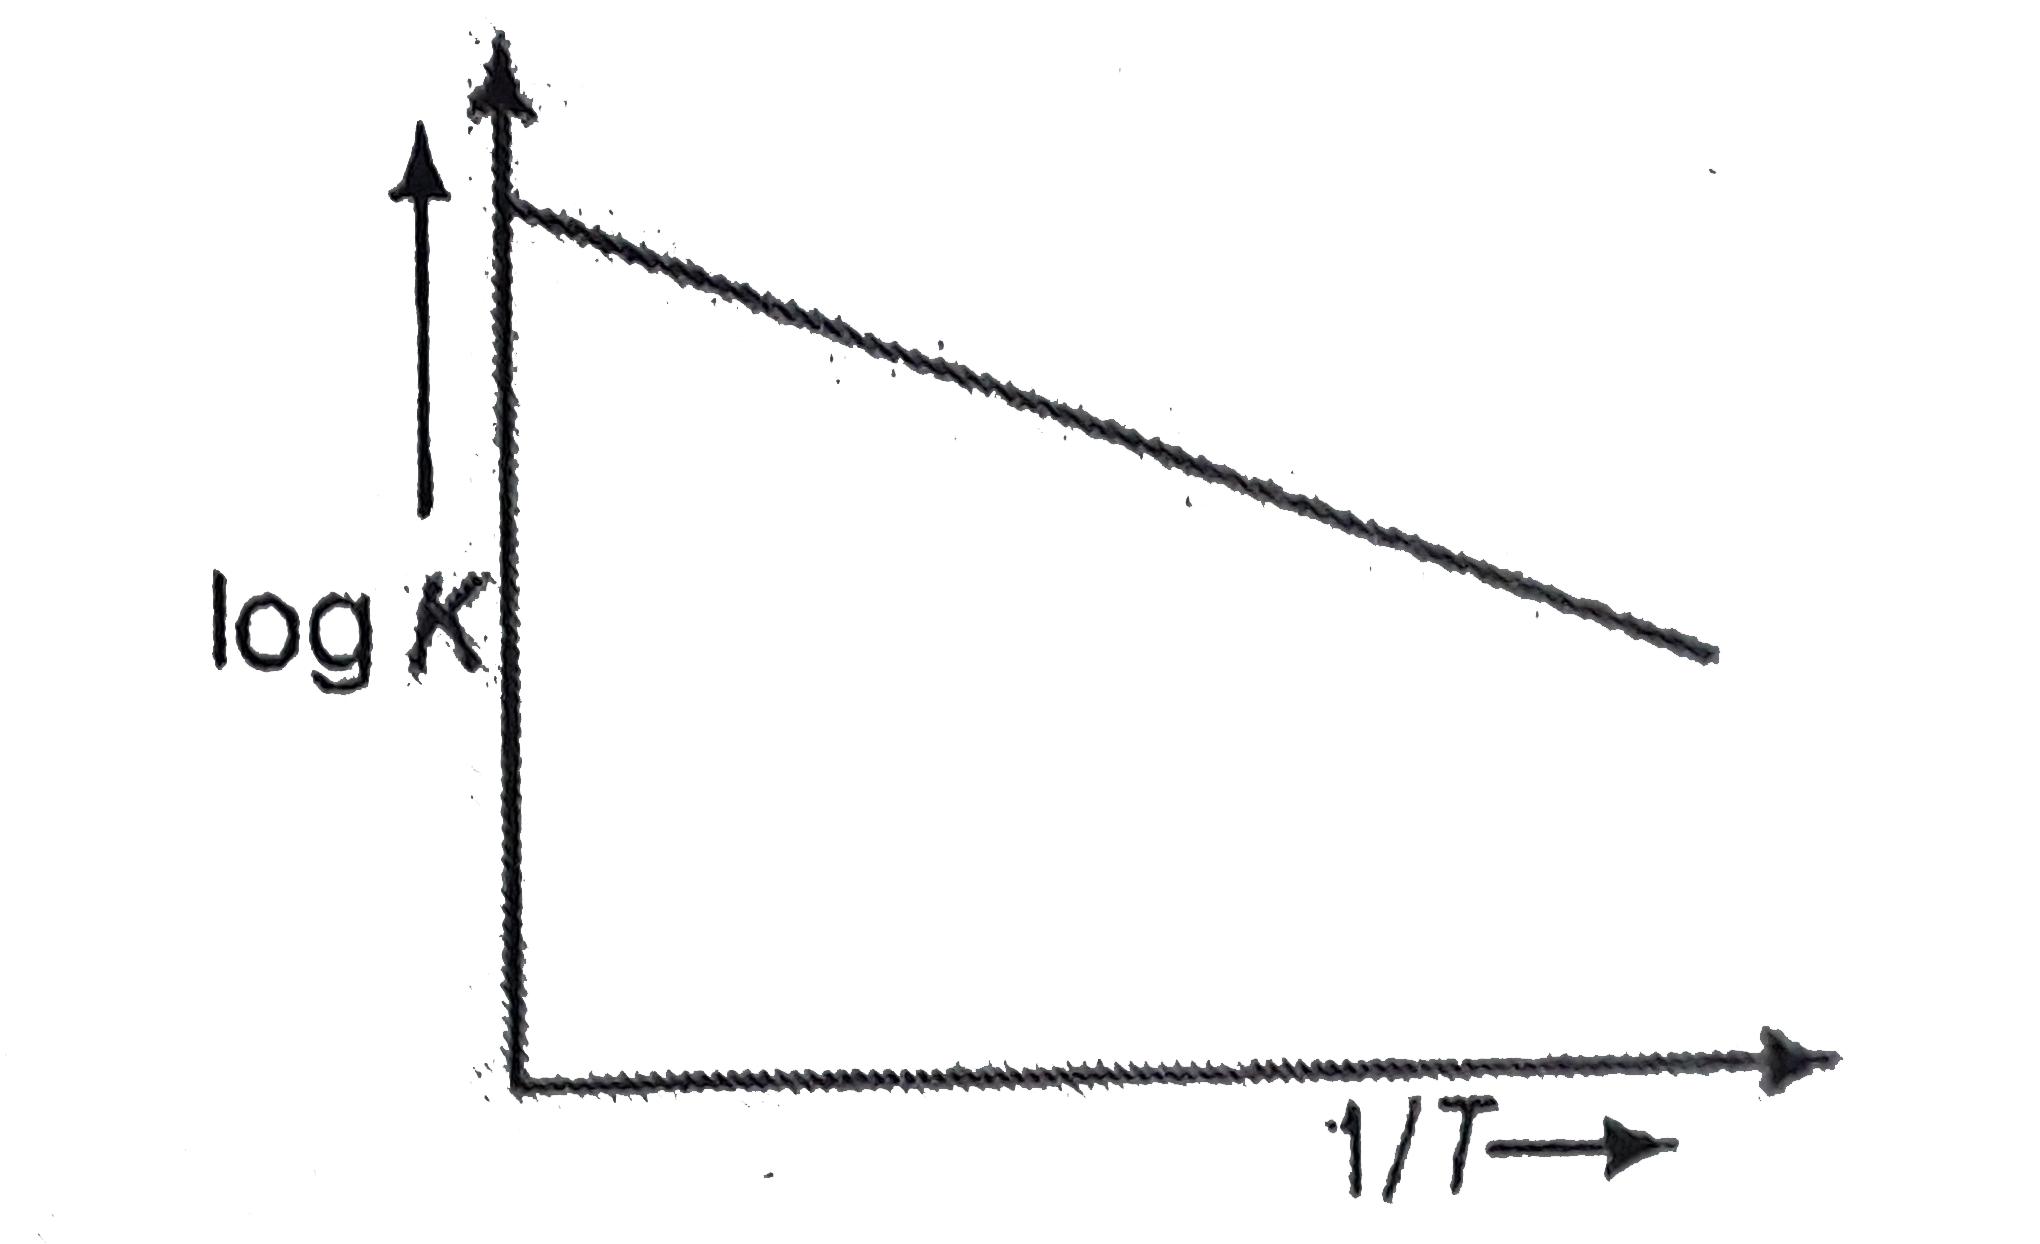
A graph plotted between log k vs 1T is represented by
A
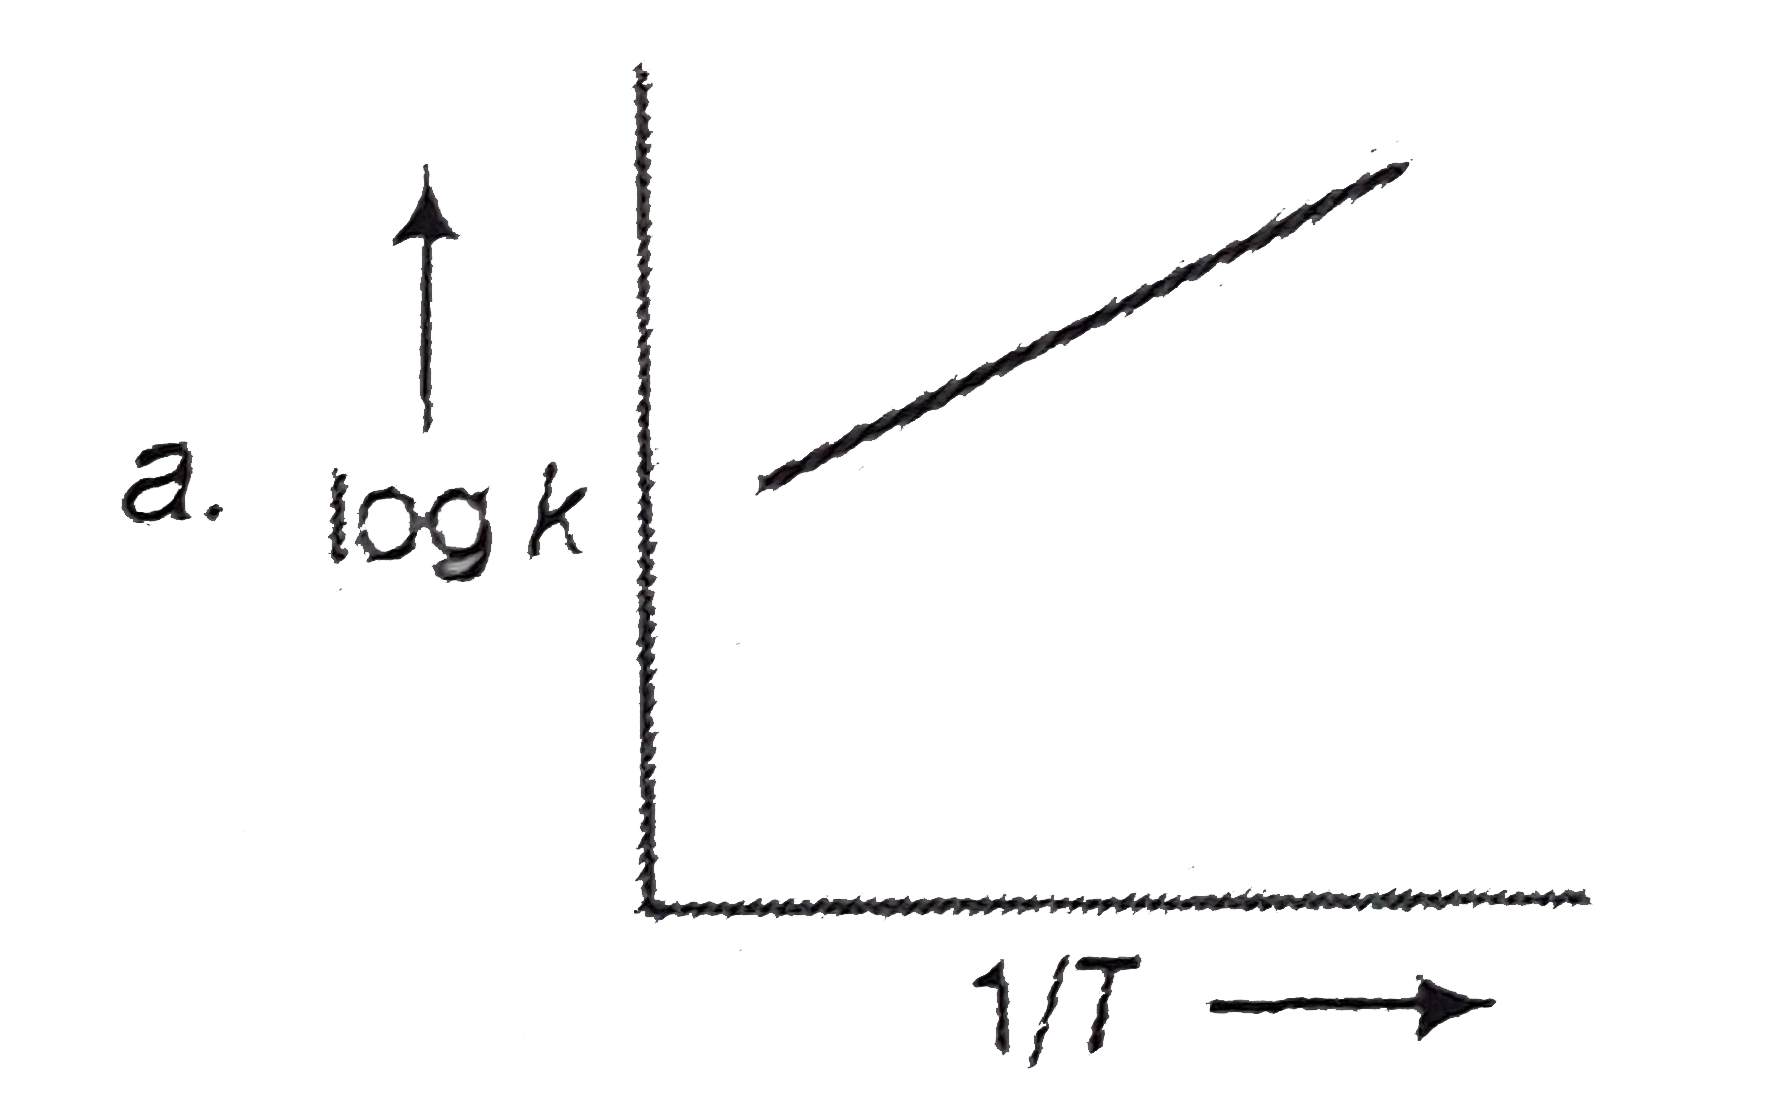
B
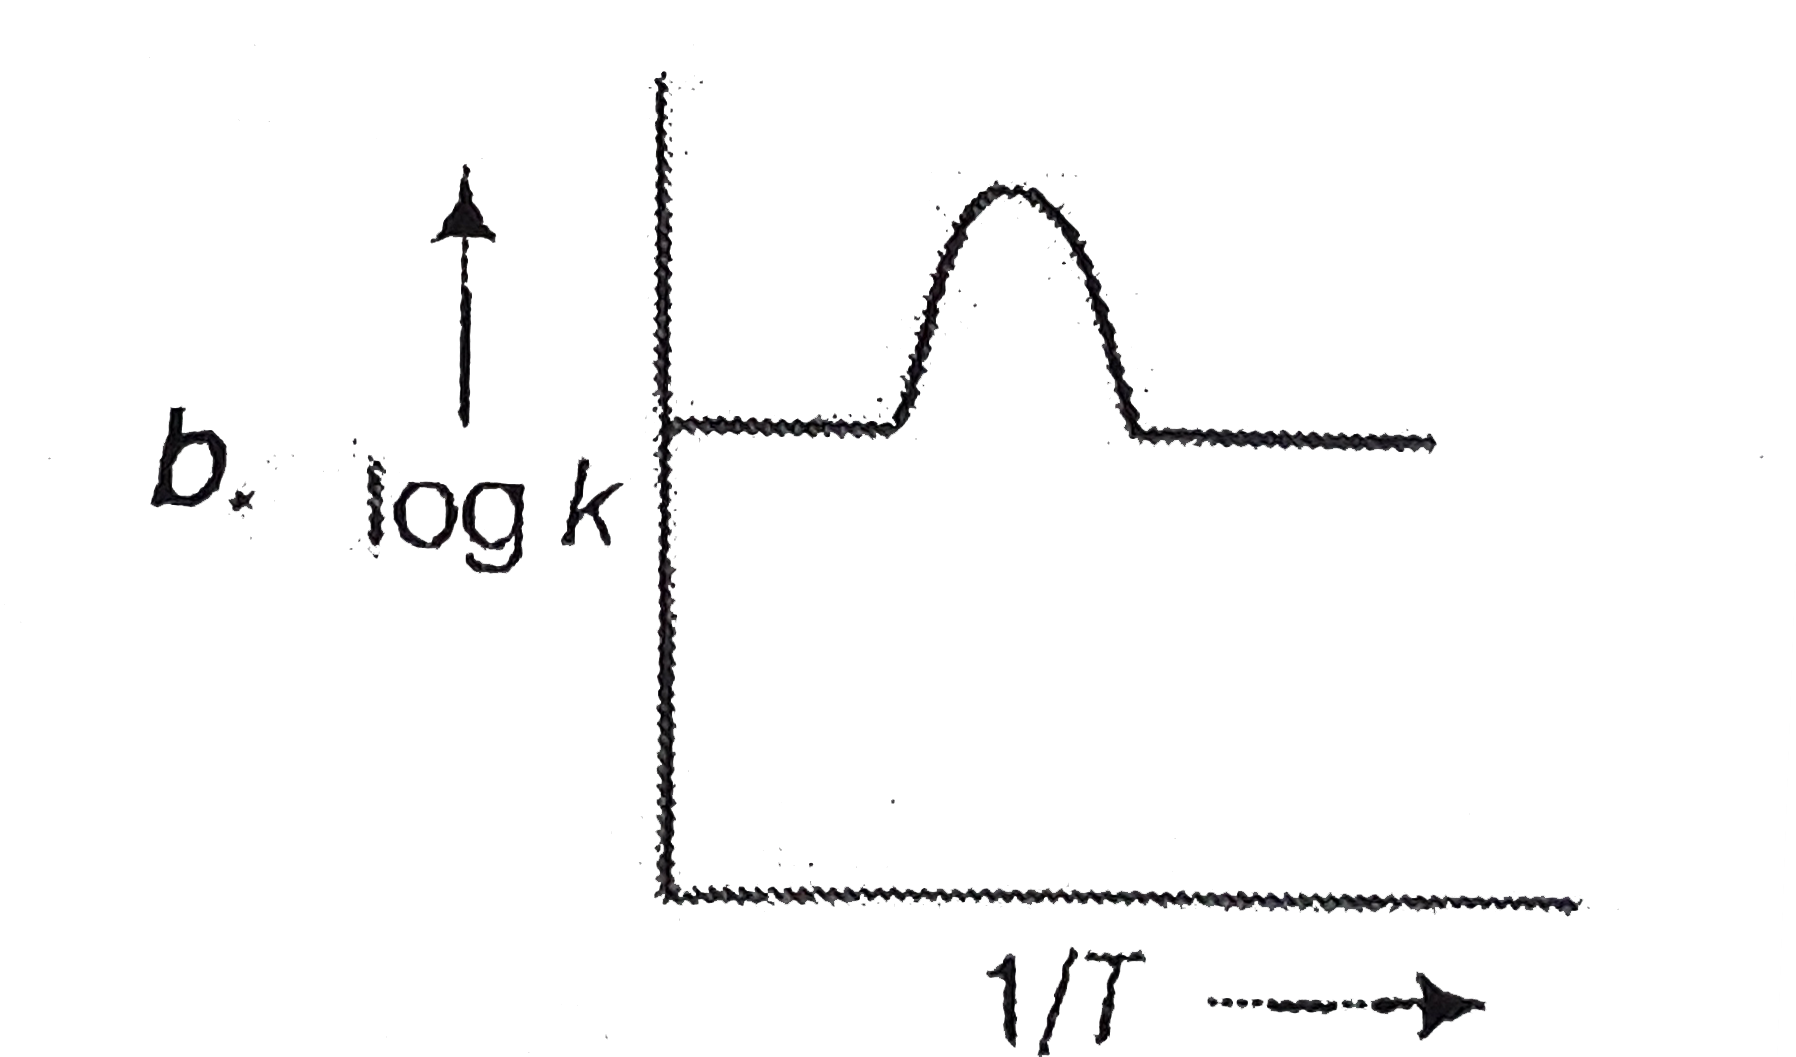
C
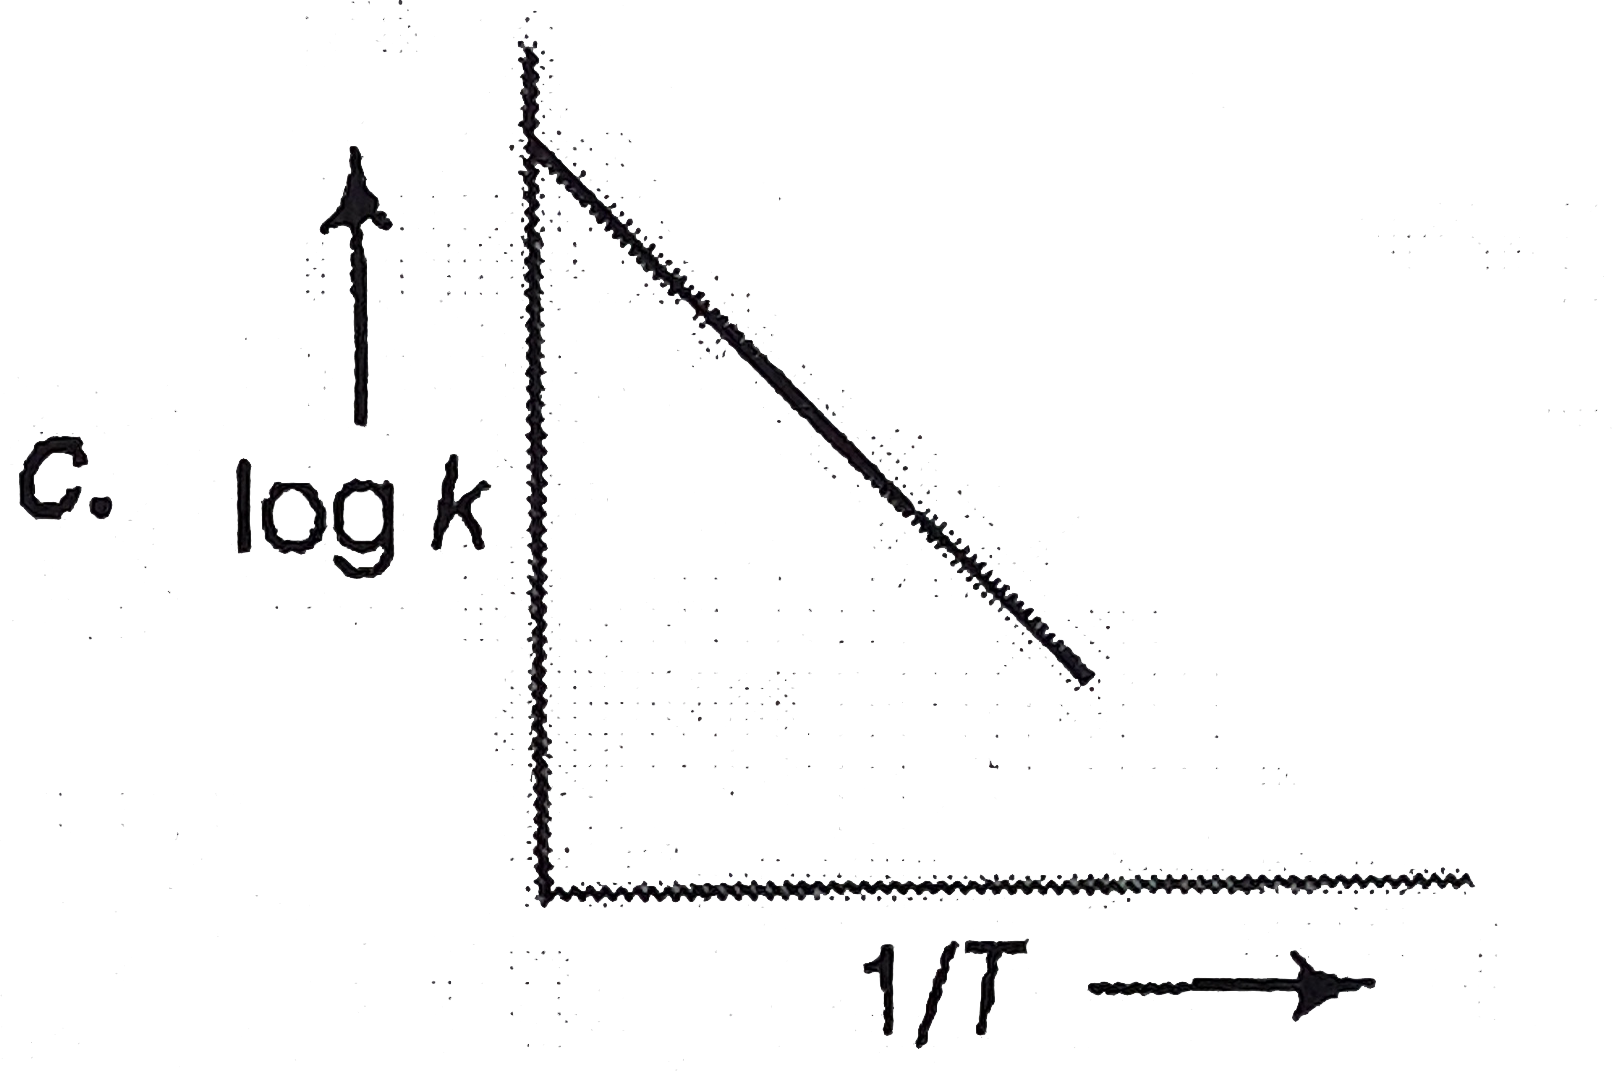
D
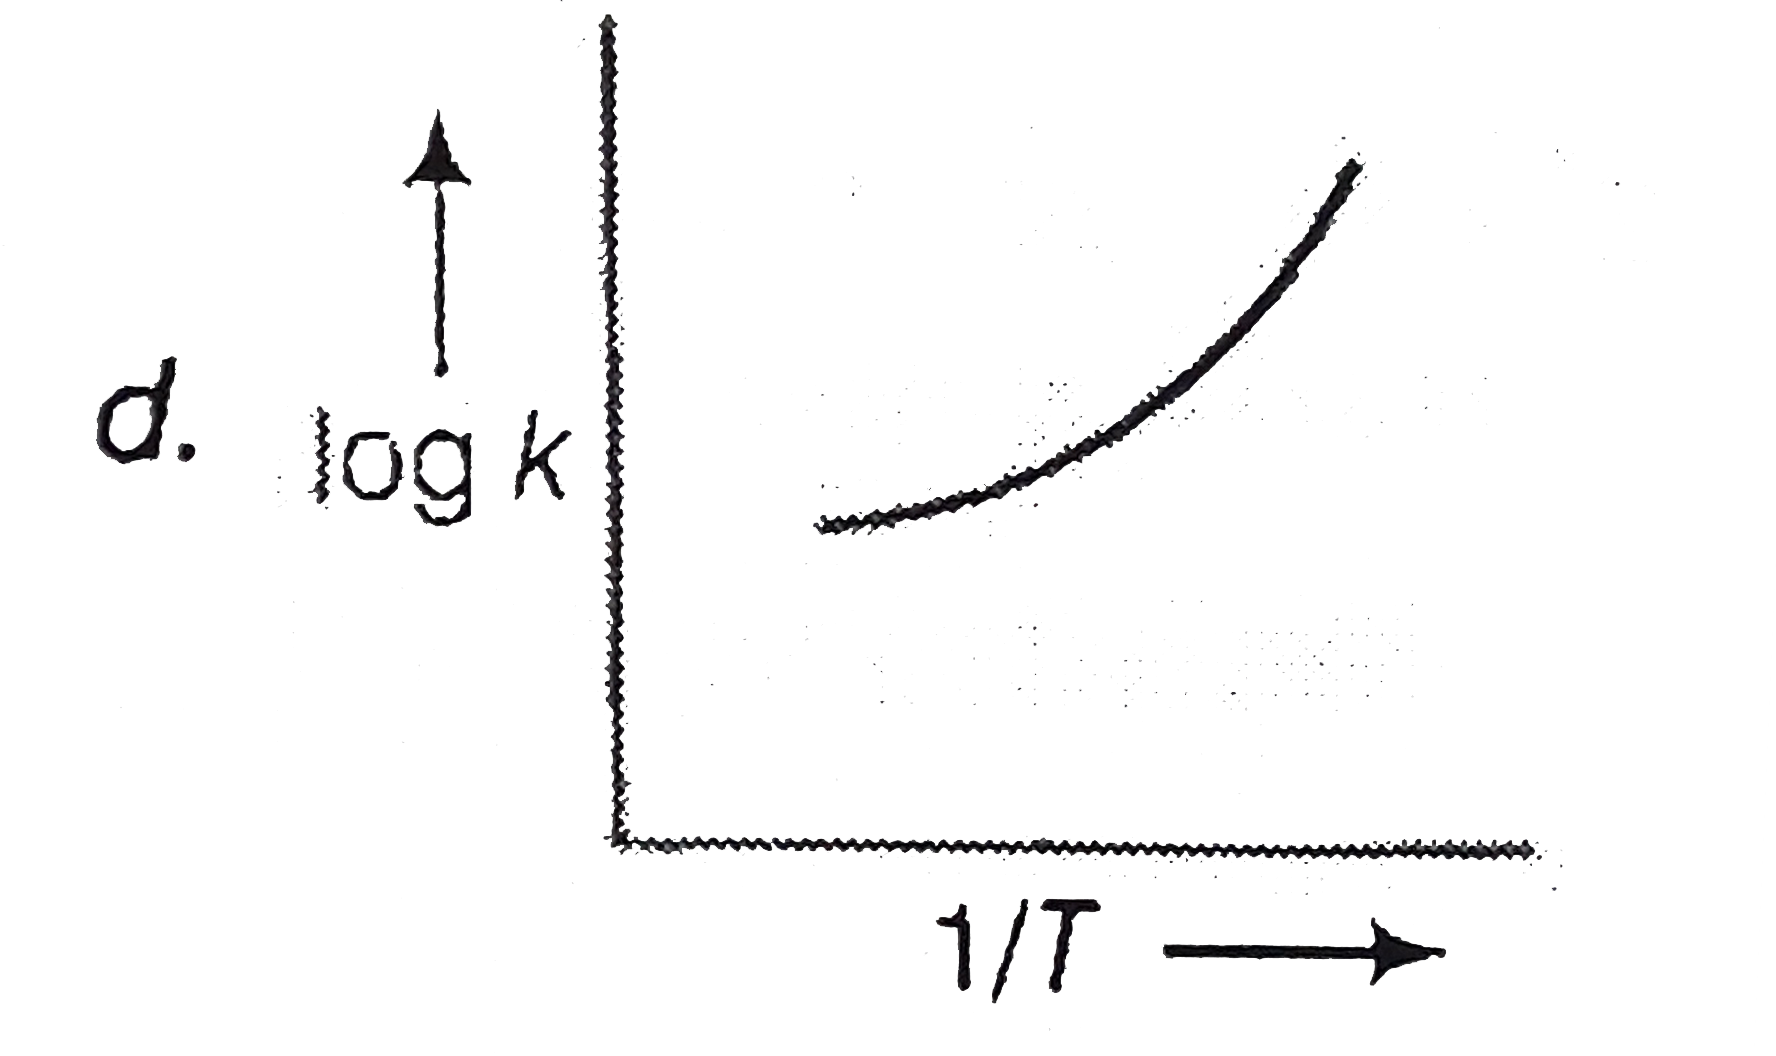
Video Solution
Text Solution
The correct Answer is:C
On the basis of Arrhenius equation,
|
Topper's Solved these Questions
- CHEMICAL KINETICSBOOK - BITSAT GUIDECHAPTER - CHEMICAL KINETICSEXERCISE - BITSAT Archives
16 Videos
- CARBOXYLIC ACID AND DERIVATIVESBOOK - BITSAT GUIDECHAPTER - CARBOXYLIC ACID AND DERIVATIVESEXERCISE - All Questions
34 Videos
- CHEMICAL THERMODYNAMICSBOOK - BITSAT GUIDECHAPTER - CHEMICAL THERMODYNAMICSEXERCISE - BITSAT Archives
15 Videos
Similar Questions
Knowledge Check
A graph is ploted between log K virsus 1T for calculation of activation energy (Ea). The correct plot is
A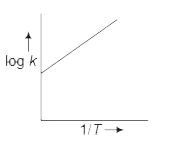 B
B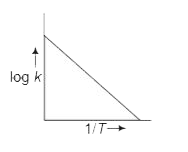 C
C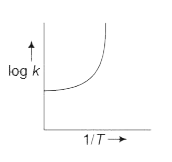 D
D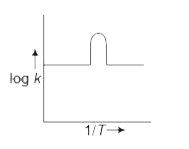
A graph plotted between log N vs, time gives a slope and intercept equal to:
A−λ2.303,logN0Bλ2.303,logN0C−λ2.303,N0Dλ2.303,N0At constant temperature if a graph plotted between logP and log(1V) has an intercept of unity then what will be the value of constant (k)
A1B10C100D1000
A graph plotted between logk versus 1/T for calculating activation energy is shown by
View SolutionIf a graph is plotted between ln k and 1/T for the first order reaction, the slope of the straight line so obtained is given by
View SolutionIf we plot a graph between log K and 1T by Arrhenius equation , the slope is
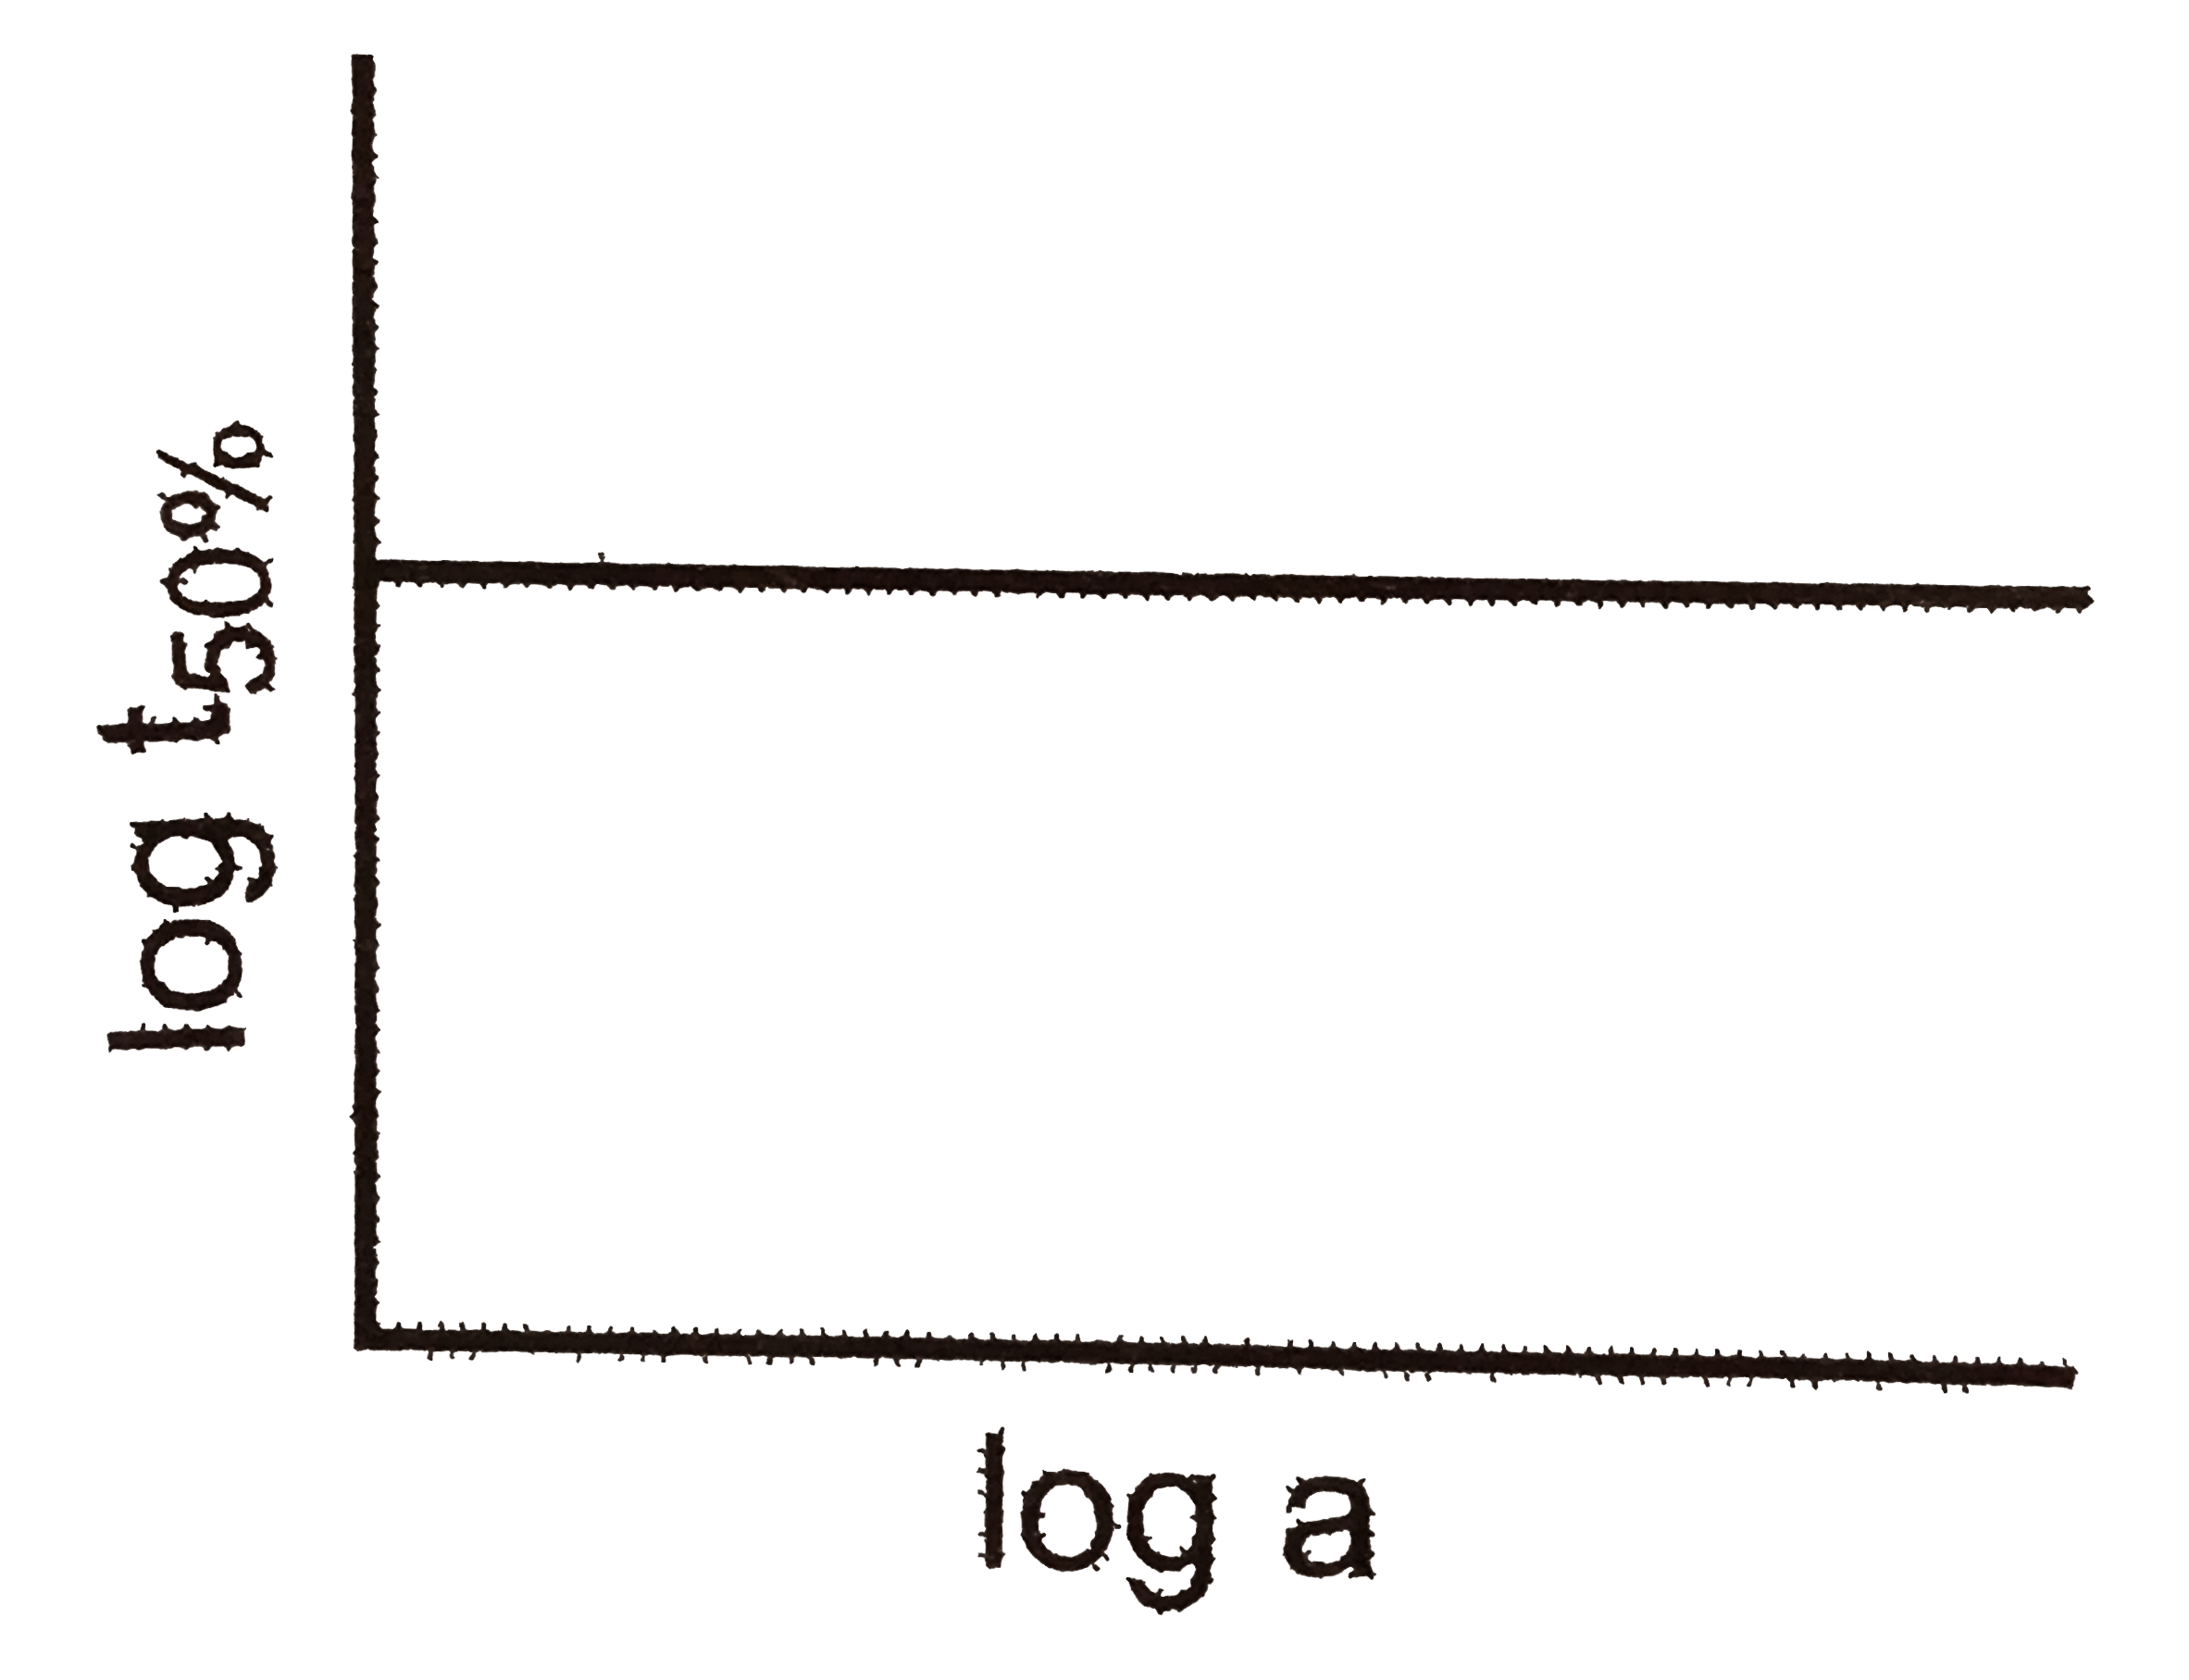
View SolutionA graph plotted between logt50% vs log concentration in a straight line. What conclusion can you draw from this graph?

View SolutionA graph plotted between log t50% vs log concentration is a straight line. What conclusion can you draw from this graph?
View Solution
