At two different temperature T1andT2,(T2>T1), draw two PV-P graphs for a definite amount of an ideal gas.Solution in Bengali
Step by step video & image solution for At two different temperature T_(1) and T_(2), (T_(2) gt T_(1)), draw two PV-P graphs for a definite amount of an ideal gas. by Chemistry experts to help you in doubts & scoring excellent marks in Class 11 exams.
Updated on:21/07/2023Topper's Solved these Questions
- STATES OF MATTER : GASES AND LIQUIDSBOOK - CHHAYA PUBLICATIONCHAPTER - STATES OF MATTER : GASES AND LIQUIDSEXERCISE - EXERCISE (NUMBERICAL PROBLEMS)
56 Videos
- STATES OF MATTER : GASES AND LIQUIDSBOOK - CHHAYA PUBLICATIONCHAPTER - STATES OF MATTER : GASES AND LIQUIDSEXERCISE - PRACTICE SET
10 Videos
- STATES OF MATTER : GASES AND LIQUIDSBOOK - CHHAYA PUBLICATIONCHAPTER - STATES OF MATTER : GASES AND LIQUIDSEXERCISE - EXERCISE (FILL IN THE BLANKS)
13 Videos
- SOME BASIC CONCEPTS OF CHEMISTRYBOOK - CHHAYA PUBLICATIONCHAPTER - SOME BASIC CONCEPTS OF CHEMISTRYEXERCISE - PRACTICE SET
13 Videos
- STRUCTURE OF ATOMBOOK - CHHAYA PUBLICATIONCHAPTER - STRUCTURE OF ATOMEXERCISE - PRACTICE SET
15 Videos
Similar Questions
At 10−3mm pressure and 300 K, a 2L flask contains equal numbers of moles of N2 and water vapour. (i) what is the total number of moles of N2 and water vapour in the mixture ? (ii) what is the total mass of the mixture?
View SolutionMaximum deviation from ideal gas is expected in case of-
View Solution0.1 ATM=_____Pa=_______torr.
View SolutionWhat do you mean by semimolar NaOH solution?
View SolutionWhat accelerating potential is needed to produce an electron beam with an effective wavelength of 0.090Å-
View SolutionFigure shows graphs of pressure versus density for an ideal gas at two temperatures T_(1) and T_(2) Which is correct ? .
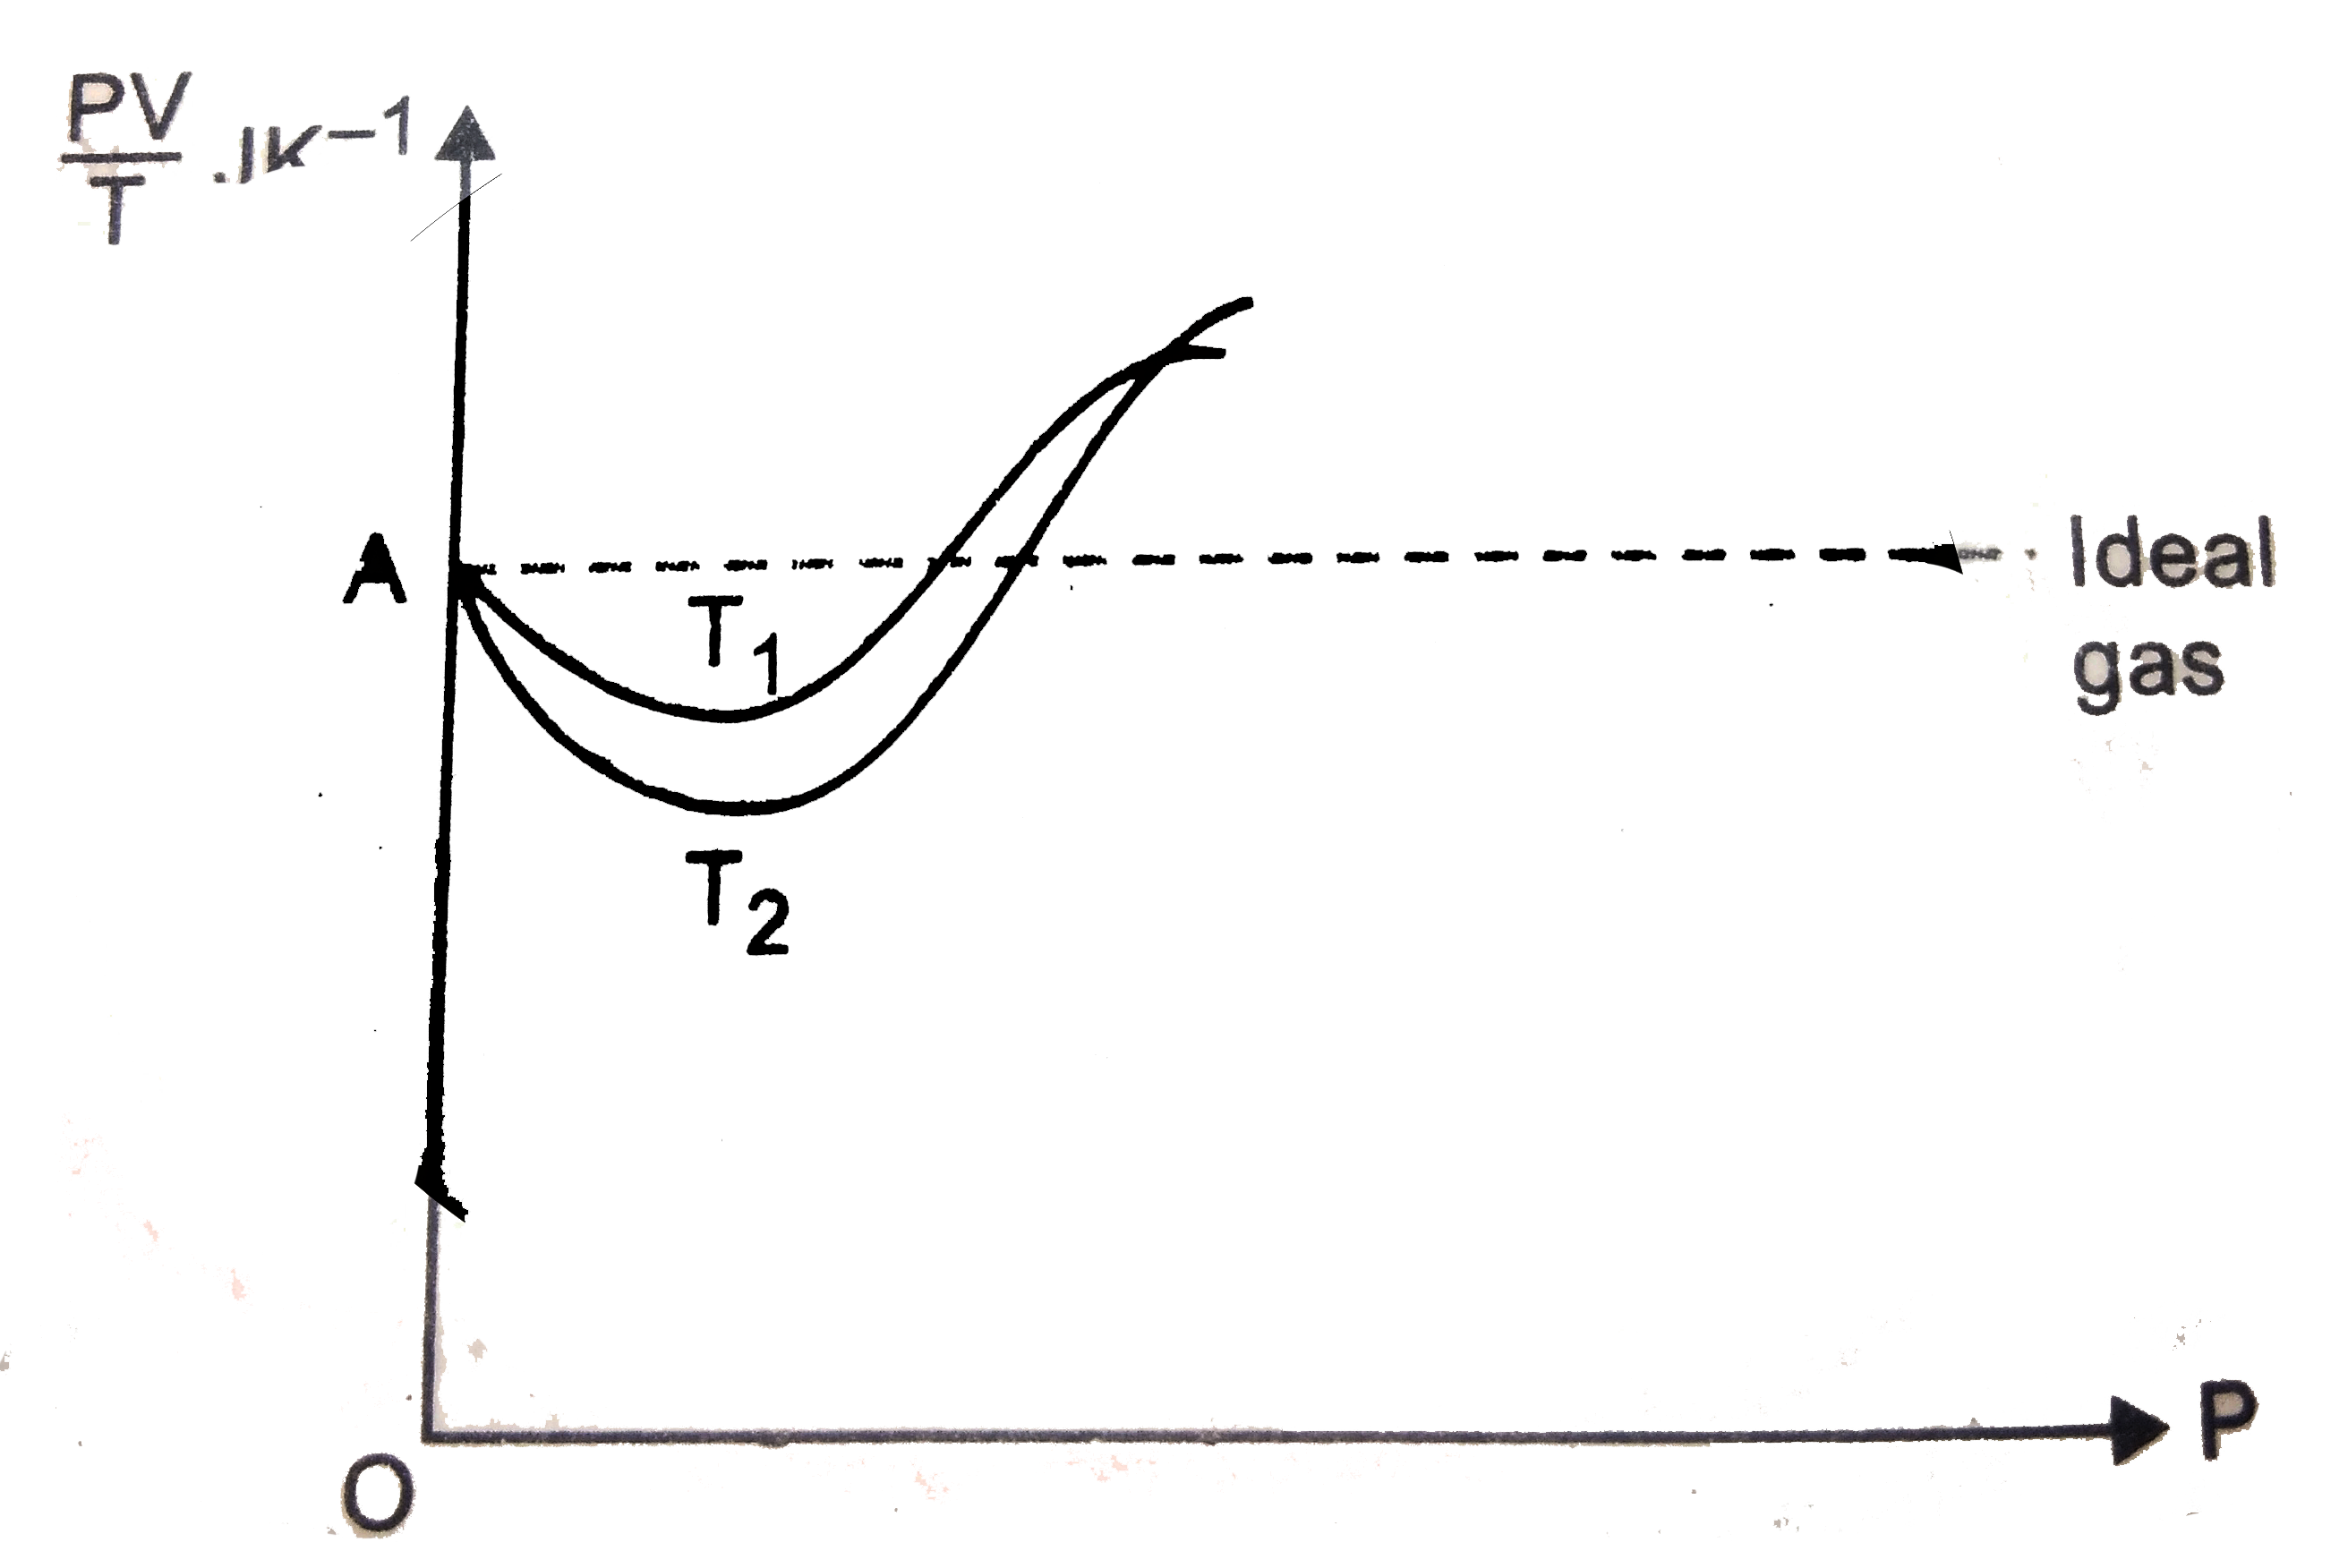
View SolutionGiven is the graph between PVT and P for 1 gm of oxygen gas at two different temperatures T1andT2 Fig. Given, density of oxygen =1.427kgm−3. The value of (PV)/(T) at the point A and the relation between T1andT2 are respectively :

View SolutionThe stress-strain graph for a metallic wire is shown at two different temperature, T_(1) and T_(2) which temperature is high T_(1) or T_(2) ?
View SolutionThe p-V diagrams of same mass of a gas are drawn at two different temperatues T_(1) and T_(2) Explain whether T_(1)gtT_(2)gt or T_(2)gtT_(1).
View SolutionFigure shows graphs of pressure vs density for an ideal gas at two temperatures Tt and T2
View Solutionदो पिण्ड विभिन्न तापों T1 व T2 पर हैं । यदि उन्हें उष्मीय संपर्क में लाया जाये, तो आवश्यक नहीं वे औसत ताप (T1+T2)/2 पर स्थिर हों । क्यों?
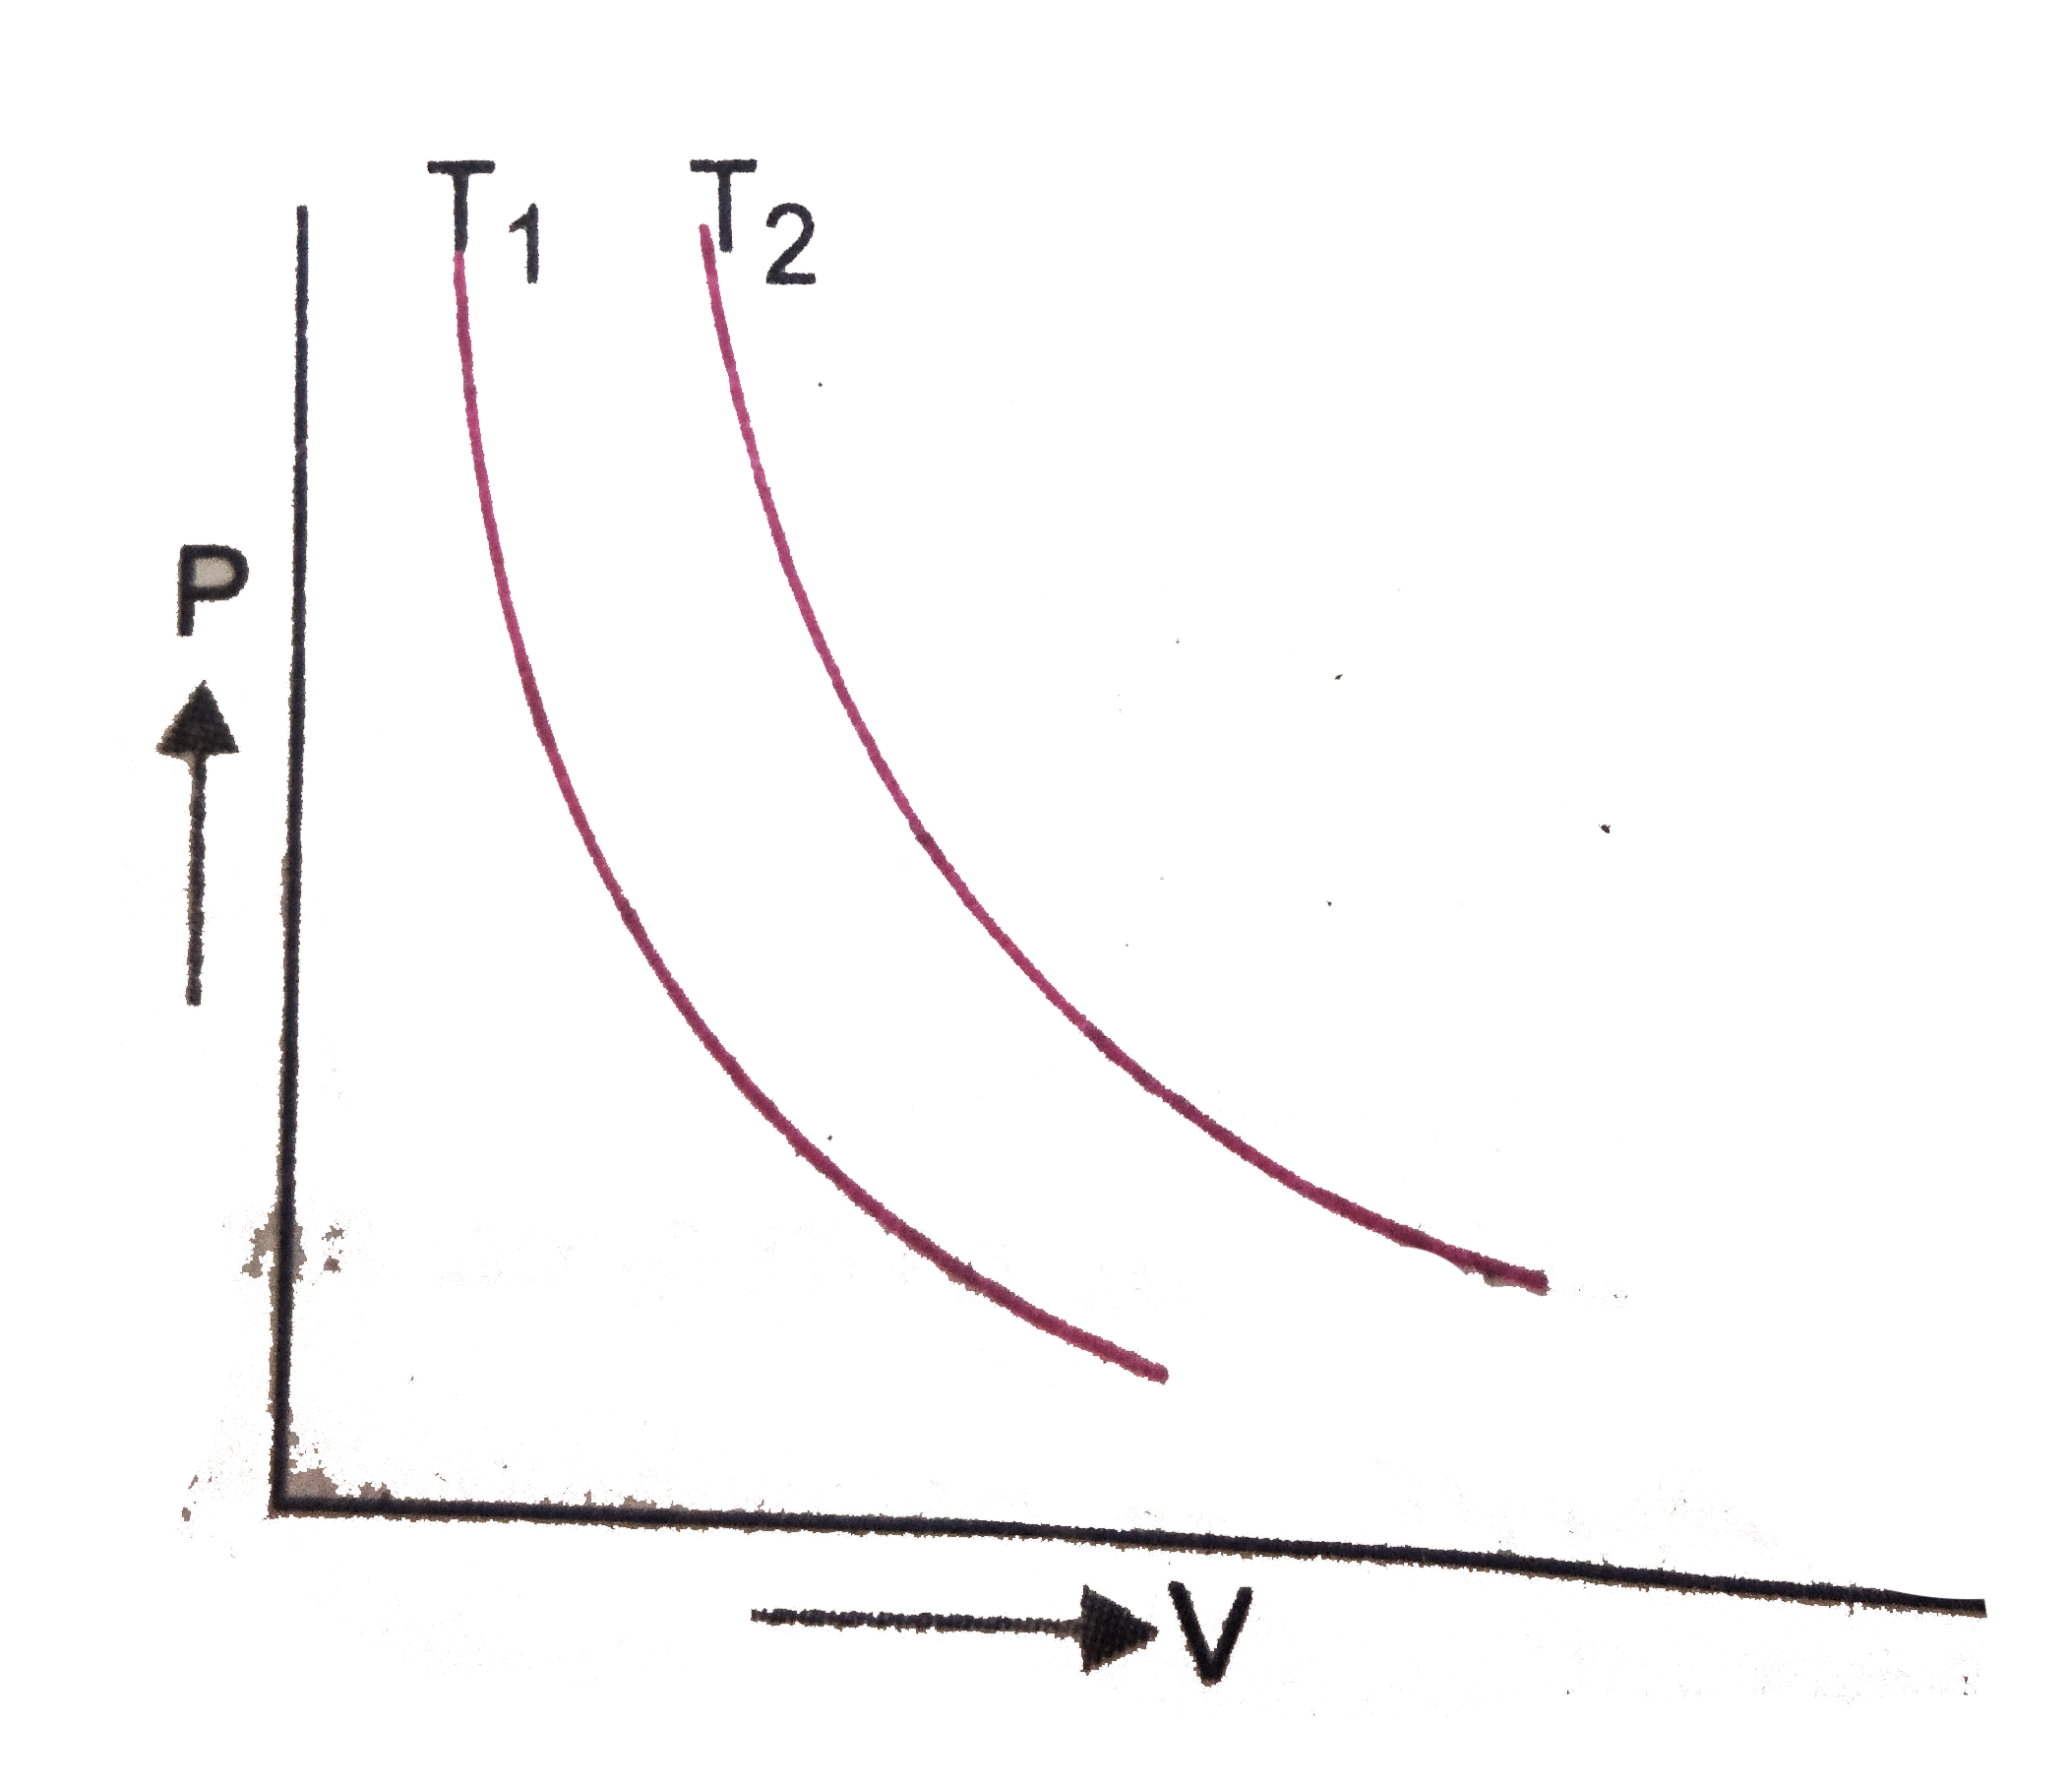
View SolutionIsothermal curves for a given mass of gas are shown at two different temperture T1andT2 in Fig. State whether T1>T2orT2>T1. Justify your answer.

View SolutionThe following graph respresent the pressure versus number density for ideal gas at two different temperature T1andT2. The graph implies ................. .
View Solutionनिम्न चित्रों में T1 तथा T2(T2>T1) ताप पर कृष्ण वस्तु हेतु ऊर्जा वितरण दर्शाये गये हैं, कौन सा ग्राफ सही है
View SolutionIf two bodies at different temperatures T1 and T2 are brought in thermal contact, the mean temperature T1+T22. When
View Solution
