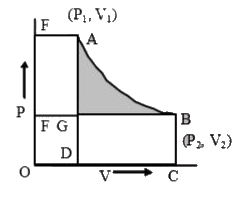
Graphically shoe the total work done in an expansion when the state of an ideal gas is changed reversibly and isothermally from (pi,Vi) to (pf,Vf). With the help of a pV plot compare the work done in the above case with that carried out against a constant pressure pf.

(i) Area ABViVf represents total work done for reversible isothermal expansion from (pi,Vi) to pfVf
Area CBViVf represents work done against constant pressure, pf
Work (i) is larger than work (ii)
Topper's Solved these Questions
- THERMODYNAMICSBOOK - MODERN PUBLICATIONCHAPTER - THERMODYNAMICSEXERCISE - Revision Exercise (Objective Question)
10 Videos
- THERMODYNAMICSBOOK - MODERN PUBLICATIONCHAPTER - THERMODYNAMICSEXERCISE - Revision Exercise (True or False)
10 Videos
- THERMODYNAMICSBOOK - MODERN PUBLICATIONCHAPTER - THERMODYNAMICSEXERCISE - NCERT Exemplar Problems (Assertion and Reason Type Questions)
3 Videos
- STRUCTURE OF ATOMBOOK - MODERN PUBLICATIONCHAPTER - STRUCTURE OF ATOMEXERCISE - Unit Practice Test
13 Videos
Similar Questions
Graphically shoe the total work done in an expansion when the state of an ideal gas is changed reversibly and isothermally from (pi,Vi) to (pf,Vf). With the help of a pV plot compare the work done in the above case with that carried out against a constant pressure pf.
View SolutionWrite the expression to calculate maximum work done when 1 mole of an ideal gas expands isothermally and reversibly from V1 to V2
View Solution
Knowledge Check
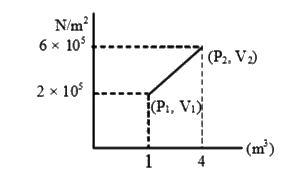
An ideal gas is transformed from state A(P1,V1) to the state B(P2,V2) through path AB. In this process the work done by the gas is
 AW = area ABCDABW = area ABEFACW = area ABGADW = area ABCOFA
For a sample of perfect gas when its pressure is changed isothermally from pi to pf , the entropy change is given by
AΔS=nRIn(PfPi)BΔS=nRIn(PiPf)CΔS=nRTIn(PfPi)DΔS=RTIn(PiPf)For a sample of perfect gas when its pressure is changed isothermally from pi to pf , the entropy change is given by
AΔS=nRln(pfpi)BΔS=nRln(pipf)CΔS=nRTln(pfpi)DΔS=nRTln(pipf)
For a sample of perfect gas when its pressure is changed isothermally from pi to pf , the entropy change is given by
View SolutionA system changes from the state (P1,V1) to (P2,V2) as shown in the figure below. What is the work done by the system –

View SolutionFor a sample of perfect gas when its pressure is changed isothermally from pi→pf the entropy change is given by
View SolutionA thermodynamic system goes from states (i) P1V to 2P1 , V (ii) P , V to P , 2 V . Then work done in the two cases is
View SolutionAn ideal gas is expandend isothermally from(P1V1) and to (P2V2) against a constant external pressure. Which of the following is/are correct regarding above process ?
View Solution
