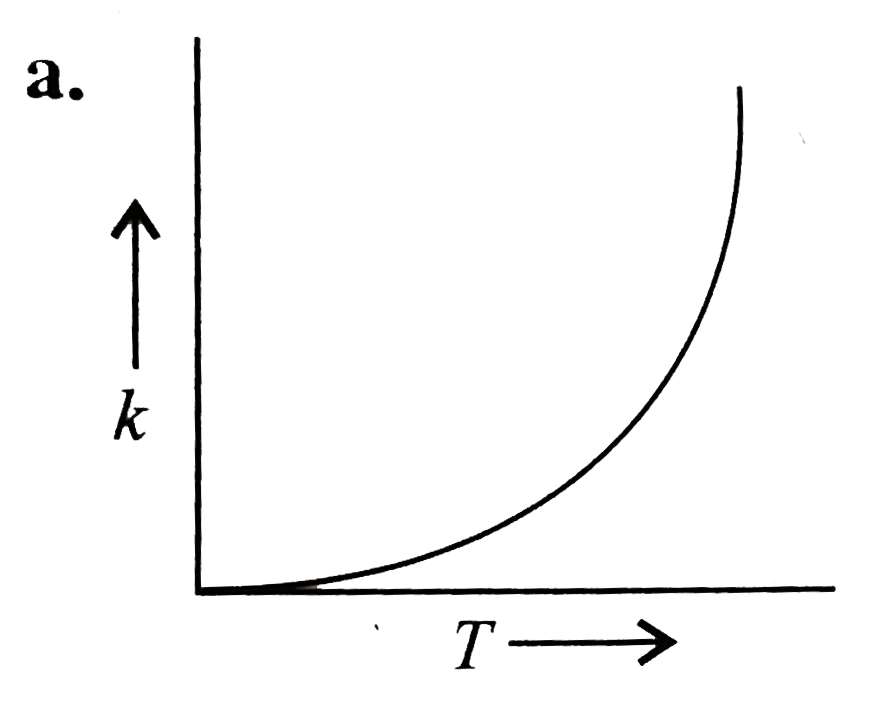
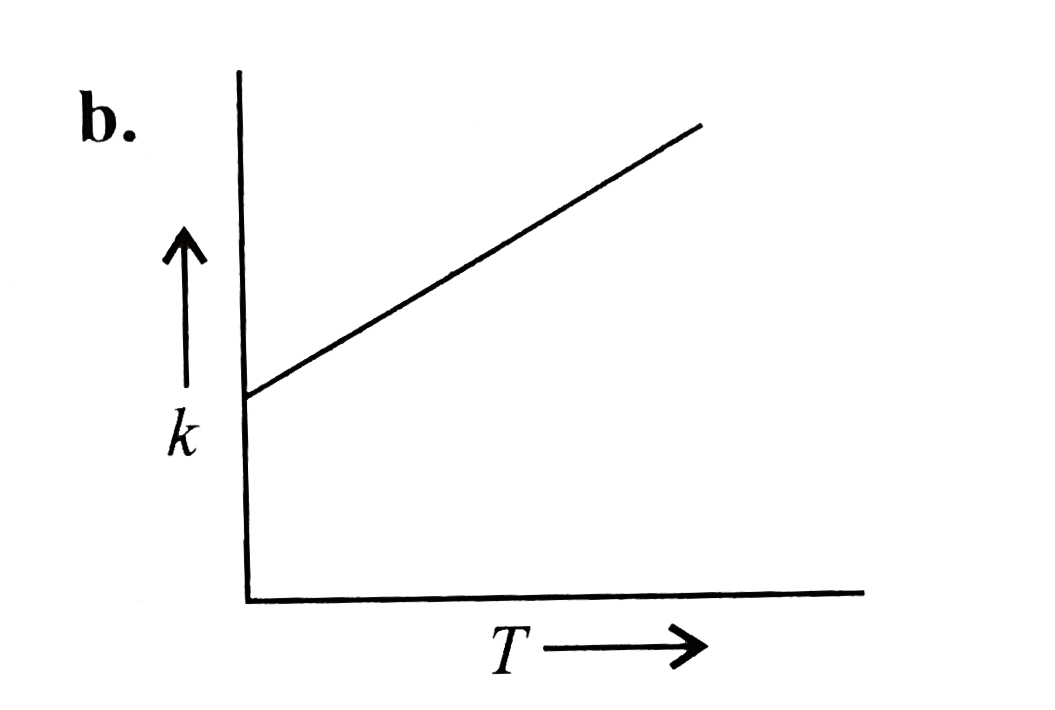
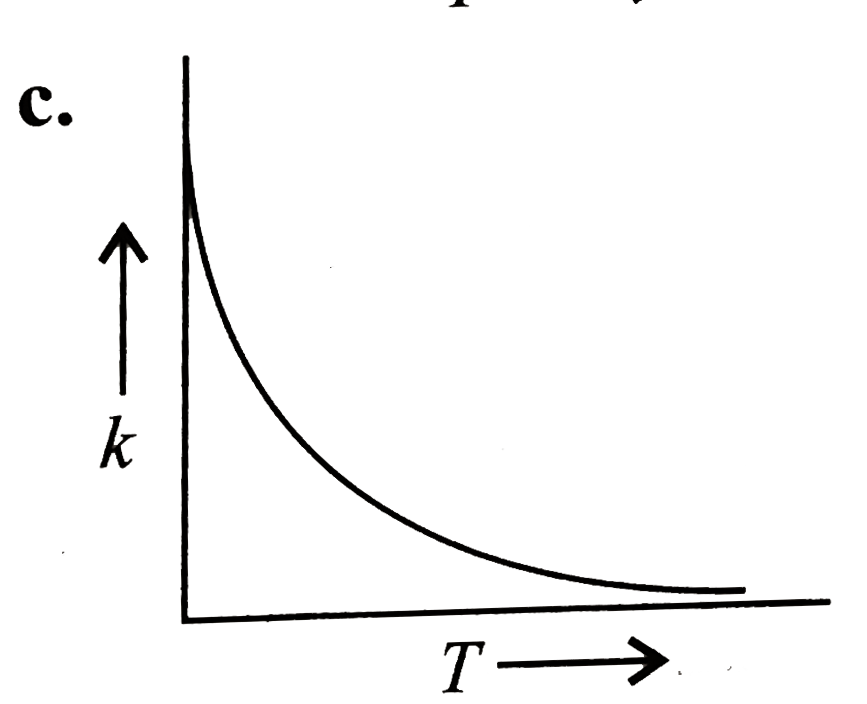
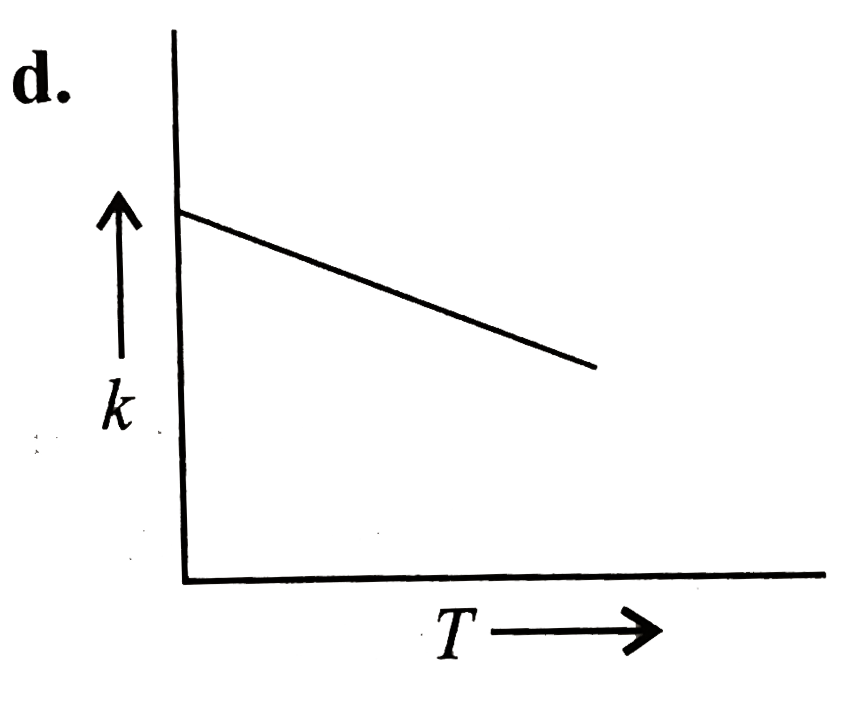
Plots showing the variation of the rate constant (k) with temperature (T) are given below. The plot that follows the Arrhenius equation is
The correct Answer is:A
To determine which plot shows the variation of the rate constant k with temperature T that follows the Arrhenius equation, we can analyze the relationship described by the equation and how it translates into a graphical representation.
1. Understanding the Arrhenius Equation:
The Arrhenius equation is given by:
k=Ae−EaRT
where:
- k is the rate constant,
- A is the pre-exponential factor,
- Ea is the activation energy,
- R is the universal gas constant,
- T is the temperature in Kelvin.
2. Taking the Natural Logarithm:
To analyze the equation, we can take the natural logarithm of both sides:
lnk=lnA−EaRT
This shows that lnk is a linear function of 1T.
3. Identifying the Relationship:
From the equation, we see that as the temperature T increases, the term EaRT decreases, leading to an increase in k. Therefore, k increases exponentially with increasing T.
4. Graphical Representation:
- If we plot k versus T, we expect to see an exponential increase in k as T increases.
- This means the graph should show a steep upward curve, indicating that k increases rapidly with temperature.
5. Analyzing Given Plots:
- Look for a plot that shows k increasing sharply as T increases.
- The correct plot will not be linear or show a gradual increase; instead, it will exhibit an exponential rise.
6. Conclusion:
After analyzing the provided plots, the one that shows an exponential increase in k with increasing T is the plot that follows the Arrhenius equation.
Final Answer:
The plot that follows the Arrhenius equation is option A.
The Arrhenius equation is given by:
k=Ae−EaRT
where:
- k is the rate constant,
- A is the pre-exponential factor,
- Ea is the activation energy,
- R is the universal gas constant,
- T is the temperature in Kelvin.
To analyze the equation, we can take the natural logarithm of both sides:
lnk=lnA−EaRT
This shows that lnk is a linear function of 1T.
From the equation, we see that as the temperature T increases, the term EaRT decreases, leading to an increase in k. Therefore, k increases exponentially with increasing T.
- If we plot k versus T, we expect to see an exponential increase in k as T increases.
- This means the graph should show a steep upward curve, indicating that k increases rapidly with temperature.
- Look for a plot that shows k increasing sharply as T increases.
- The correct plot will not be linear or show a gradual increase; instead, it will exhibit an exponential rise.
After analyzing the provided plots, the one that shows an exponential increase in k with increasing T is the plot that follows the Arrhenius equation.
The plot that follows the Arrhenius equation is option A.
Topper's Solved these Questions
- CHEMICAL KINETICSBOOK - CENGAGE CHEMISTRYCHAPTER - CHEMICAL KINETICSEXERCISE - Archives Integer
2 Videos
- CHEMICAL KINETICSBOOK - CENGAGE CHEMISTRYCHAPTER - CHEMICAL KINETICSEXERCISE - Archives Fill In The Blanks
4 Videos
- CHEMICAL KINETICSBOOK - CENGAGE CHEMISTRYCHAPTER - CHEMICAL KINETICSEXERCISE - Archives Multiple Correct
5 Videos
- CARBOXYLIC ACIDS AND THEIR DERIVATIVESBOOK - CENGAGE CHEMISTRYCHAPTER - CARBOXYLIC ACIDS AND THEIR DERIVATIVESEXERCISE - Exercises Archives (Analytical And Descriptive)
34 Videos
- COORDINATION COMPOUNDSBOOK - CENGAGE CHEMISTRYCHAPTER - COORDINATION COMPOUNDSEXERCISE - Archives Subjective
18 Videos
Similar Questions
Which one of the following given graphs represents the variation of rate constant (k) with temperature (t) for an endothermic reaction ?
View SolutionWhich one of the following given graphs represents the variation of rate constant (k) with temperature (f) for an endothermic reaction ?
View Solution
Knowledge Check
Plots showing the variation of the rate constant (k) with temperature (T) are given below. The plot that follows the Arrhenius equation is
A B
B C
C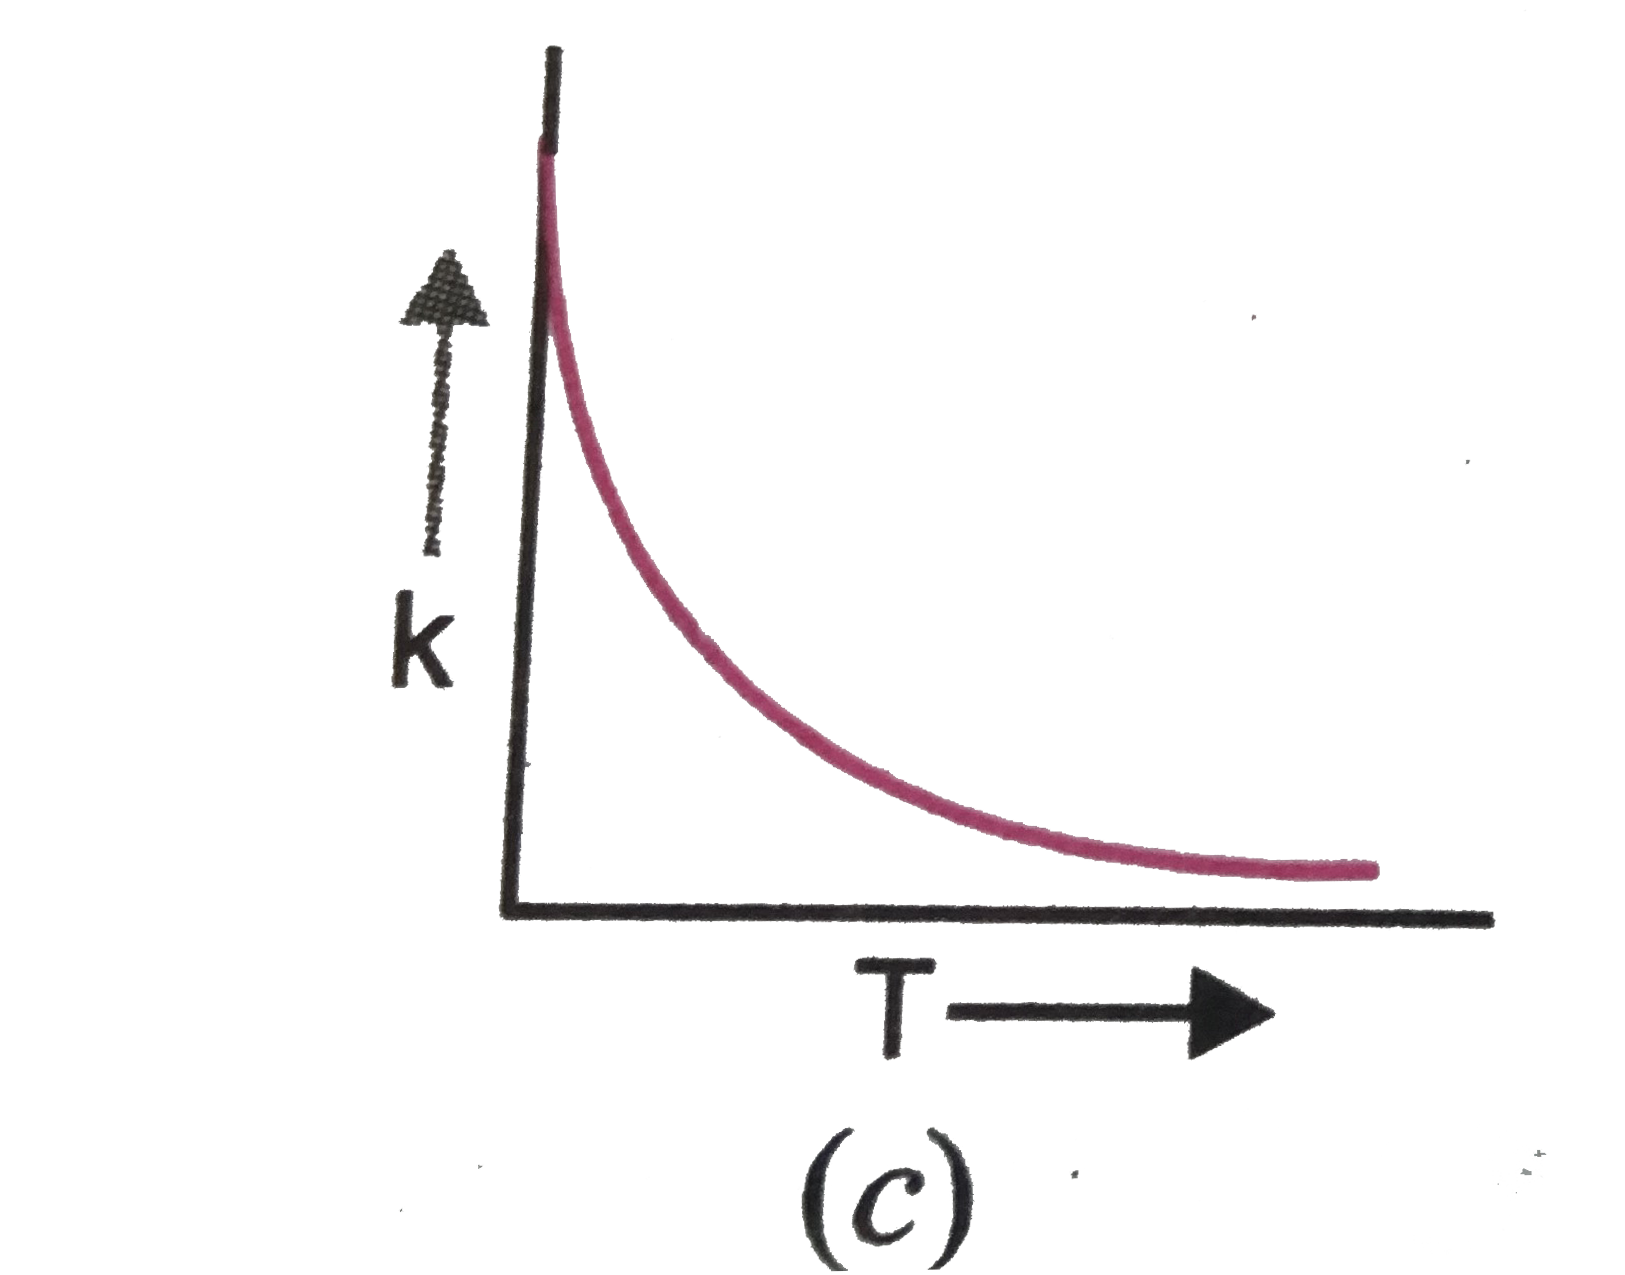 D
D
Plots showing the variation of the rate constant (k) with temperature (T) are given below. The plot that follows the Arrhenius equation is
A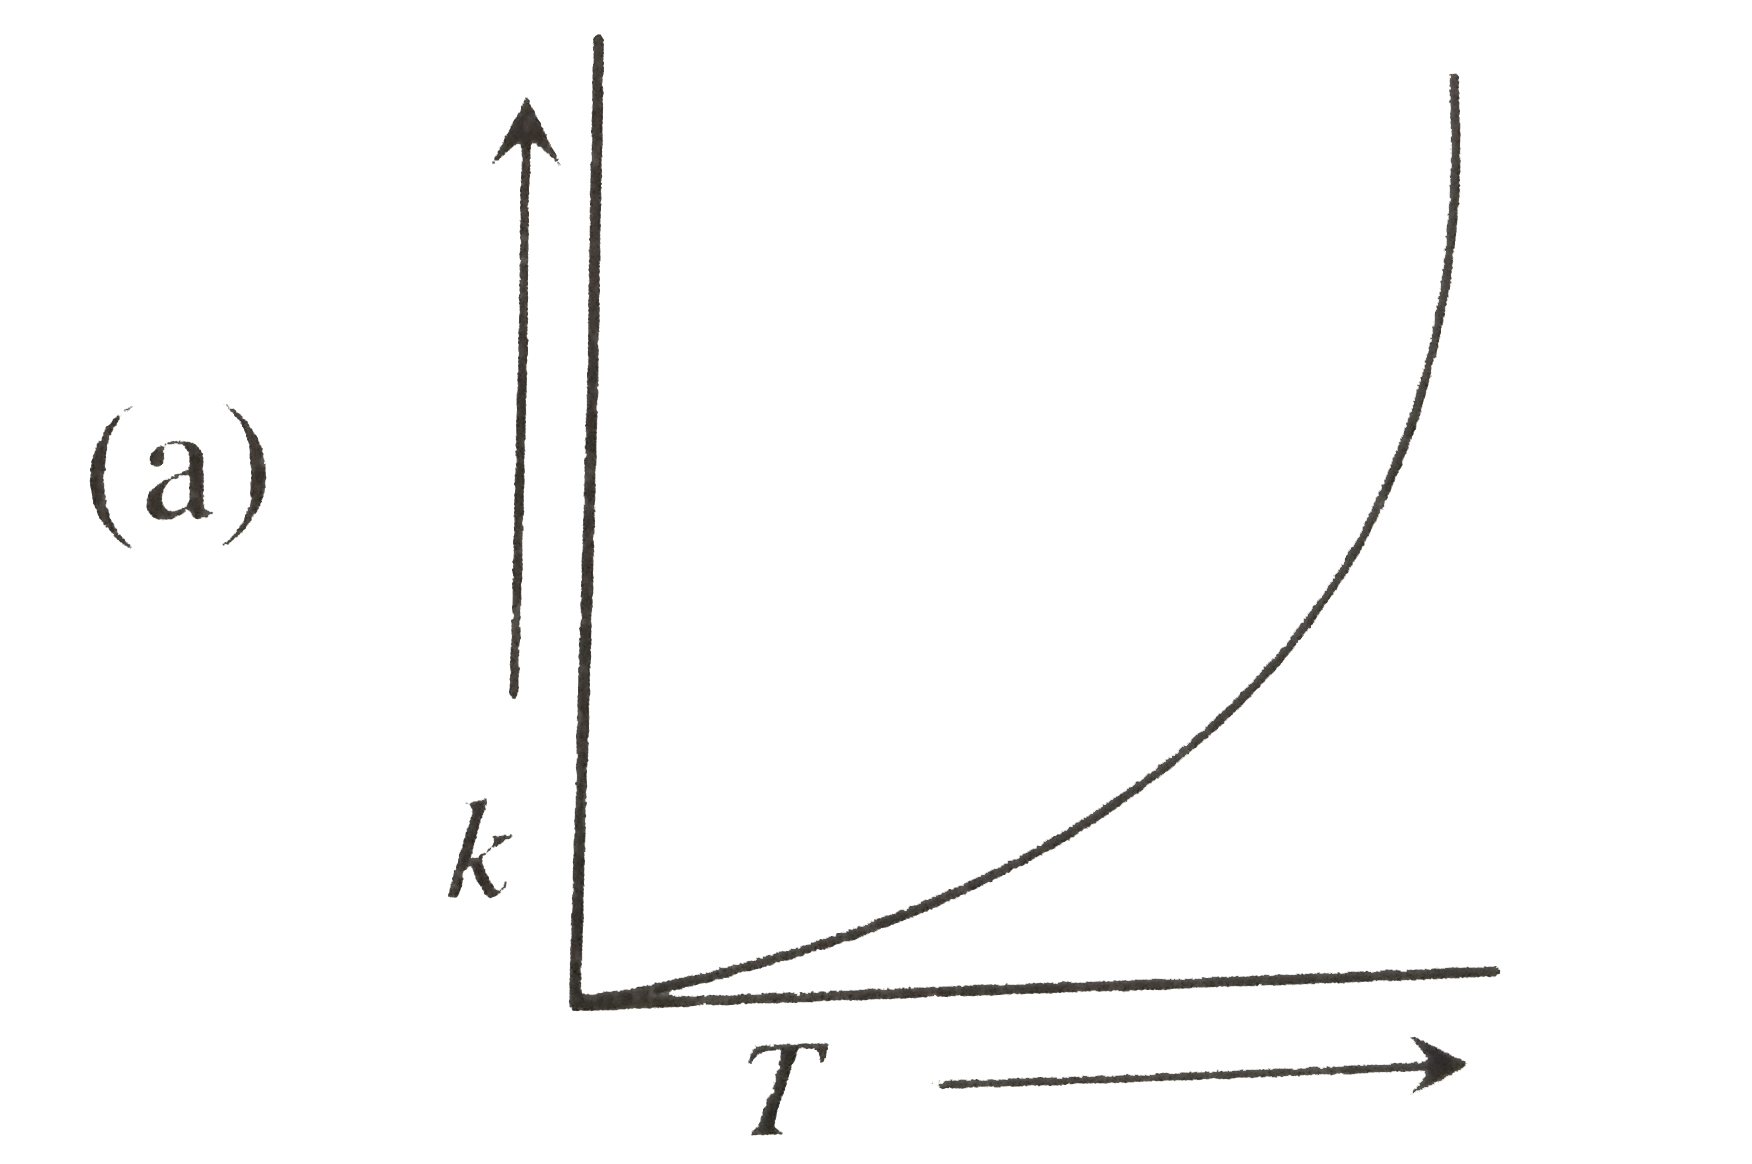 B
B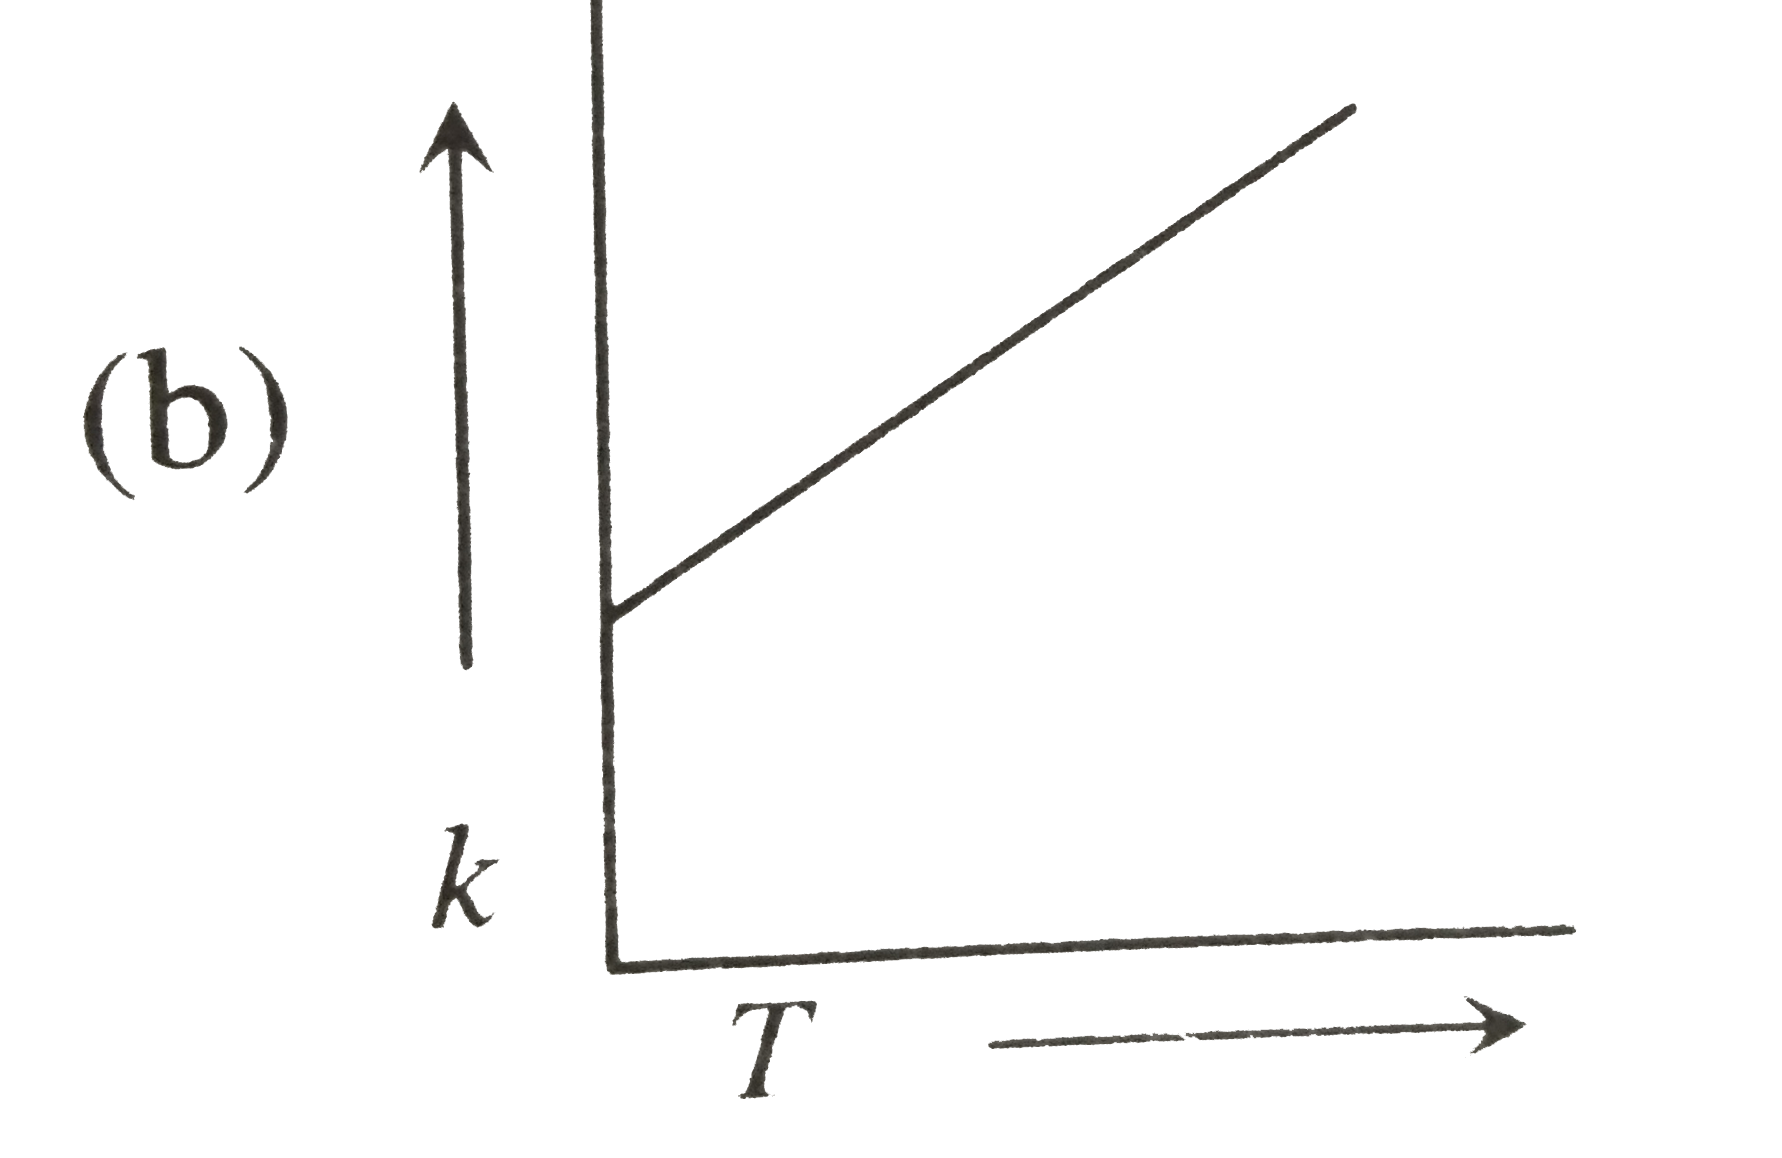 C
C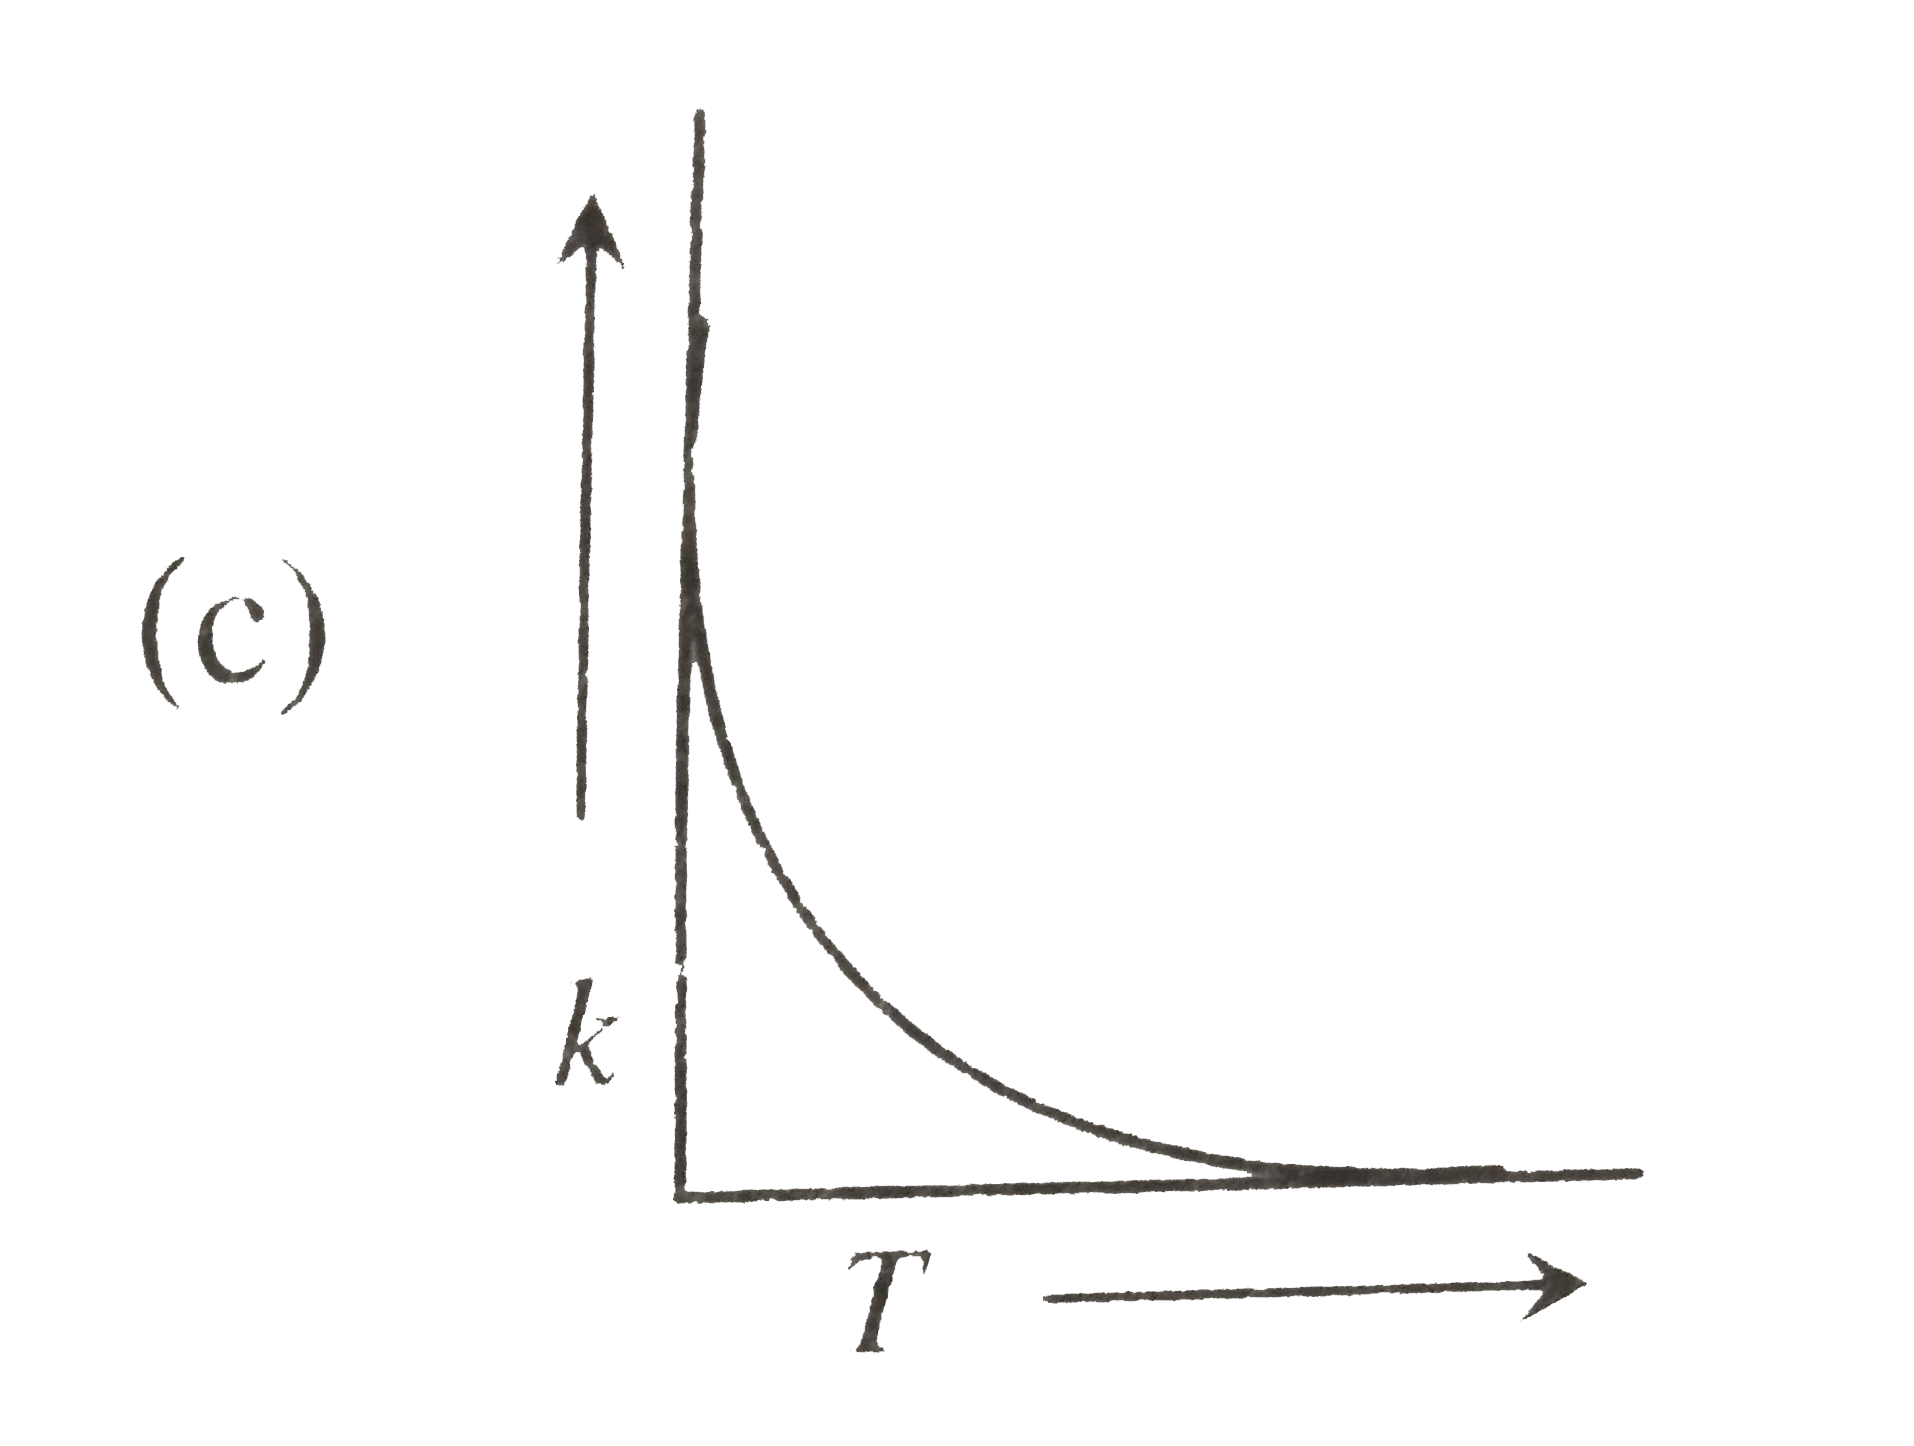 D
D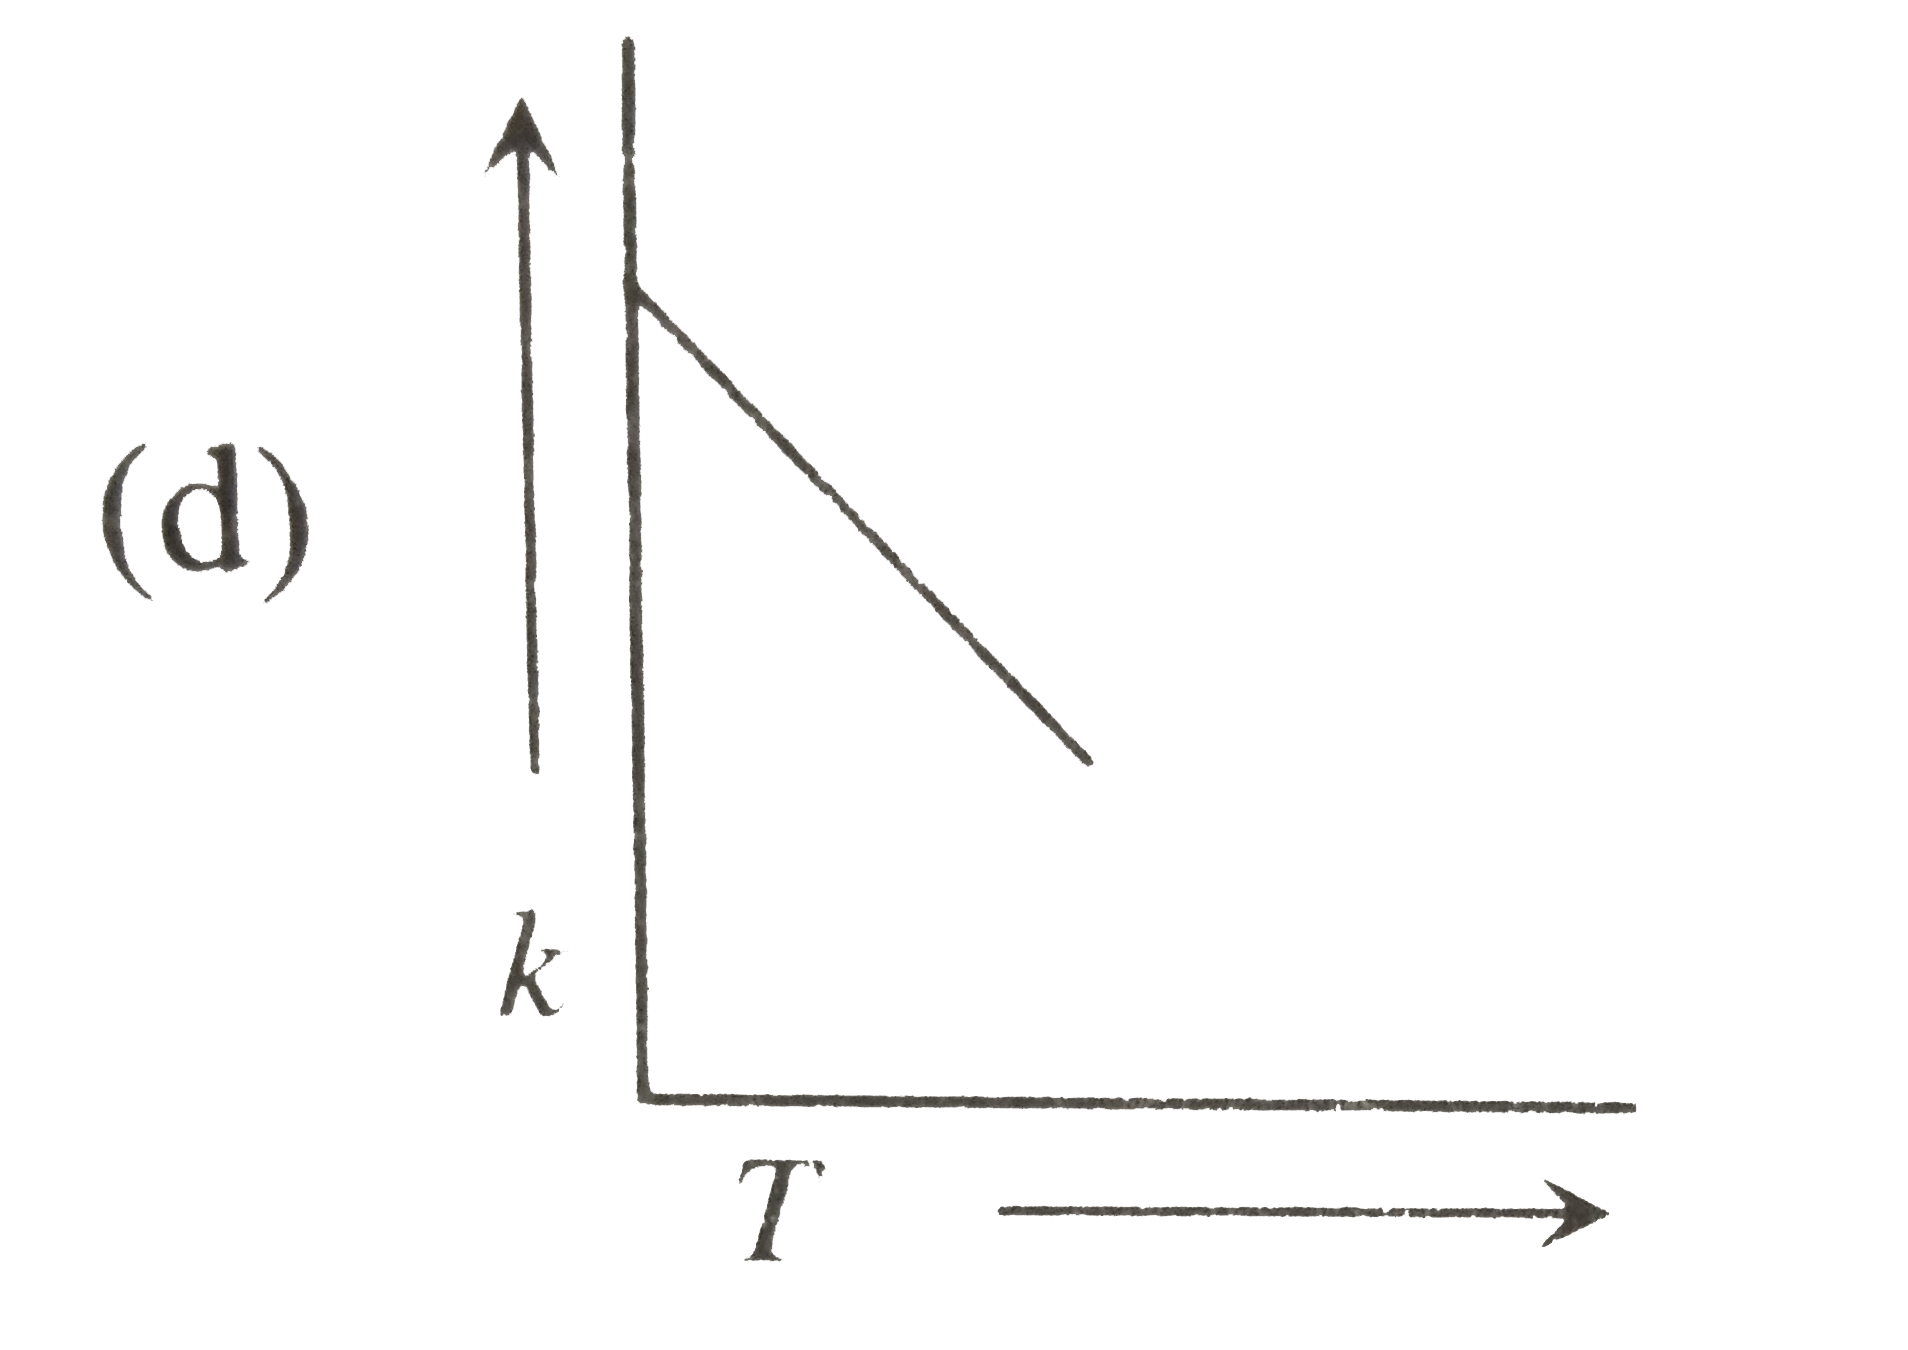
Plots showing the variation of the rate constant (k) with temperature (T) are given below. The plot that follows Arrhenius equations is
A B
B C
C D
D
The variation of rate constant with temperature is given by the integrated from of the Arrhenius equation, log10k=−Ea2.303RT + constant
where k = rate cosntant and Ea is the experimental activation energy. If for a certain reaction, log10k=−3163.0T+11.899, calculate Ea.
View SolutionWhich of the following graph is incorrect for variation of rate constant (K) with temperature for a reaction obeying Arrhenius equation ?
View SolutionAccroding to Arrhenius equation, the rate constnat (k) is related to temperature (T)as
View SolutionThe variation of rate constant with temperature can be explained by Arrhenius equation. However , the can be explained by Activation energy is found to be temperature dependent/In such cases dinKdT=EaRT2 should be used to predict variation of rate constant with tempreature. On the basic of this information , answer the question that follow :
If Arrhenius constant and Ea (activation energy0 are assumed to be constant then which of the following graph will be correct
View SolutionThe variation of rate constant with temperature can be explained by Arrhenius equation. However , the can be explained by Activation energy is found to be temperature dependent/In such casesdinKdT=EaRT2 should be used to predict variation of rate constant with tempreature. On the basic of this information , answer the question that follow :
If for a reaction in K=20−20T+3 in T then Ea at 300 K will be
View Solution
