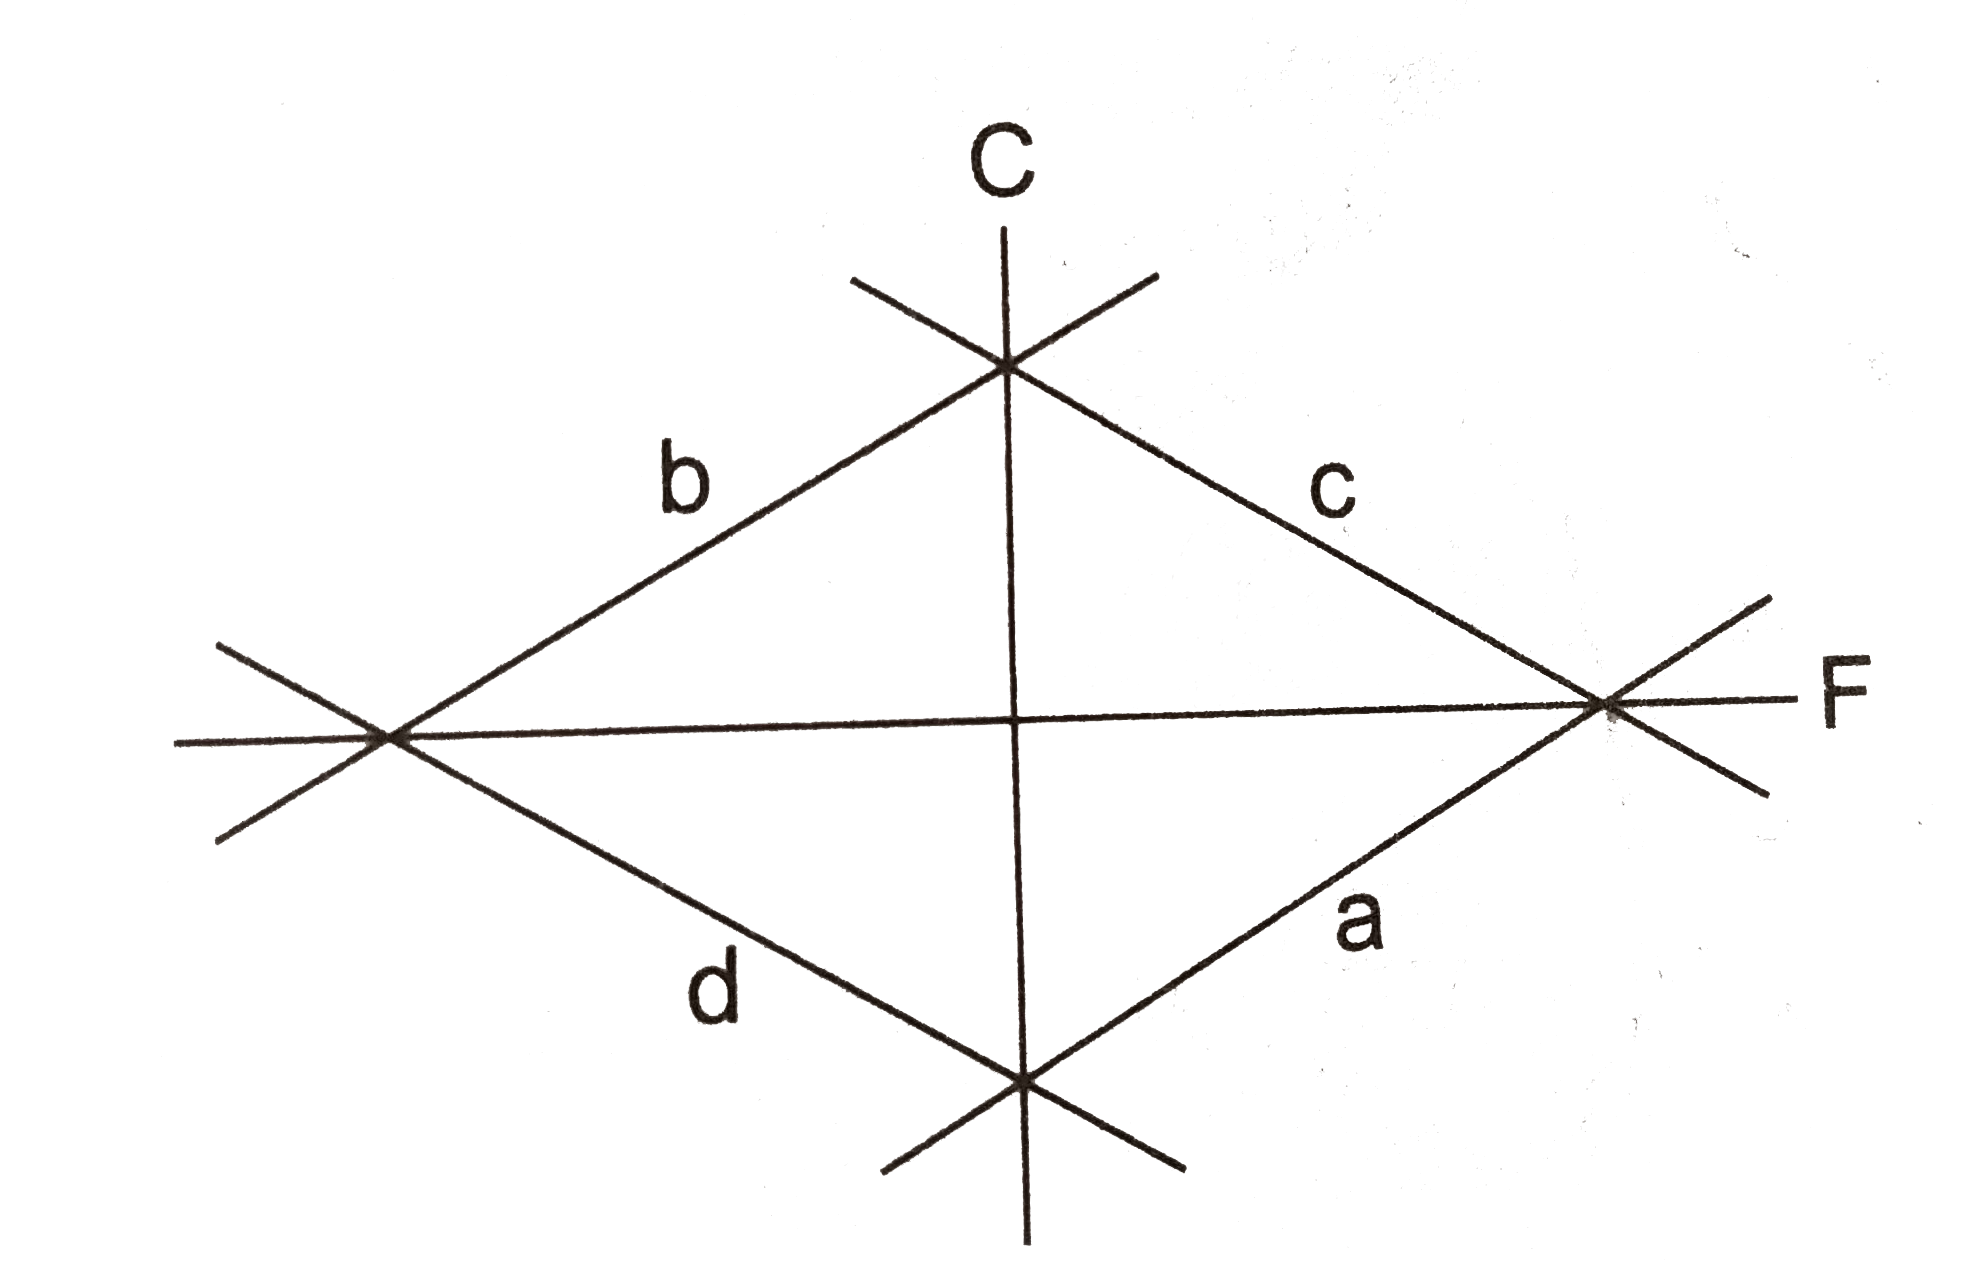
Which curve in figure represents the curve of ideal gas ?
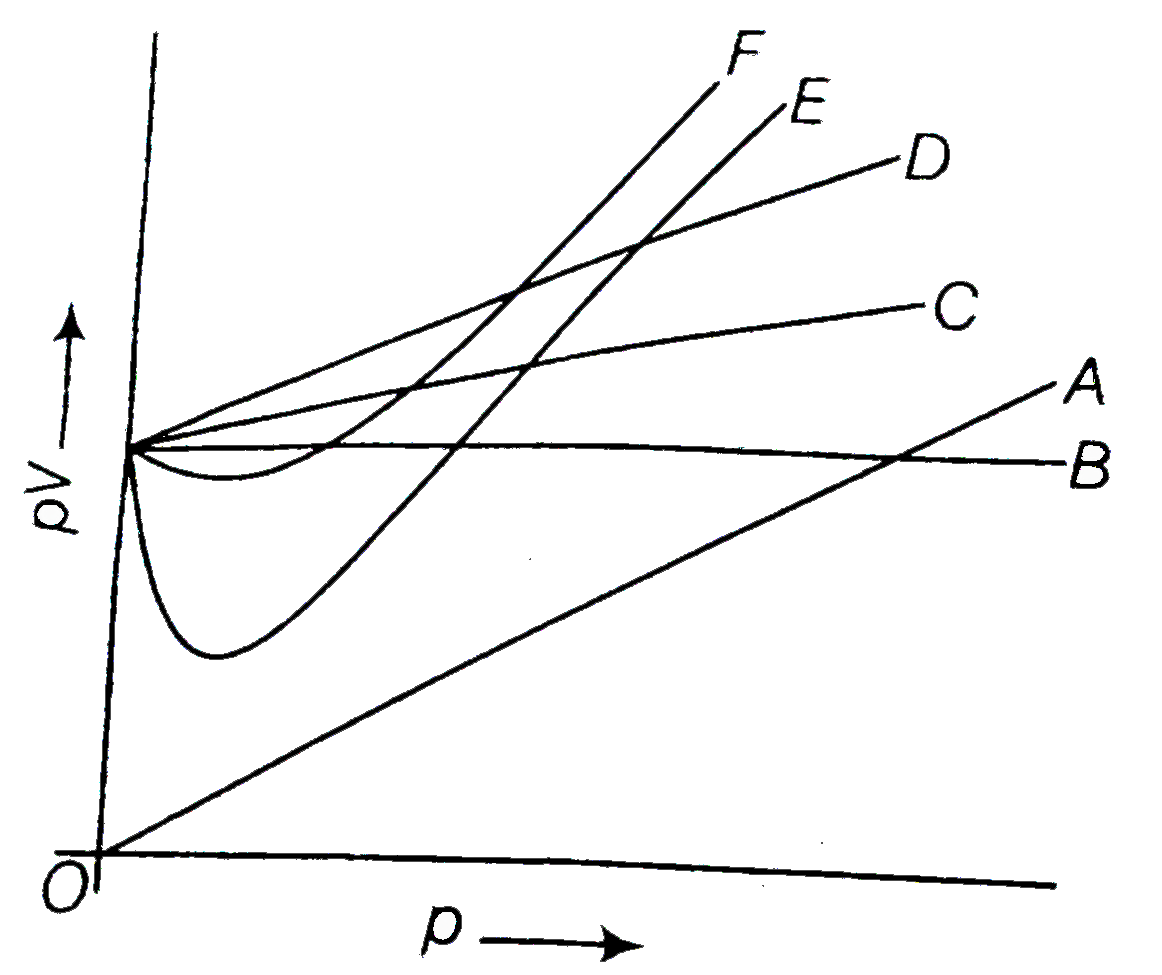
Only B
C and D
E and F
A and B
The correct Answer is:A
For ideal gas pV = constant at all pressures. Therefore, only B represents ideal gas.With increase of temperature, the kinetic energy of the molecules of liquid increases which can overcome the intermolecular forces. Hence, the liquid start flowing.
In other word the viscosity of a liquid decreases with increase in temperature. It has been found that the decrease is about 2% per degree rise in temperature.
Topper's Solved these Questions
- STATES OF MATTERBOOK - NCERT EXEMPLAR ENGLISHCHAPTER - STATES OF MATTEREXERCISE - MCQ More Than One Option
4 Videos
- STATES OF MATTERBOOK - NCERT EXEMPLAR ENGLISHCHAPTER - STATES OF MATTEREXERCISE - Short Answer Type Question
23 Videos
- SOME BASIC CONCEPTS OF CHEMISTRYBOOK - NCERT EXEMPLAR ENGLISHCHAPTER - SOME BASIC CONCEPTS OF CHEMISTRYEXERCISE - All Questions
45 Videos
- STRUCTURE OF ATOMBOOK - NCERT EXEMPLAR ENGLISHCHAPTER - STRUCTURE OF ATOMEXERCISE - All Questions
55 Videos
Similar Questions
Knowledge Check
Which of the following graphs represent the behaviour of an ideal gas ?
A1.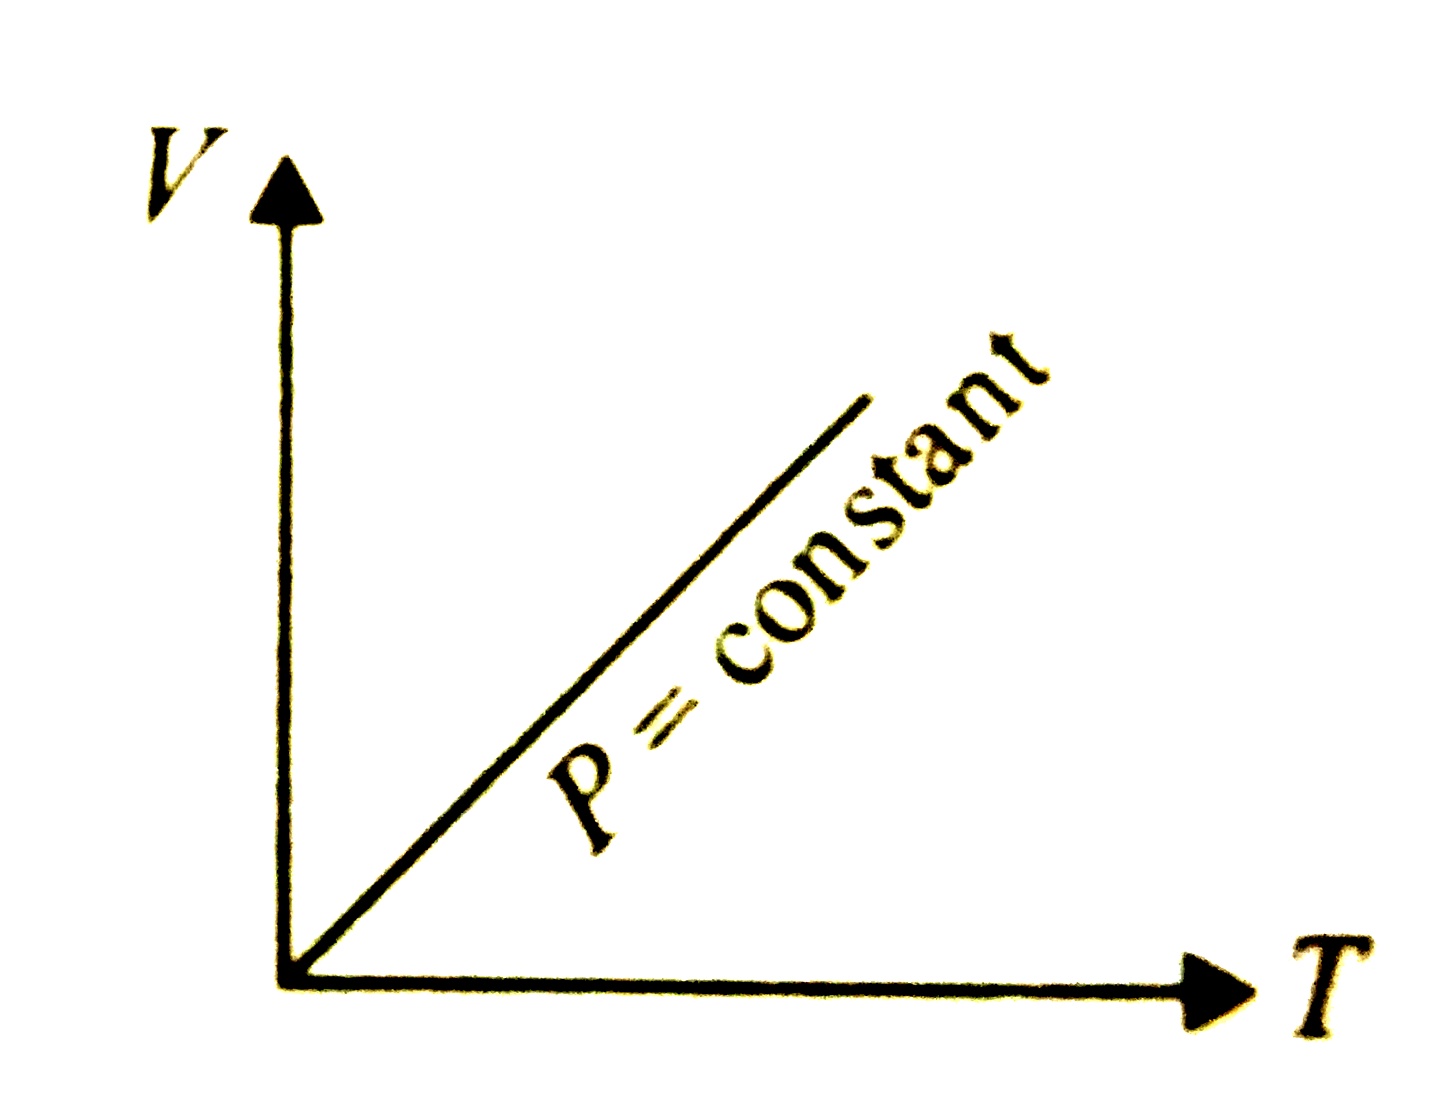 B2.
B2.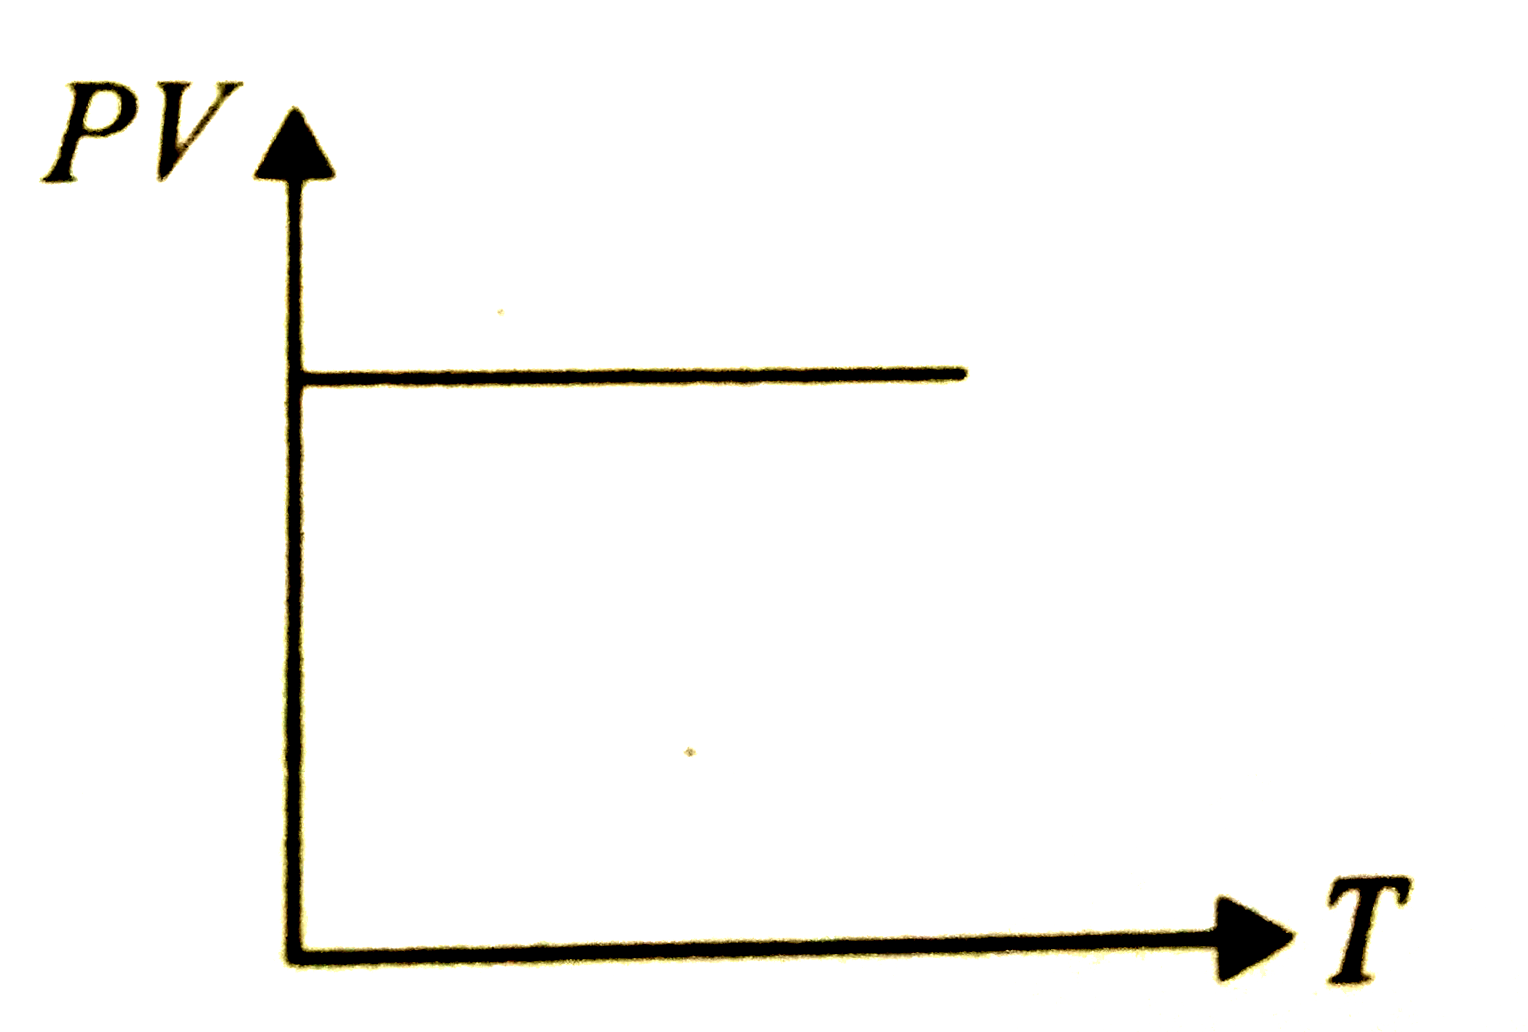 C3.
C3.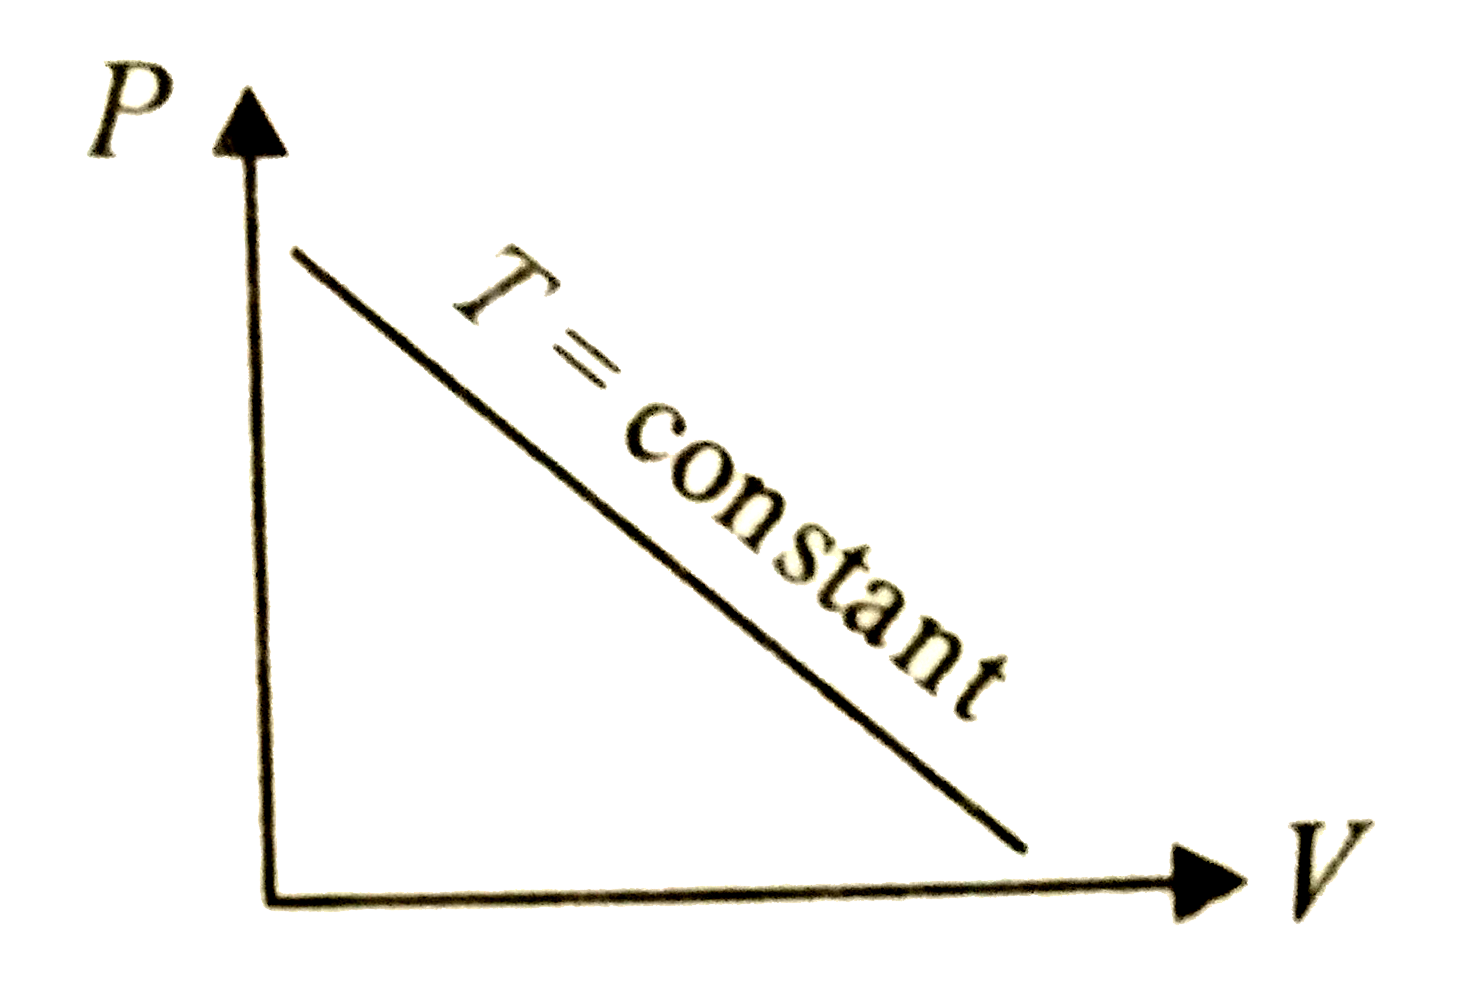 D4.
D4.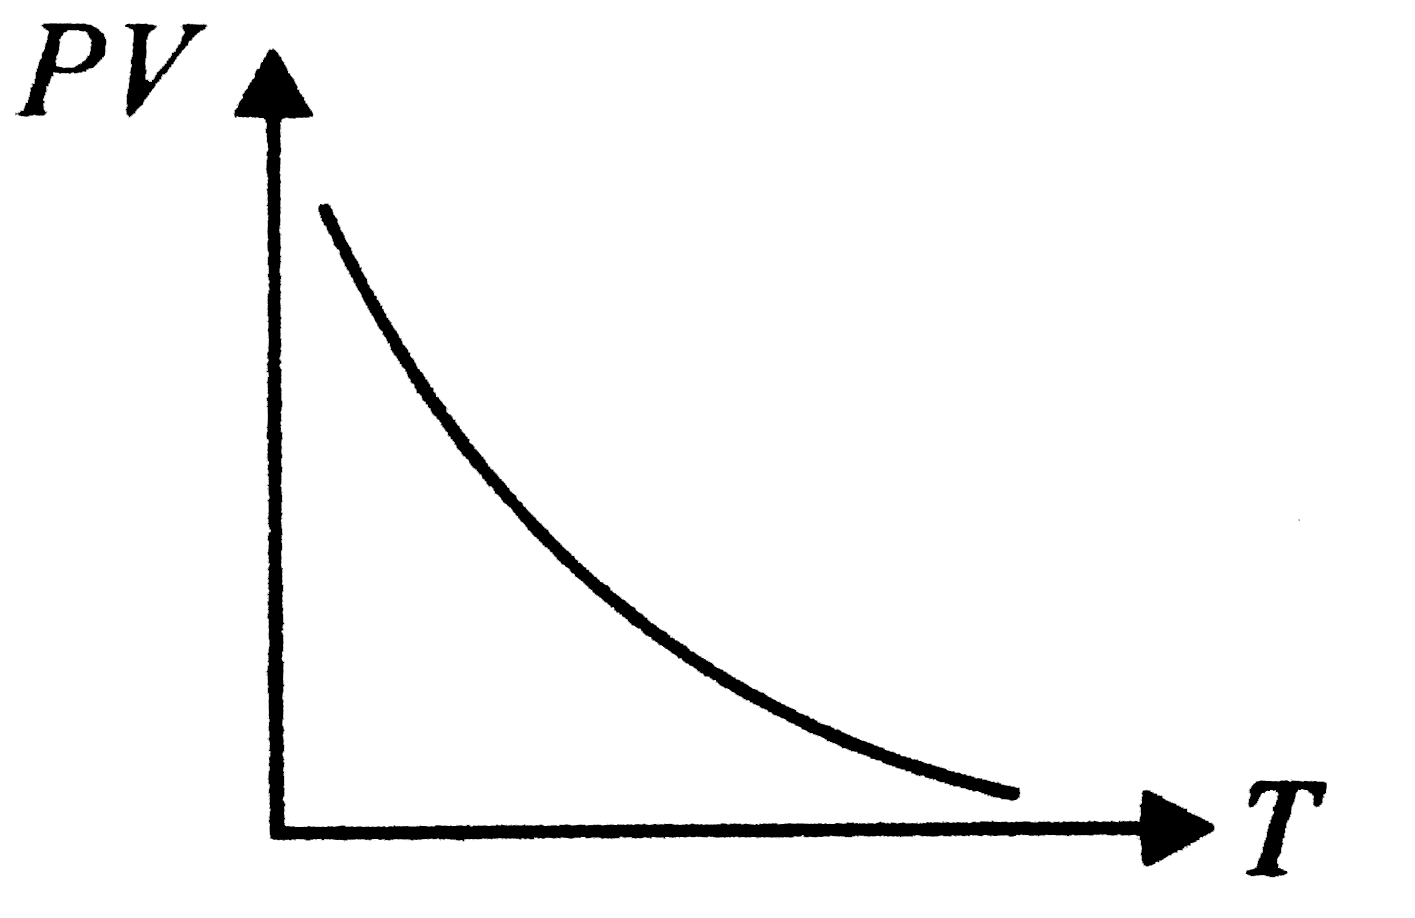
Consider p-V diagram for an ideal gas shown in figure.
Out of the following diagrams, which figure represents the T−p diagram ?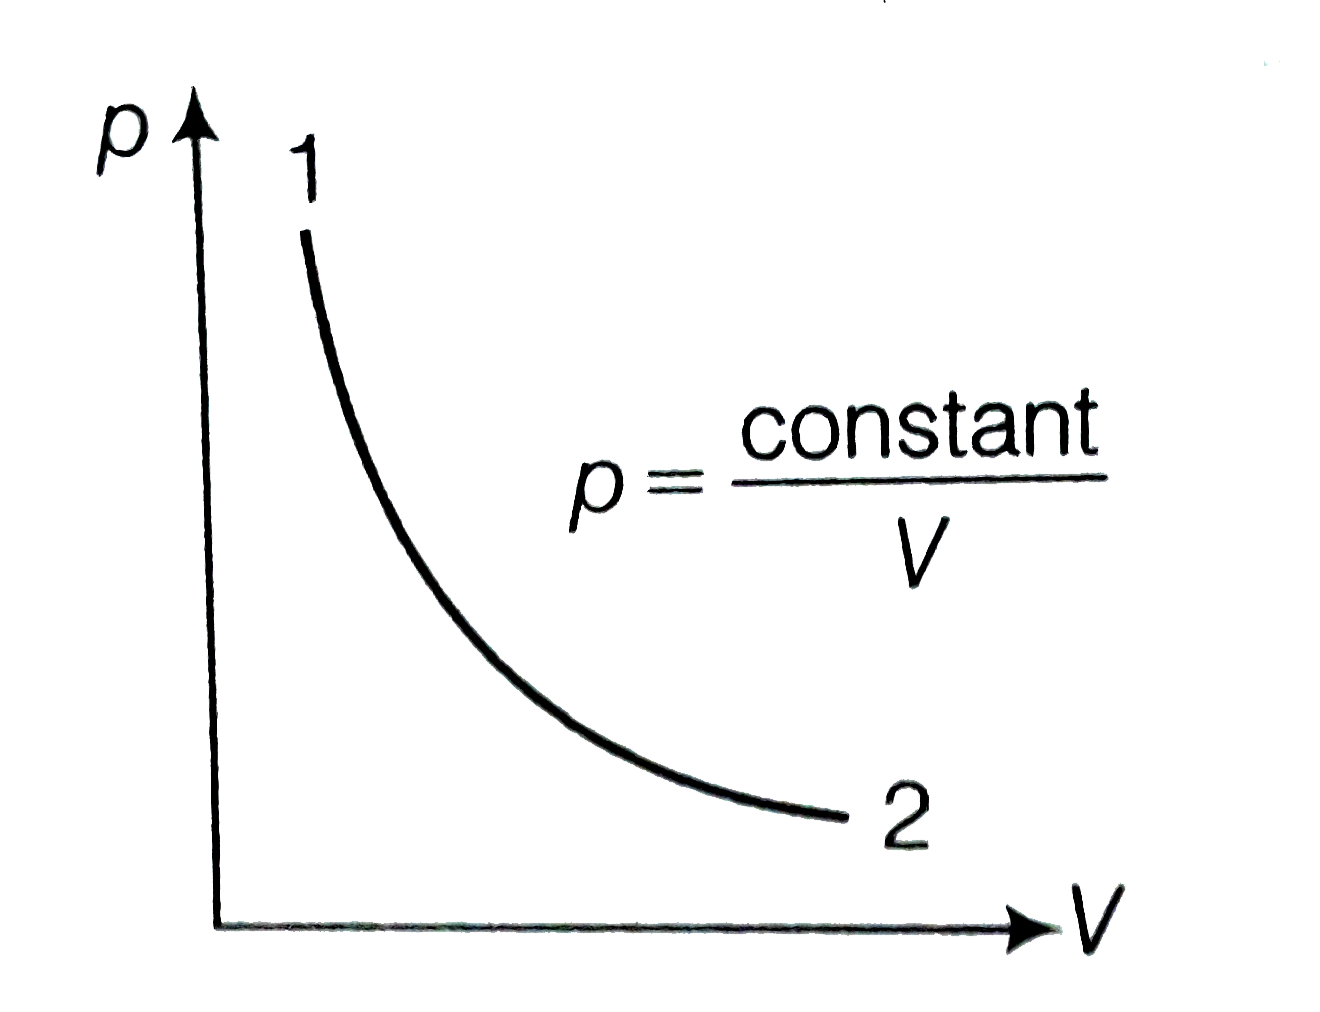
(i)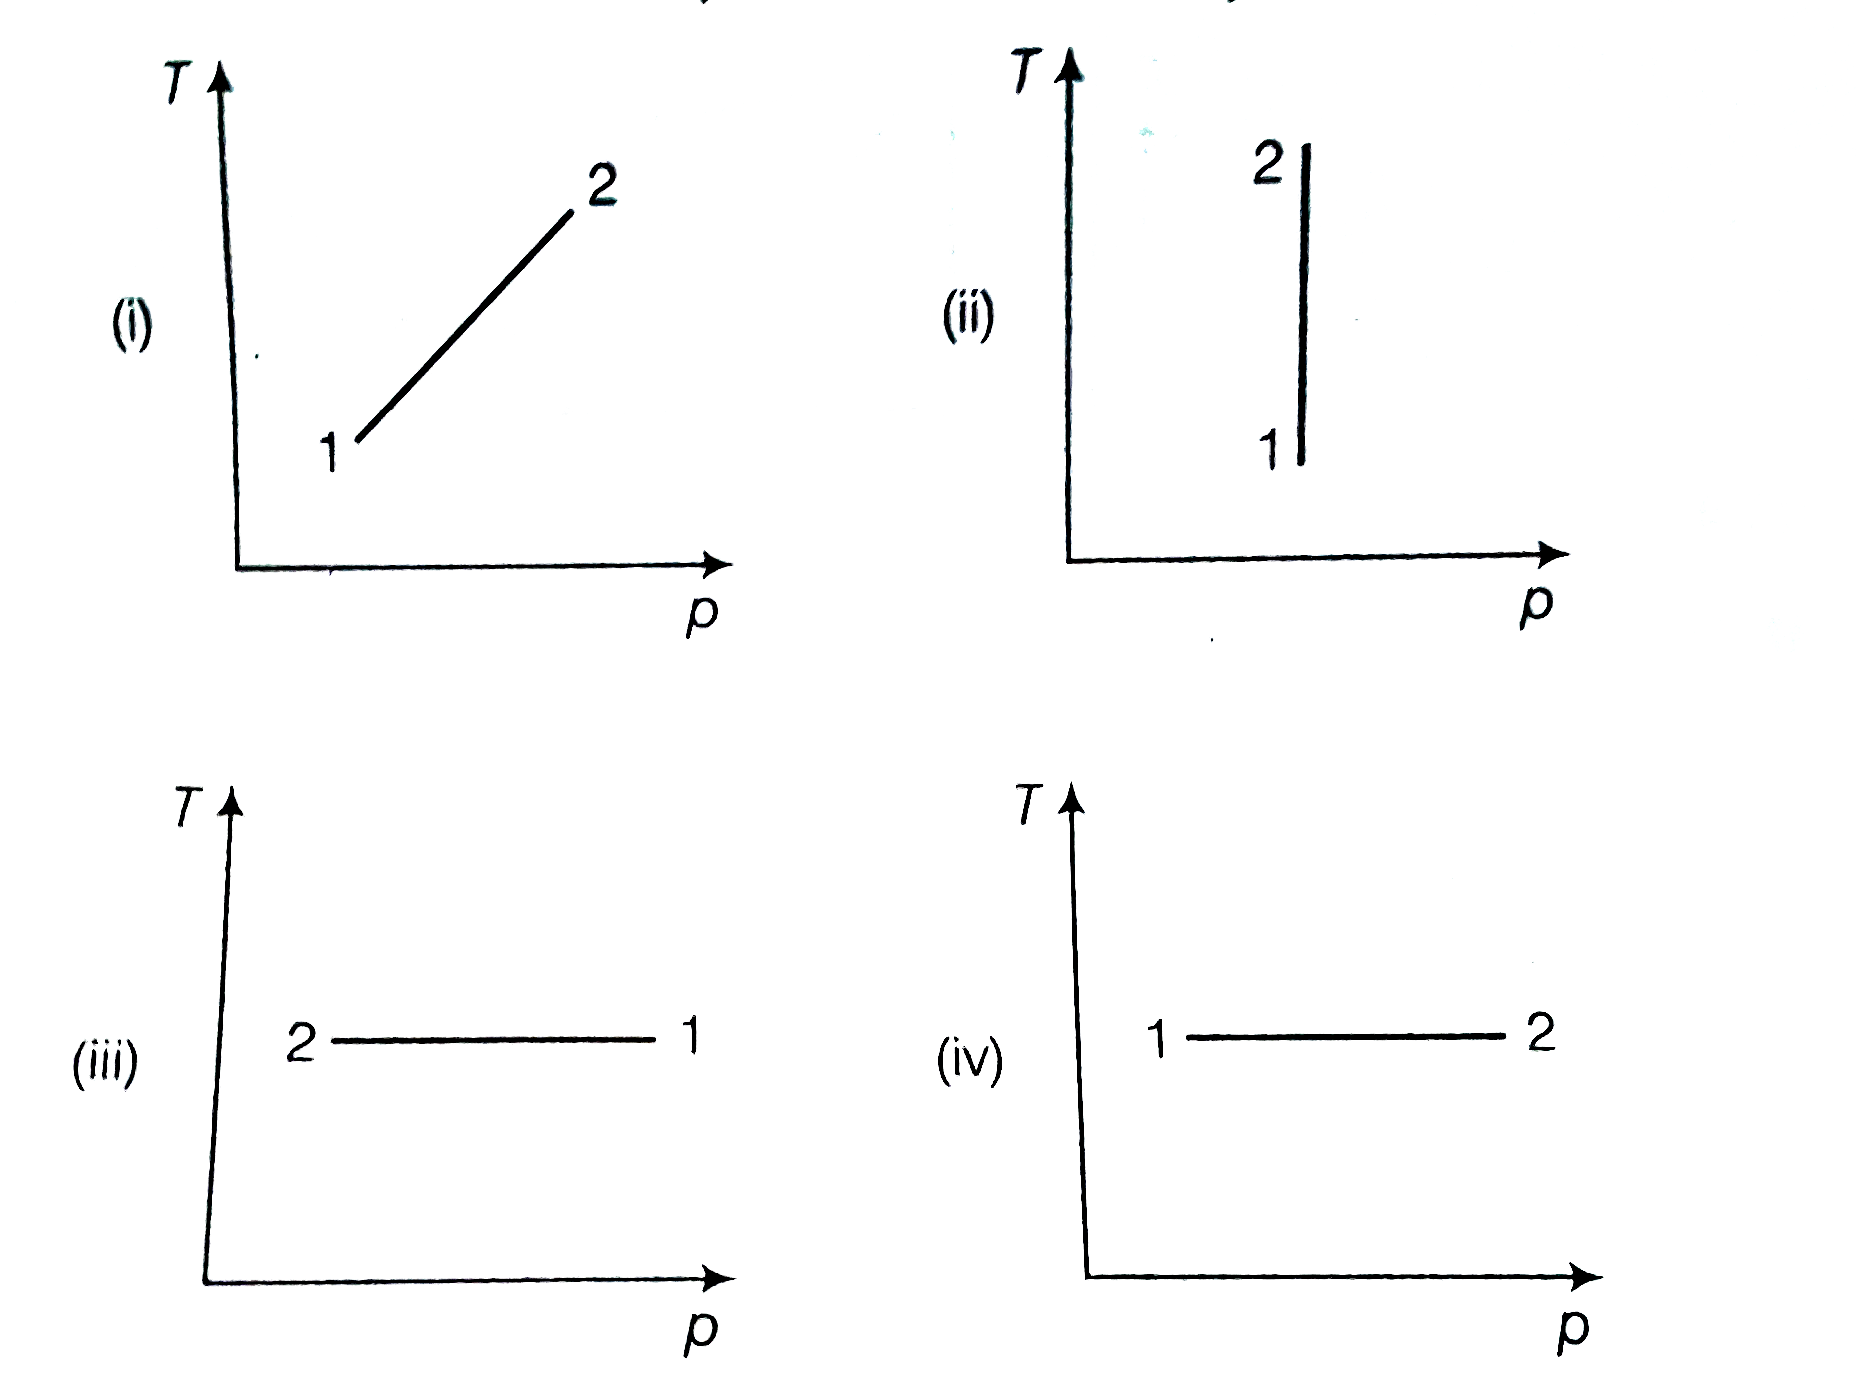 A(iv)B(ii)C(iii)D(i)
Which of the following curves represents the Henry's law ?
View SolutionConsider p-V diagram for an ideal gas shown in figure.

Out of the following diagrams, which figure represents the T−p diagram ?
(i)
View SolutionThe given curve represents the variation of temperature as a function of volume for one mole of an ideal gas. Which of the following curves best represents the variation of pressure as a function of volume?
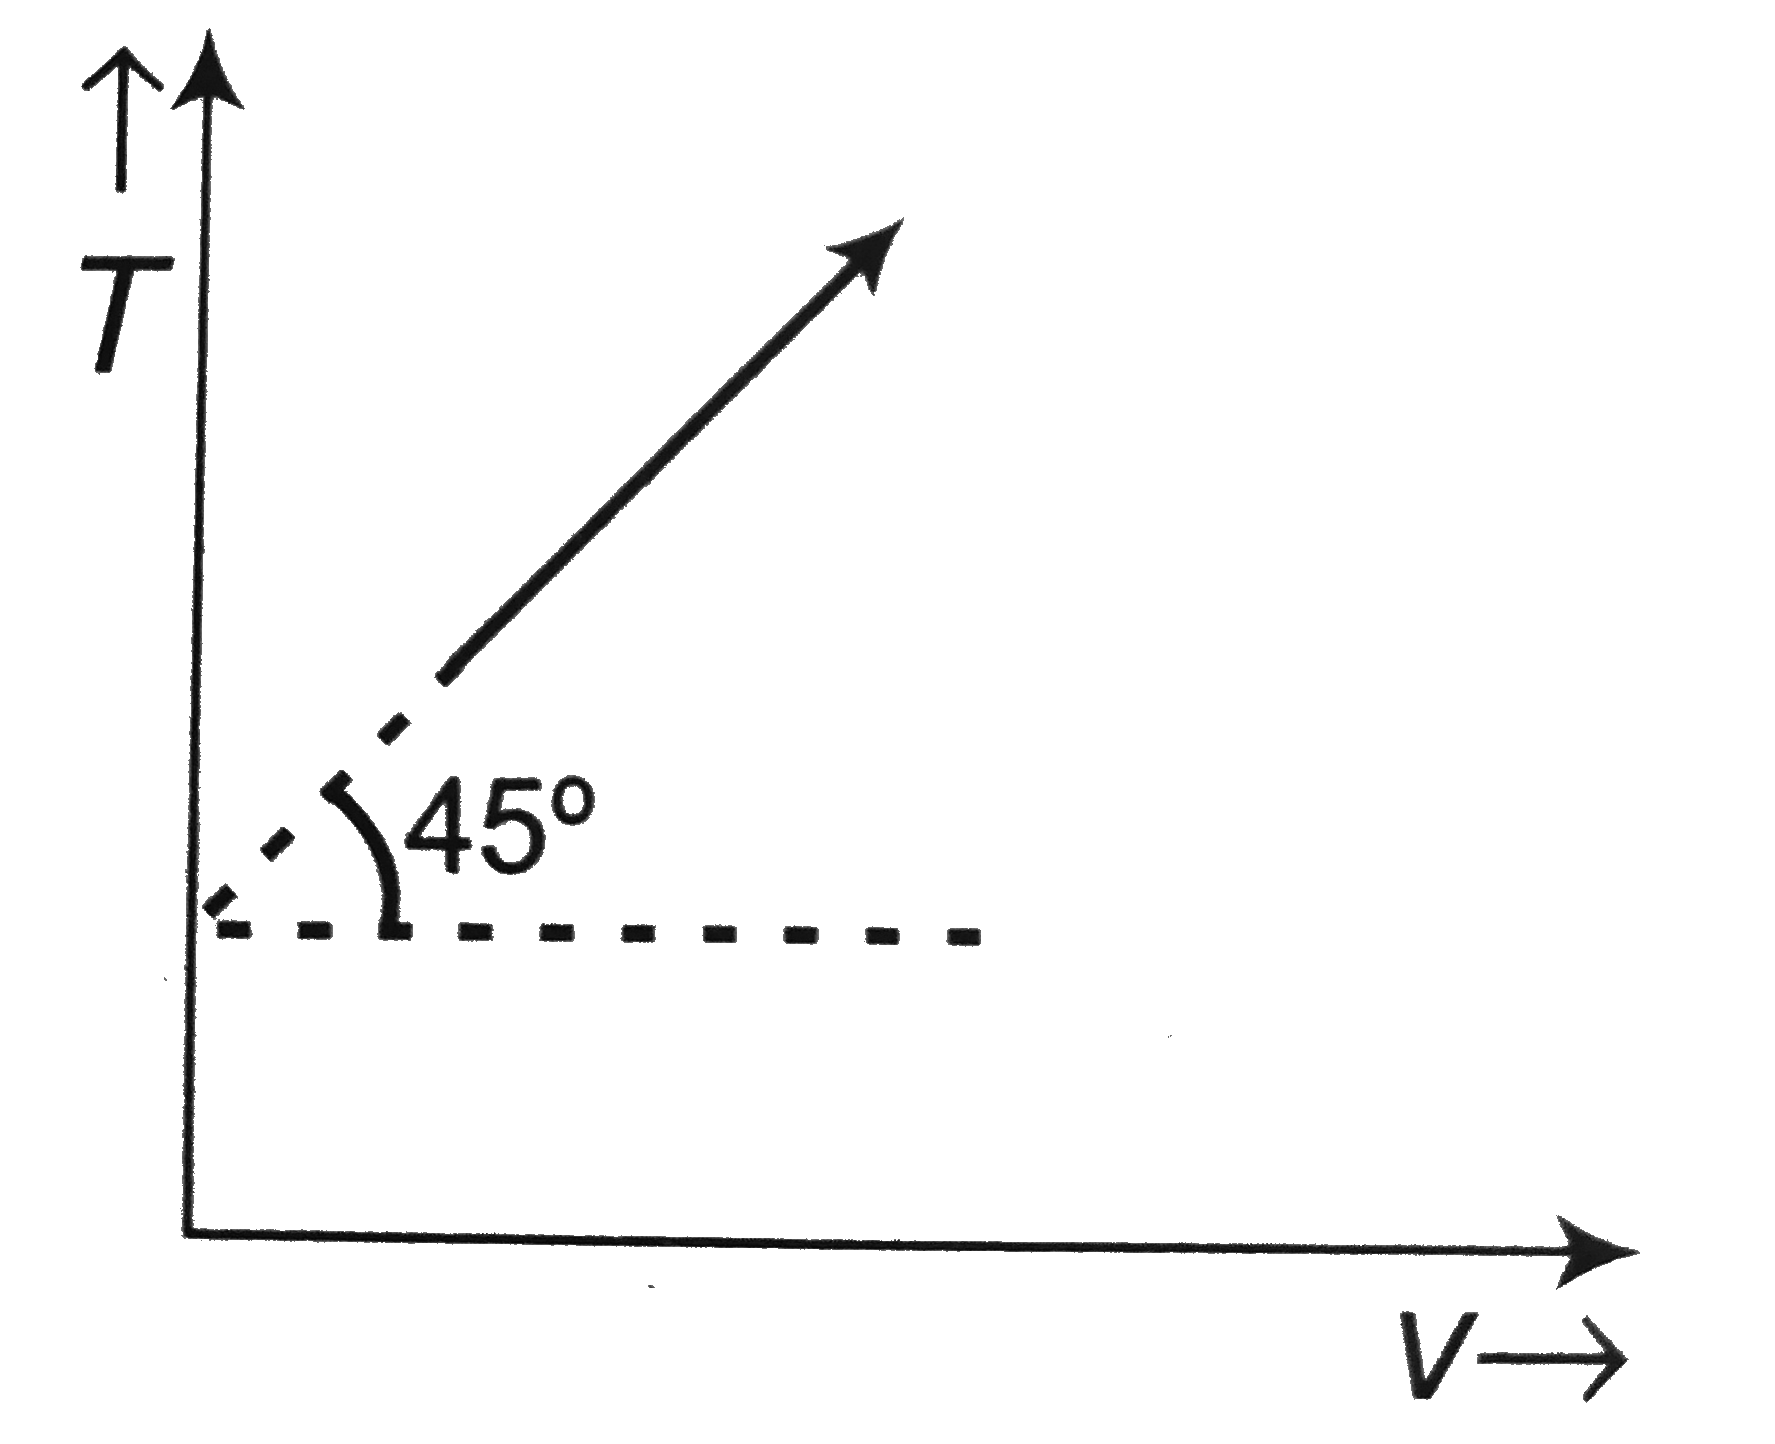
View SolutionThe given curve represents the variation of temperature as a function of volume for one mole of an ideal gas. Which of the following curves best represents the variation of pressure as a function of volume?

View SolutionThe given curve represents the variation of temperatue as a function of volume for one mole of an ideal gas. Which of the following curves best represents the variation of pressure as a function of volume ?
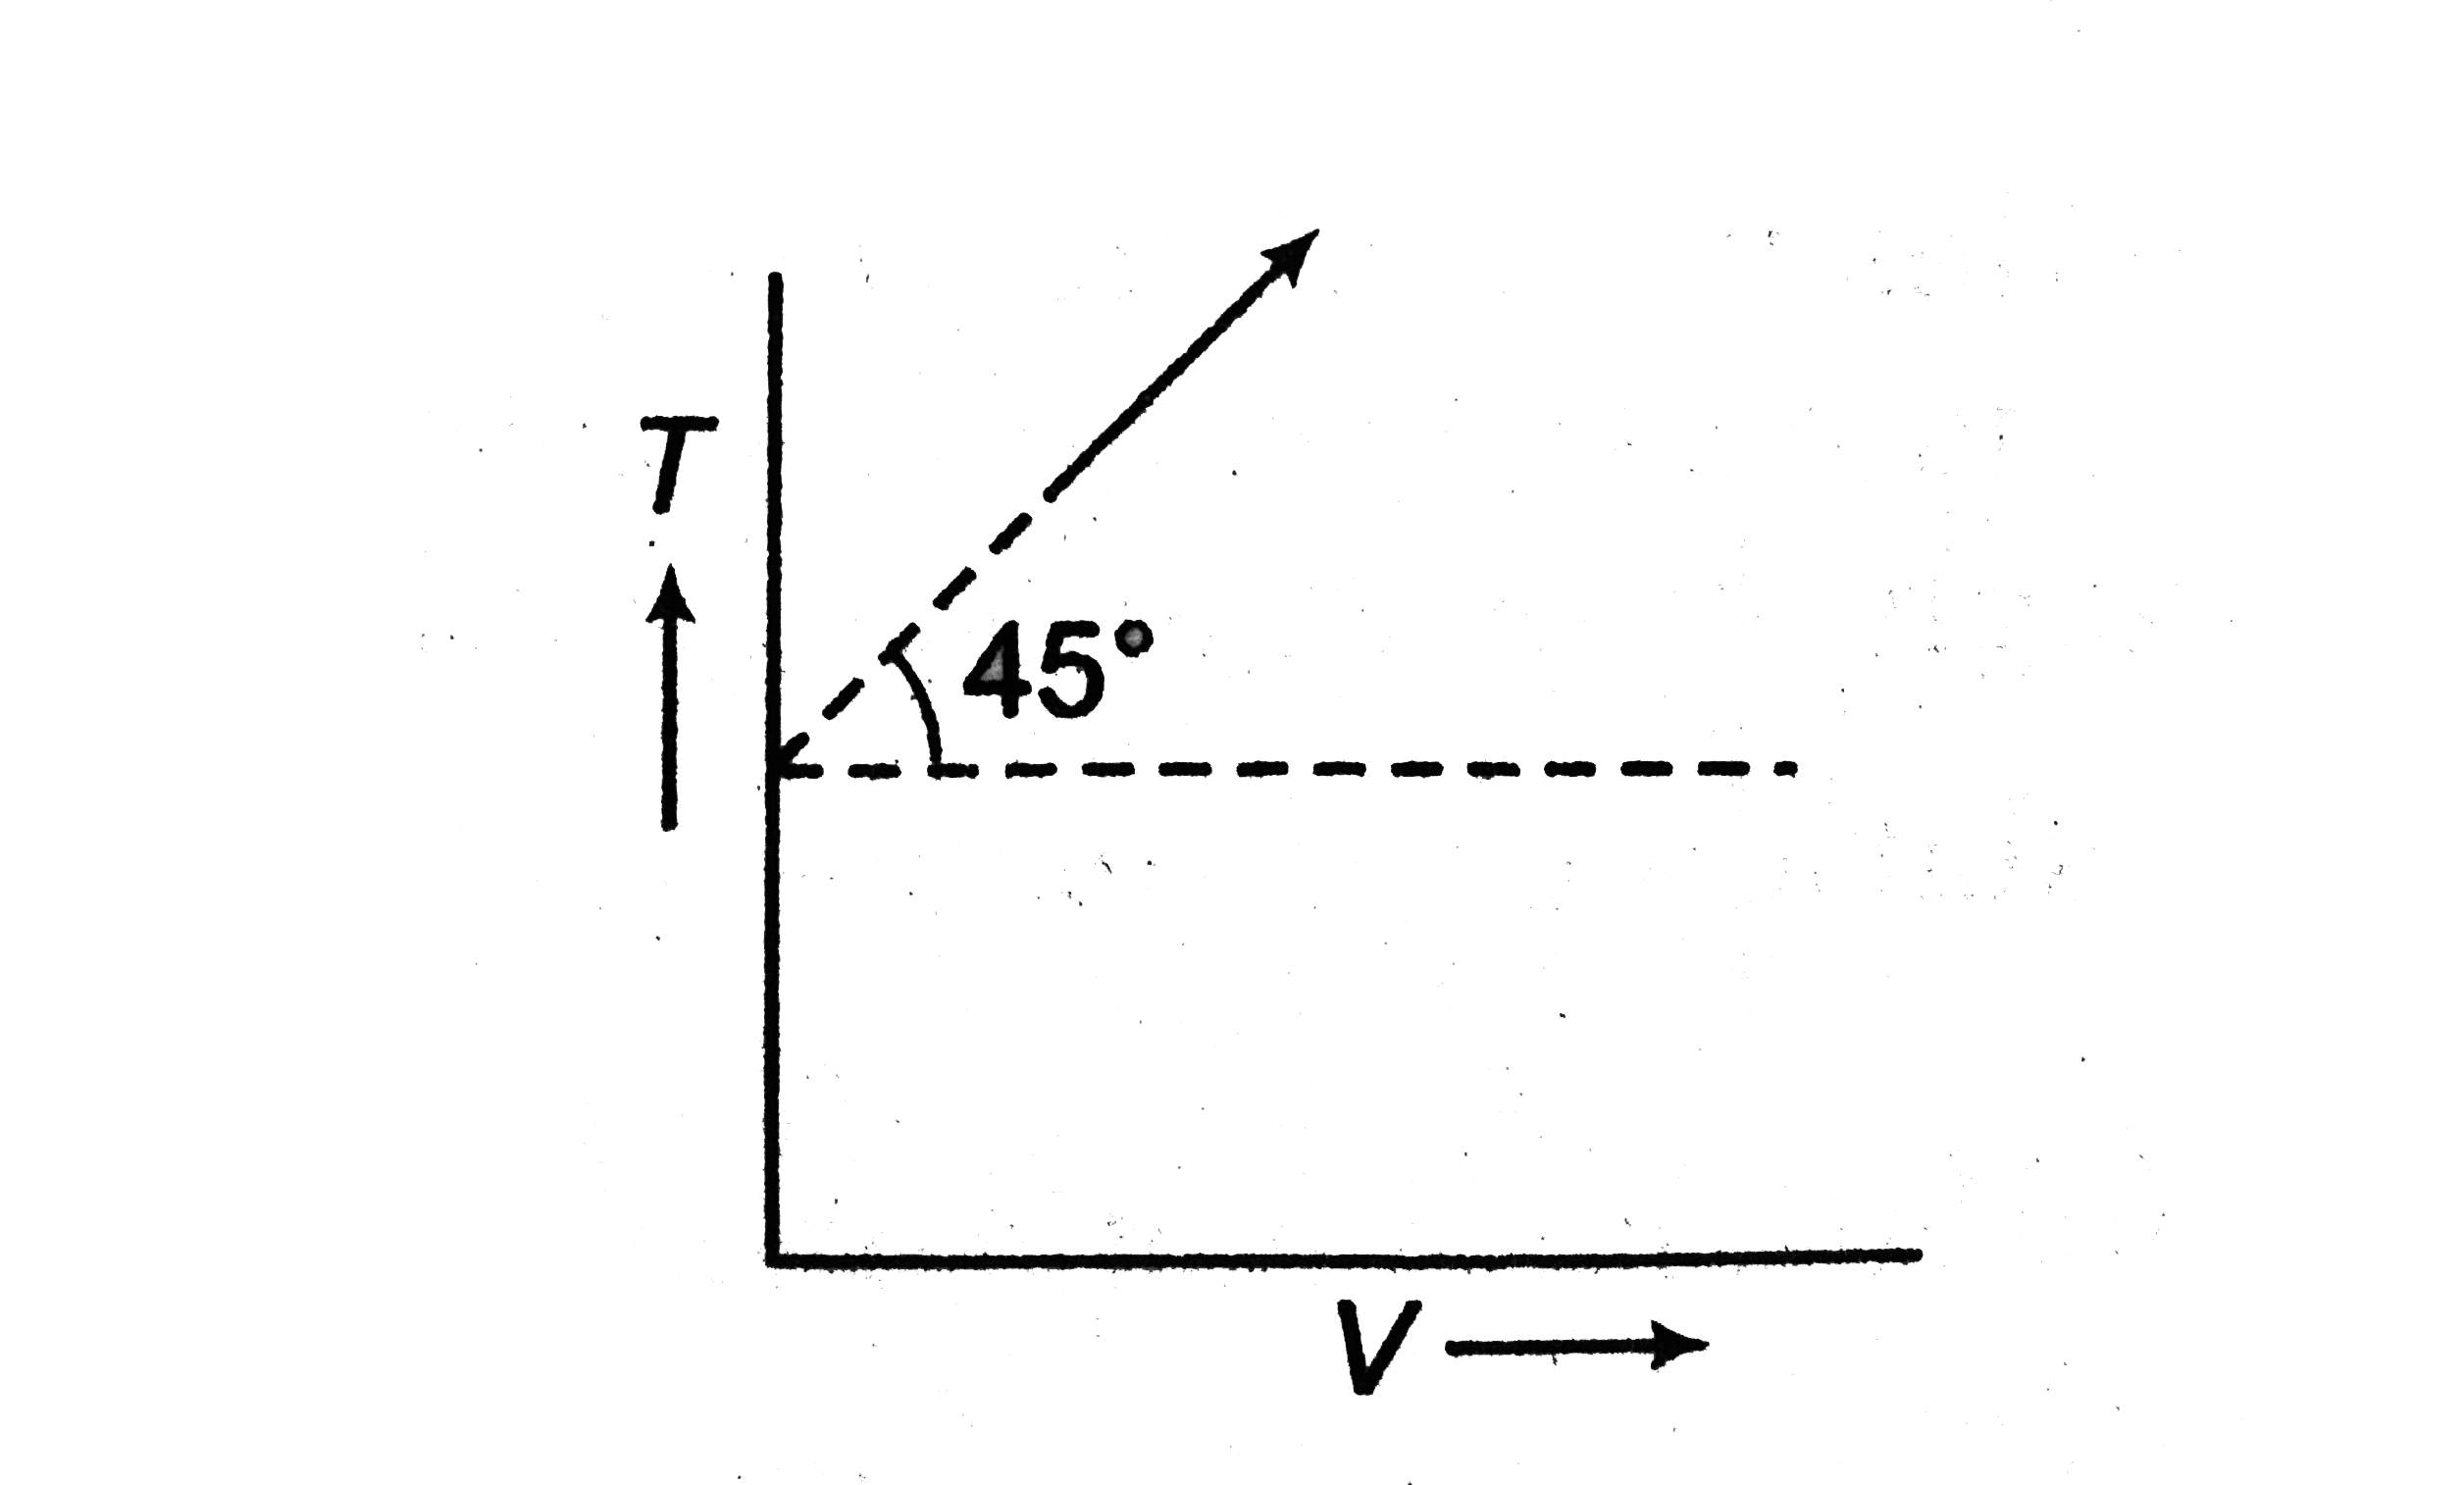 .
.
View SolutionThe given curve represents the variation of temperatue as a function of volume for one mole of an ideal gas. Which of the following curves best represents the variation of pressure as a function of volume ?
 .
.
View Solution

