Which of the following graphs is consistent with ideal gas behaviour?
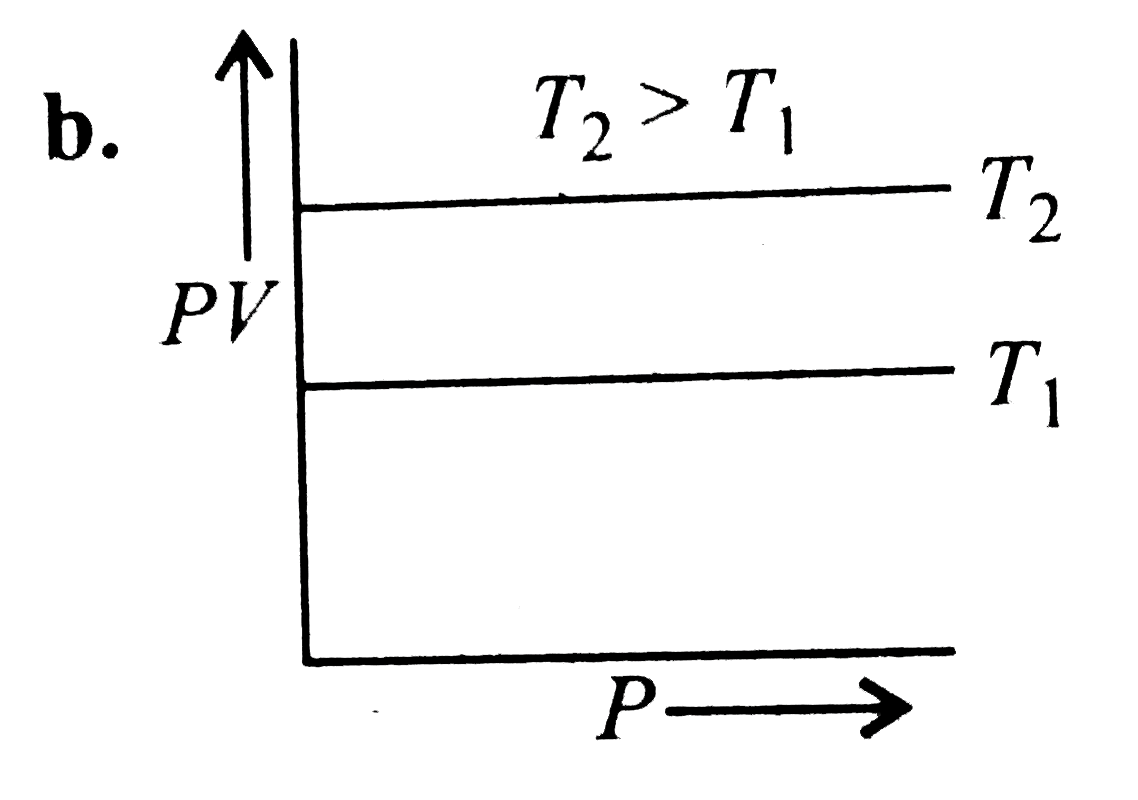
To determine which graph is consistent with ideal gas behavior, we can analyze the relationships defined by the ideal gas law, which is given by the equation:
PV=nRT
Where:
- P = Pressure
- V = Volume
- n = Number of moles
- R = Ideal gas constant
- T = Temperature
1. Understanding the Ideal Gas Law:
- Rearranging the ideal gas law gives us P=nRTV.
- This indicates that pressure P is inversely related to volume V when temperature T and the number of moles n are held constant.
2. Graph Analysis:
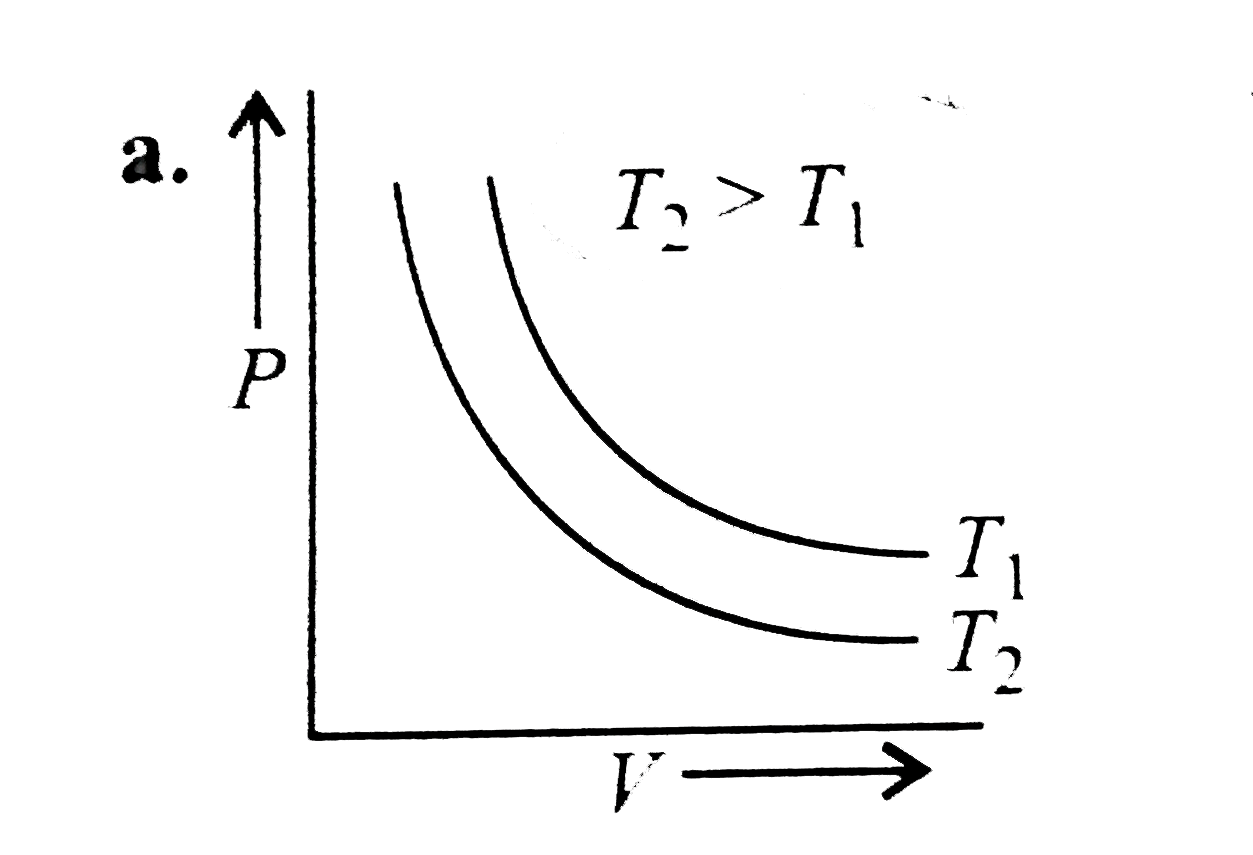
- Graph A: This graph plots pressure P against volume V. Since P is inversely related to V, this graph should show a hyperbolic curve. However, if the temperature T2 is closer to the origin than T1, it indicates incorrect behavior. Thus, Graph A is not consistent with ideal gas behavior.
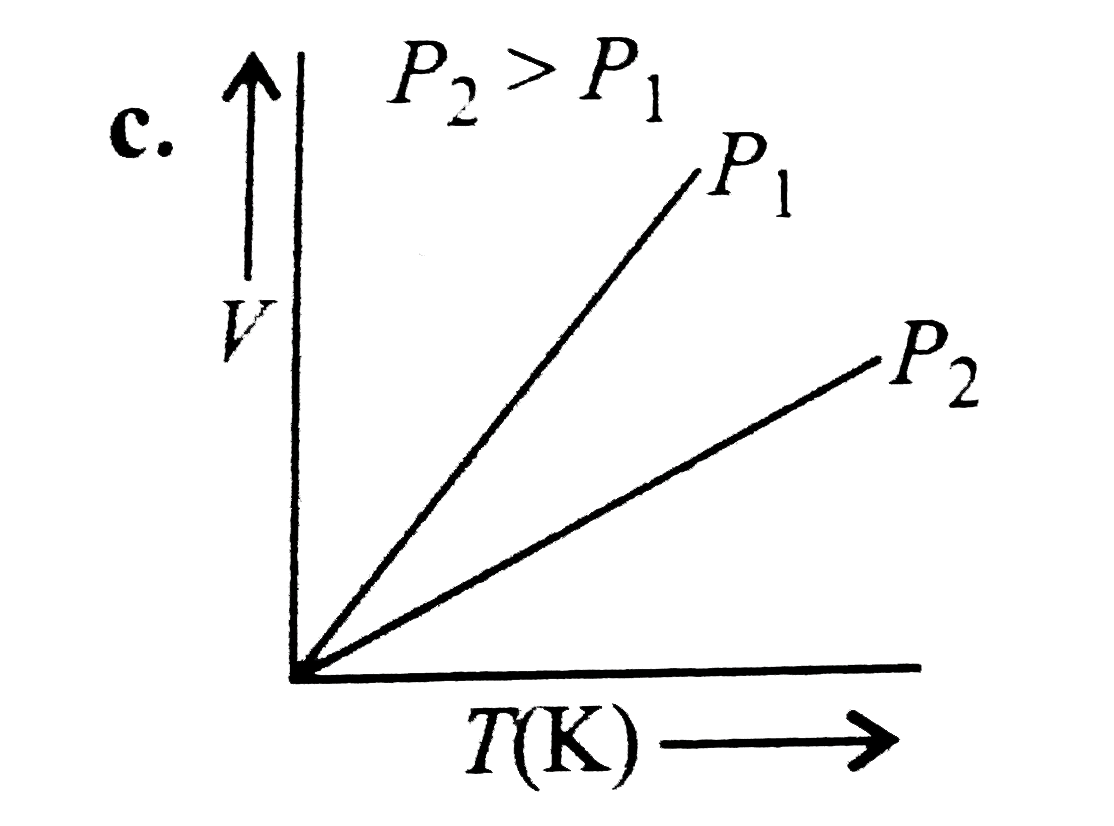
- Graph B: This graph plots volume V against temperature T at constant pressure. According to the ideal gas law, volume is directly proportional to temperature when pressure is constant. If T2 is greater than T1, then V2 should be greater than V1, and the graph should be a straight line moving away from the origin. Therefore, Graph B is consistent with ideal gas behavior.
- Graph C: This graph plots volume V against temperature T while keeping pressure constant. Similar to Graph B, this relationship should also yield a straight line. If T2 is greater than T1, then V2 should also be greater than V1. Thus, Graph C is also consistent with ideal gas behavior.
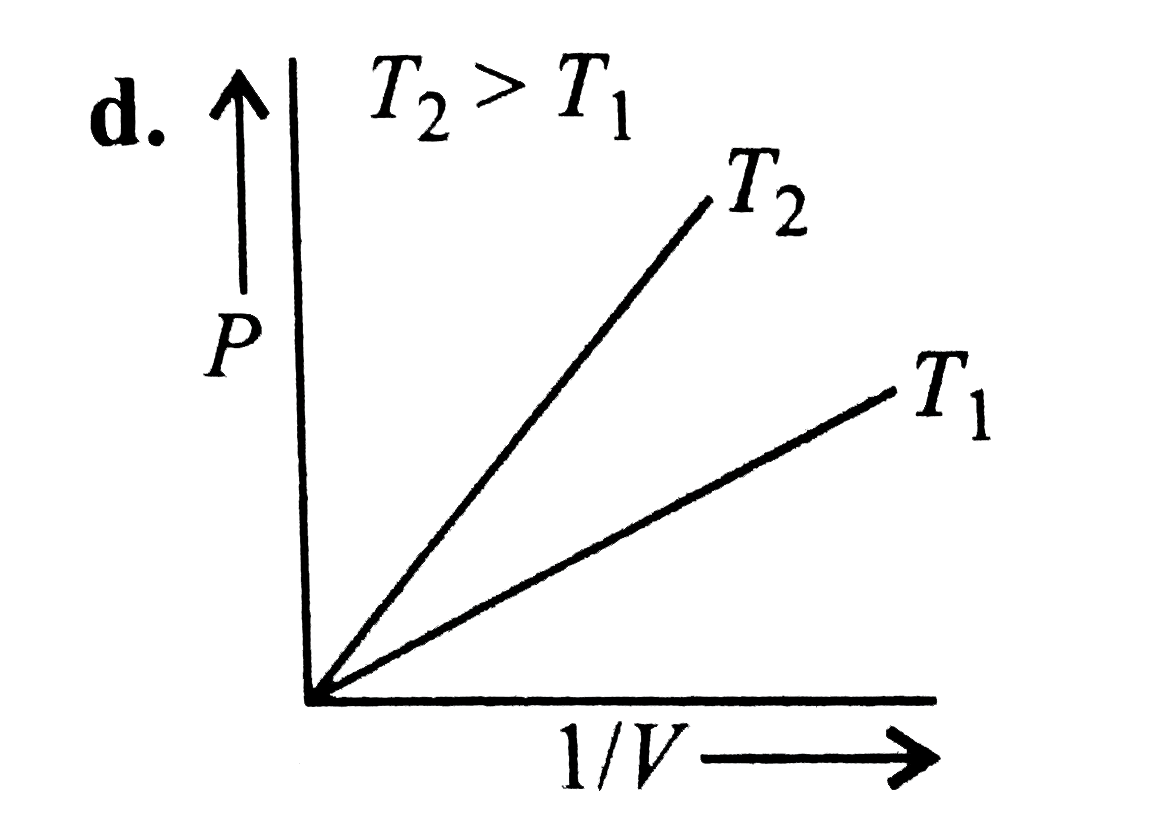
- Graph D: This graph plots pressure P against 1V (inverse volume) at constant temperature. According to the ideal gas law, if volume decreases (i.e., 1V increases), pressure should increase. Thus, this graph should also show a linear relationship where pressure increases as 1V increases. Therefore, Graph D is consistent with ideal gas behavior.
3. Conclusion:
- The graphs that are consistent with ideal gas behavior are B, C, and D.
- Graph A is inconsistent with ideal gas behavior.
- P = Pressure
- V = Volume
- n = Number of moles
- R = Ideal gas constant
- T = Temperature
- Rearranging the ideal gas law gives us P=nRTV.
- This indicates that pressure P is inversely related to volume V when temperature T and the number of moles n are held constant.
- Graph A: This graph plots pressure P against volume V. Since P is inversely related to V, this graph should show a hyperbolic curve. However, if the temperature T2 is closer to the origin than T1, it indicates incorrect behavior. Thus, Graph A is not consistent with ideal gas behavior.
- Graph B: This graph plots volume V against temperature T at constant pressure. According to the ideal gas law, volume is directly proportional to temperature when pressure is constant. If T2 is greater than T1, then V2 should be greater than V1, and the graph should be a straight line moving away from the origin. Therefore, Graph B is consistent with ideal gas behavior.
- The graphs that are consistent with ideal gas behavior are B, C, and D.
- Graph A is inconsistent with ideal gas behavior.
Topper's Solved these Questions
- STATES OF MATTERBOOK - CENGAGE CHEMISTRY ENGLISHCHAPTER - STATES OF MATTEREXERCISE - Illustration
2 Videos
- STATES OF MATTERBOOK - CENGAGE CHEMISTRY ENGLISHCHAPTER - STATES OF MATTEREXERCISE - Exercises
21 Videos
- SOME BASIC CONCEPTS AND MOLE CONCEPTBOOK - CENGAGE CHEMISTRY ENGLISHCHAPTER - SOME BASIC CONCEPTS AND MOLE CONCEPTEXERCISE - Archives Subjective
11 Videos
- STOICHIOMETRYBOOK - CENGAGE CHEMISTRY ENGLISHCHAPTER - STOICHIOMETRYEXERCISE - Archives Subjective
33 Videos
Similar Questions
Knowledge Check
Which of the following graphs represent the behaviour of an ideal gas ?
A1.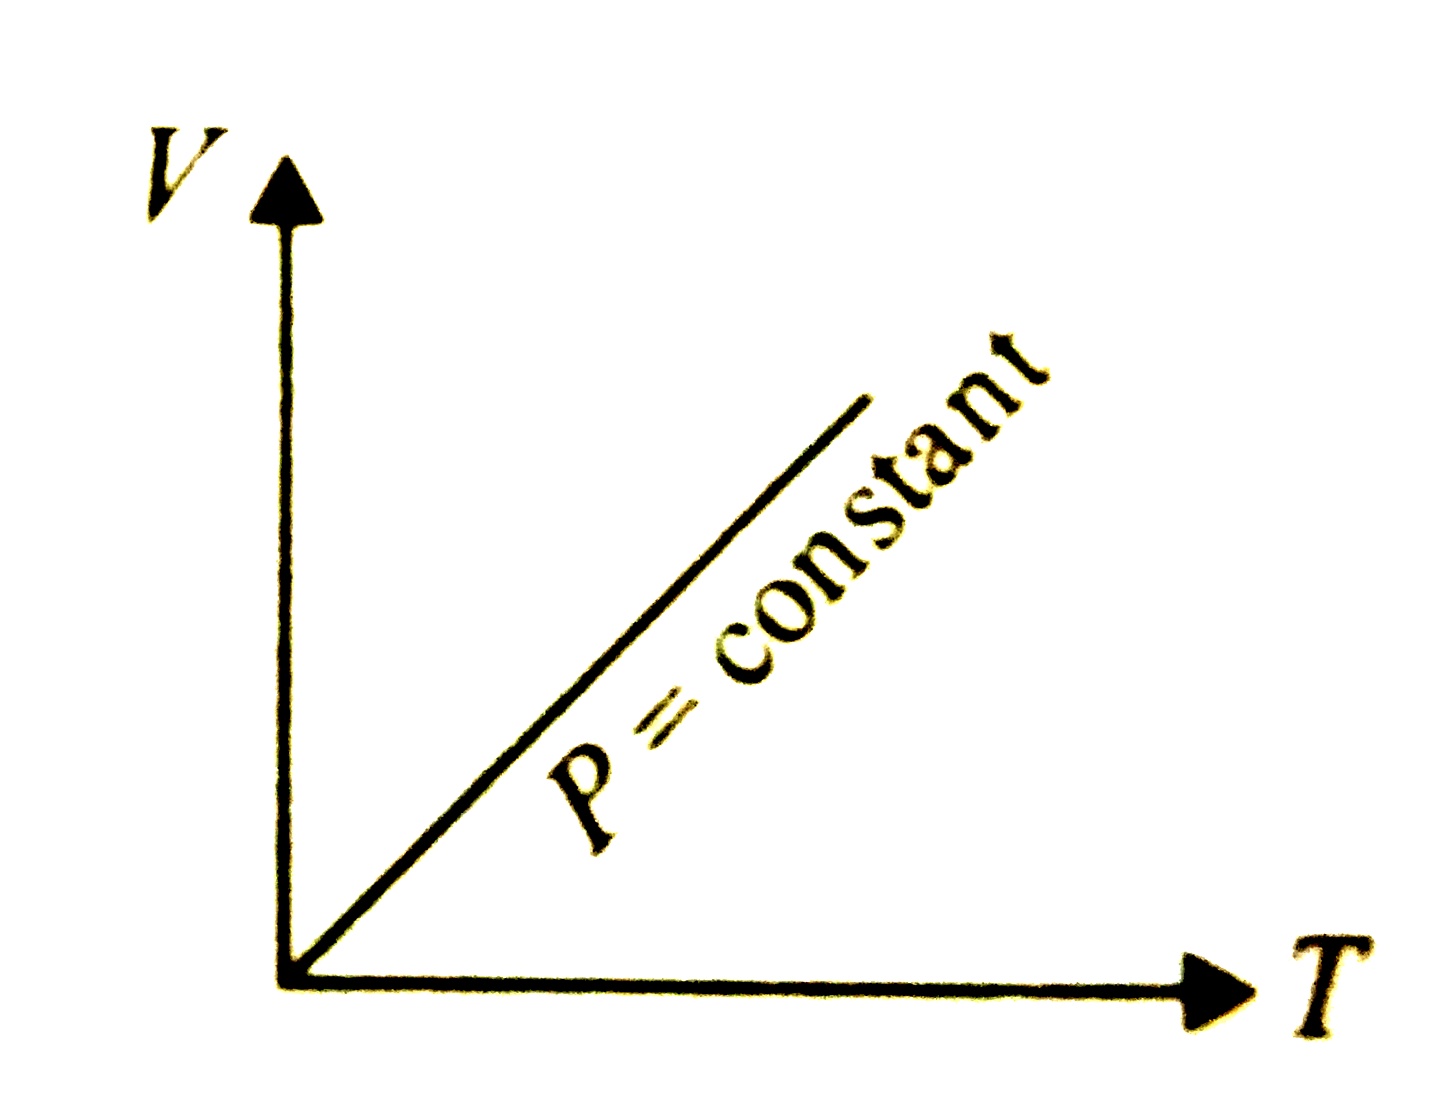 B2.
B2.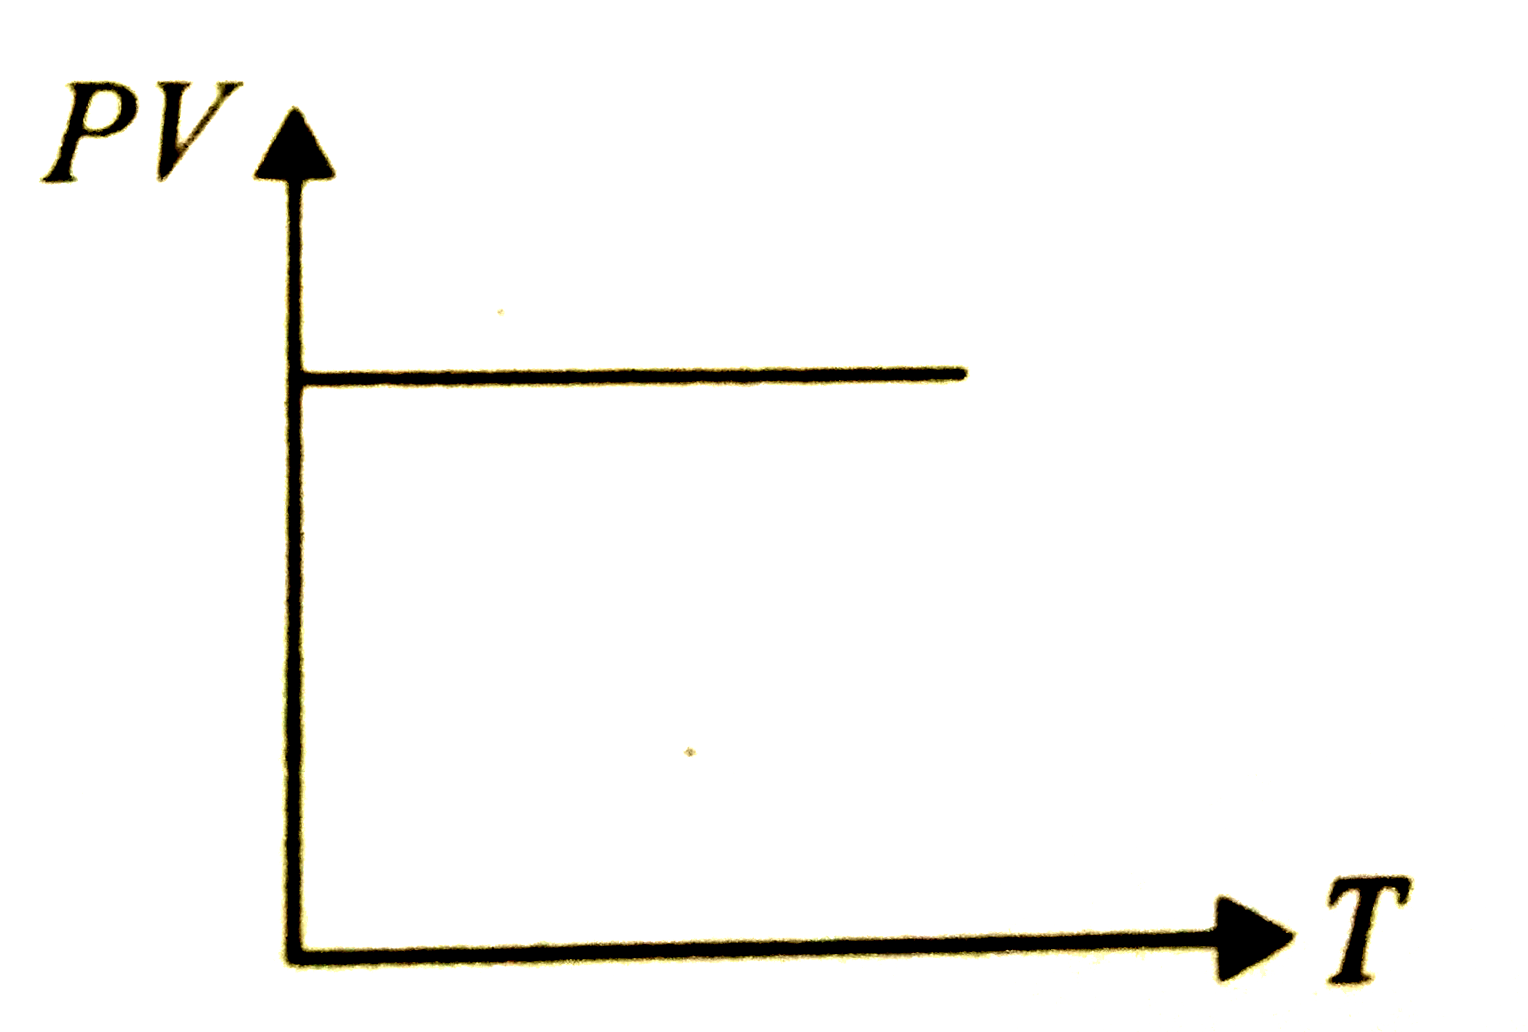 C3.
C3.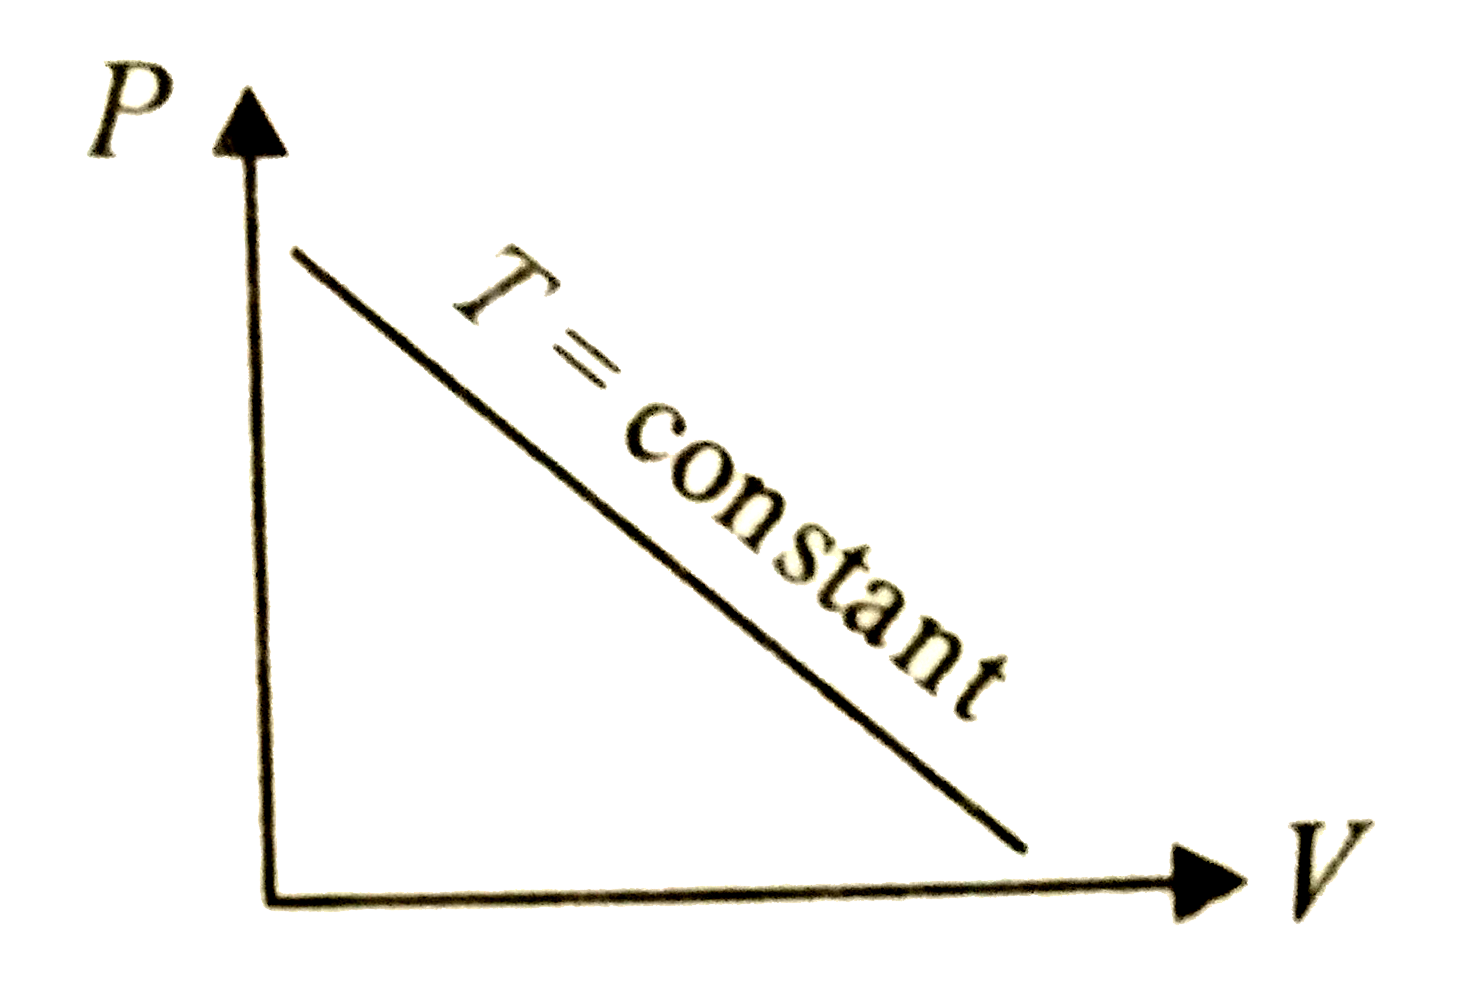 D4.
D4.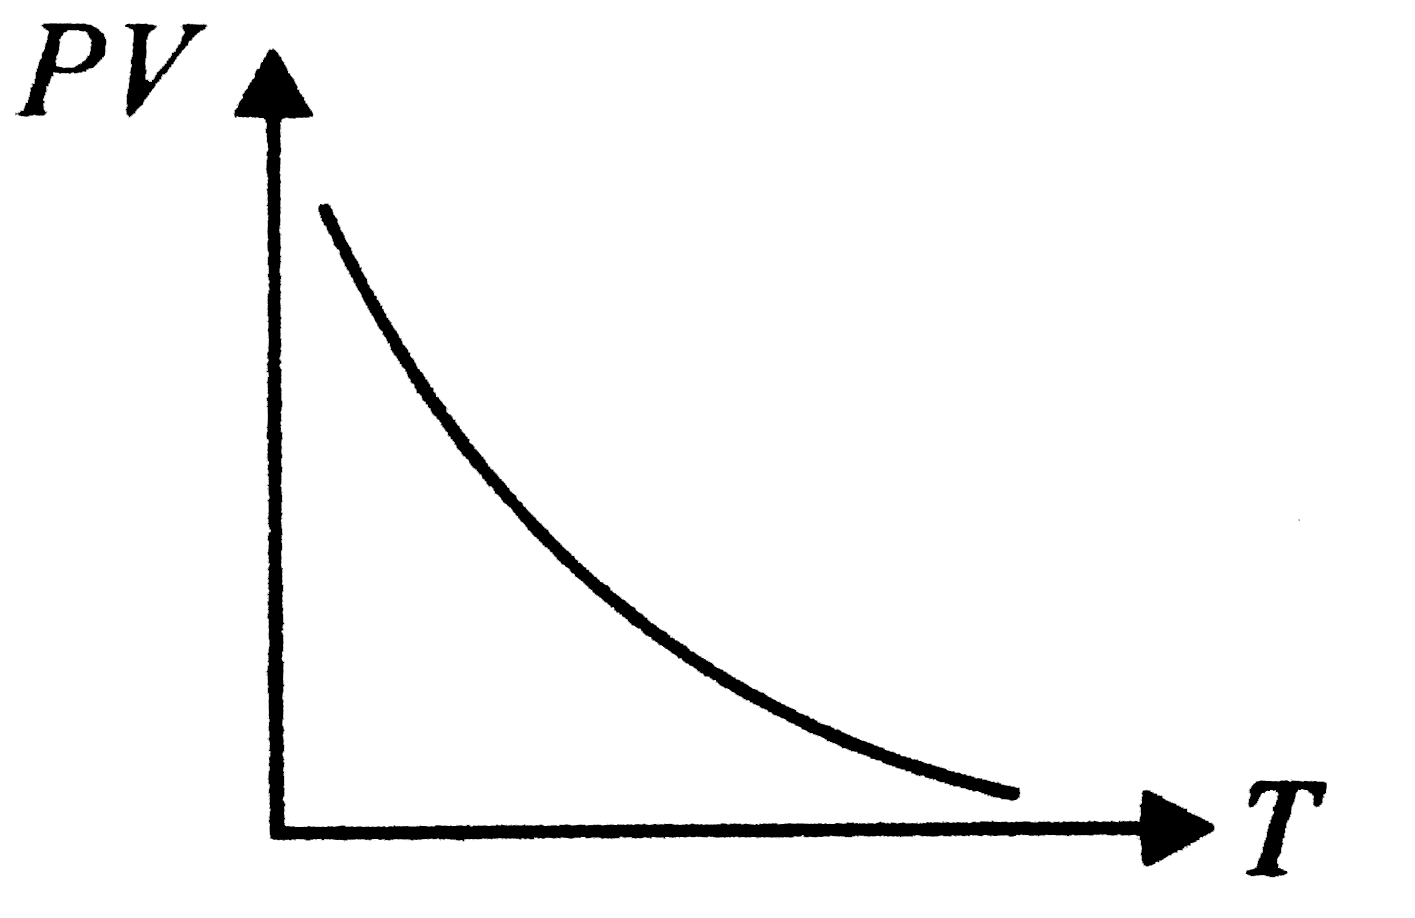
Which of the following diagrams (figure) depicts ideal gas behaviour?
View SolutionWhich of the following curve is correct for an ideal gas ?
View SolutionWhich of the following expressions is true for an ideal gas ?
View SolutionWhich of the following relation is correct for an ideal gas ?
View Solutionwhich one of the following graph is not correct for ideal gas ?
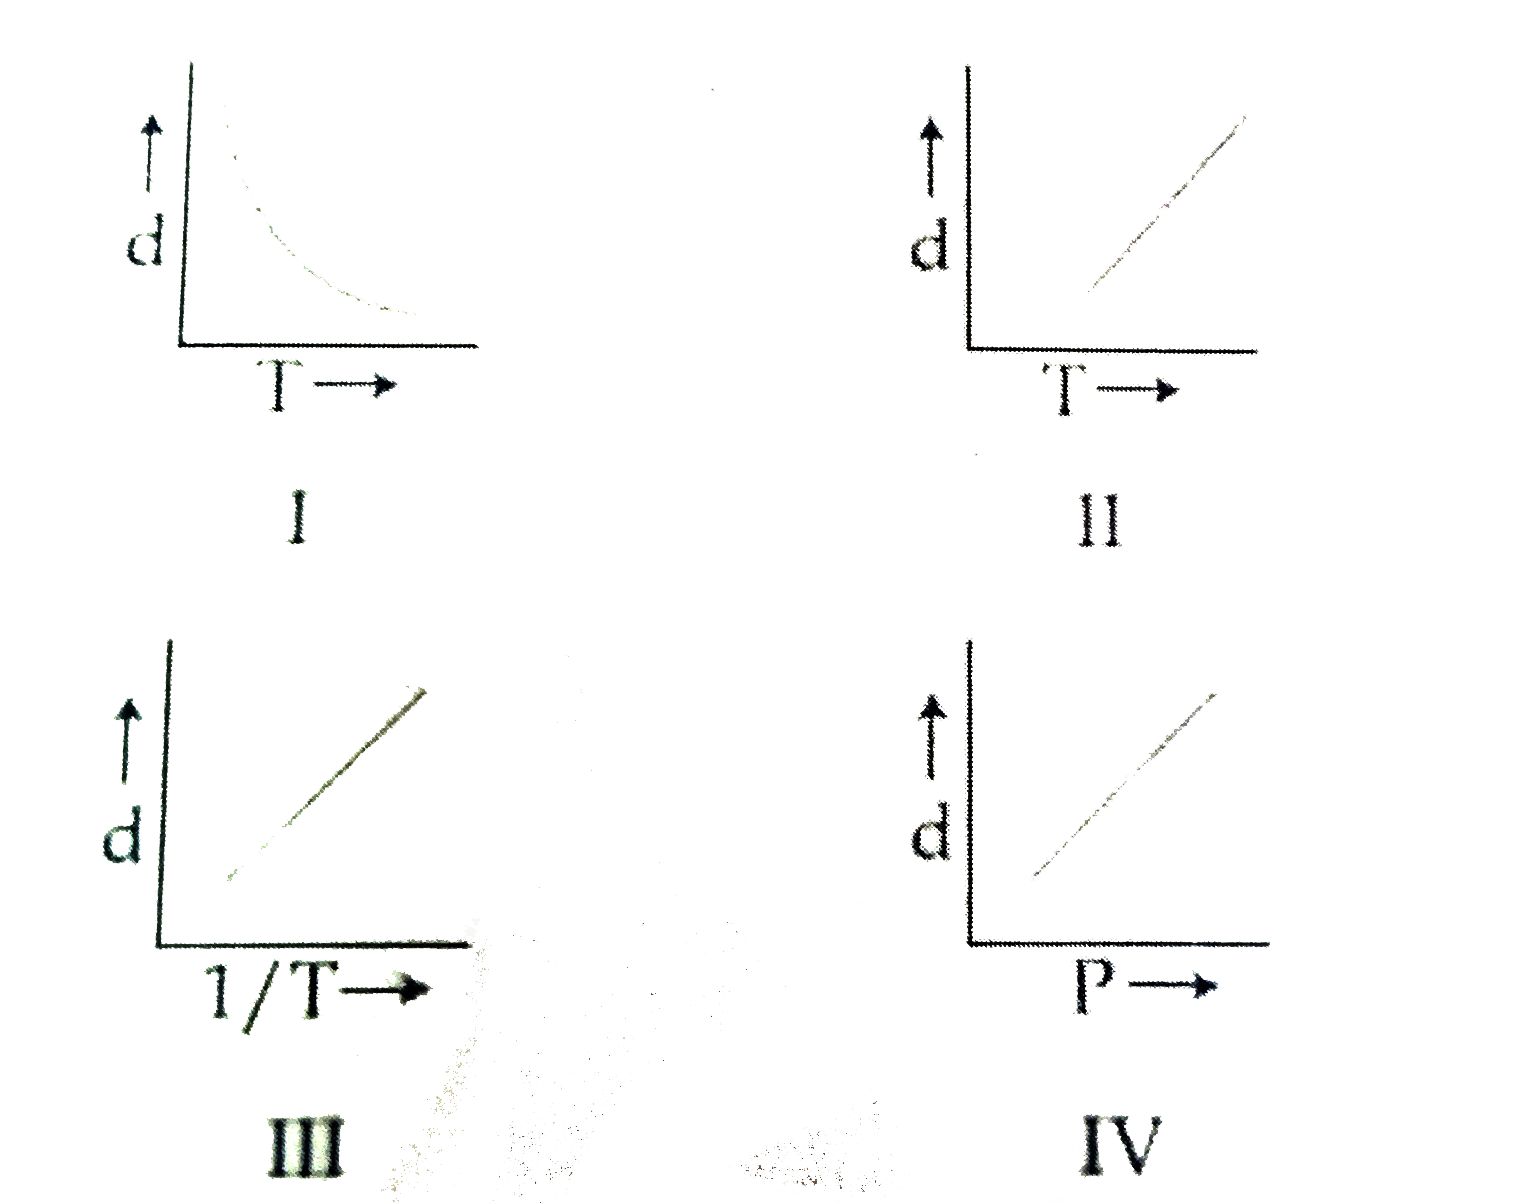
d=density ,P=pressure,T=Temperature
View SolutionFor the given ideal gas equation PV=nRT, answer the following questions:
which of the following is incorrect according to the ideal gas equation?
View SolutionWhich of the following does not represent ideal gas equation?
View Solution

