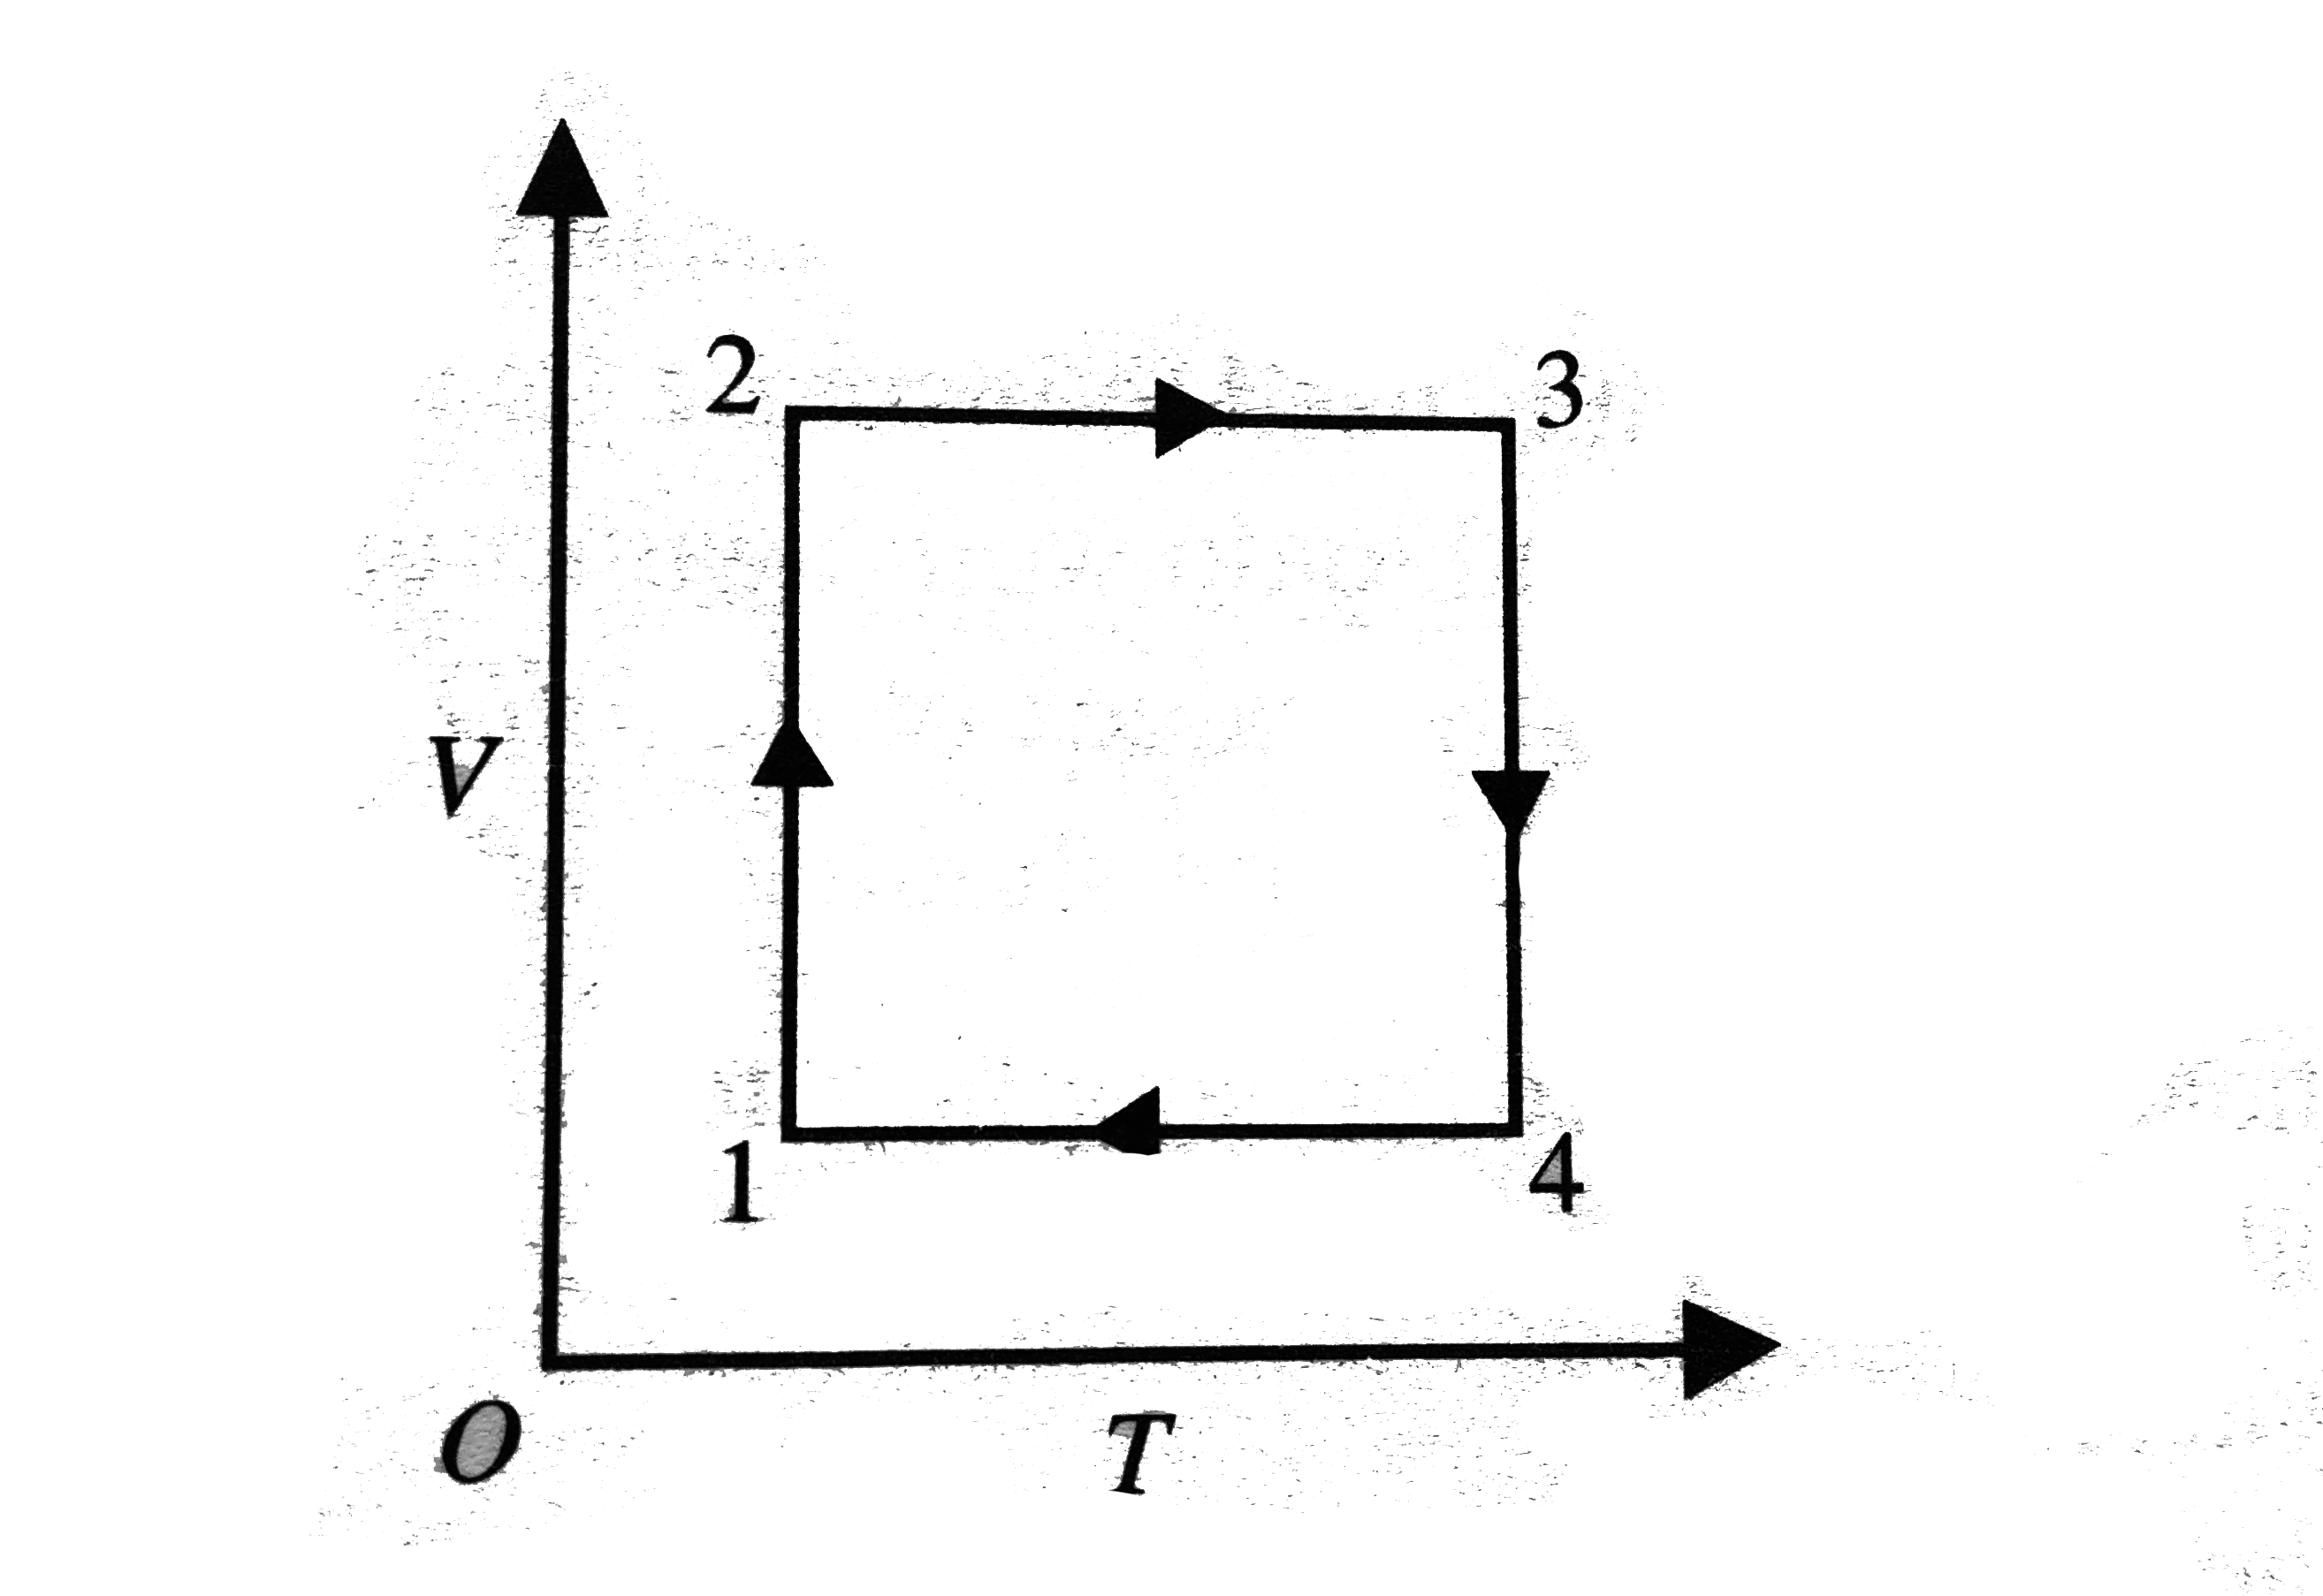
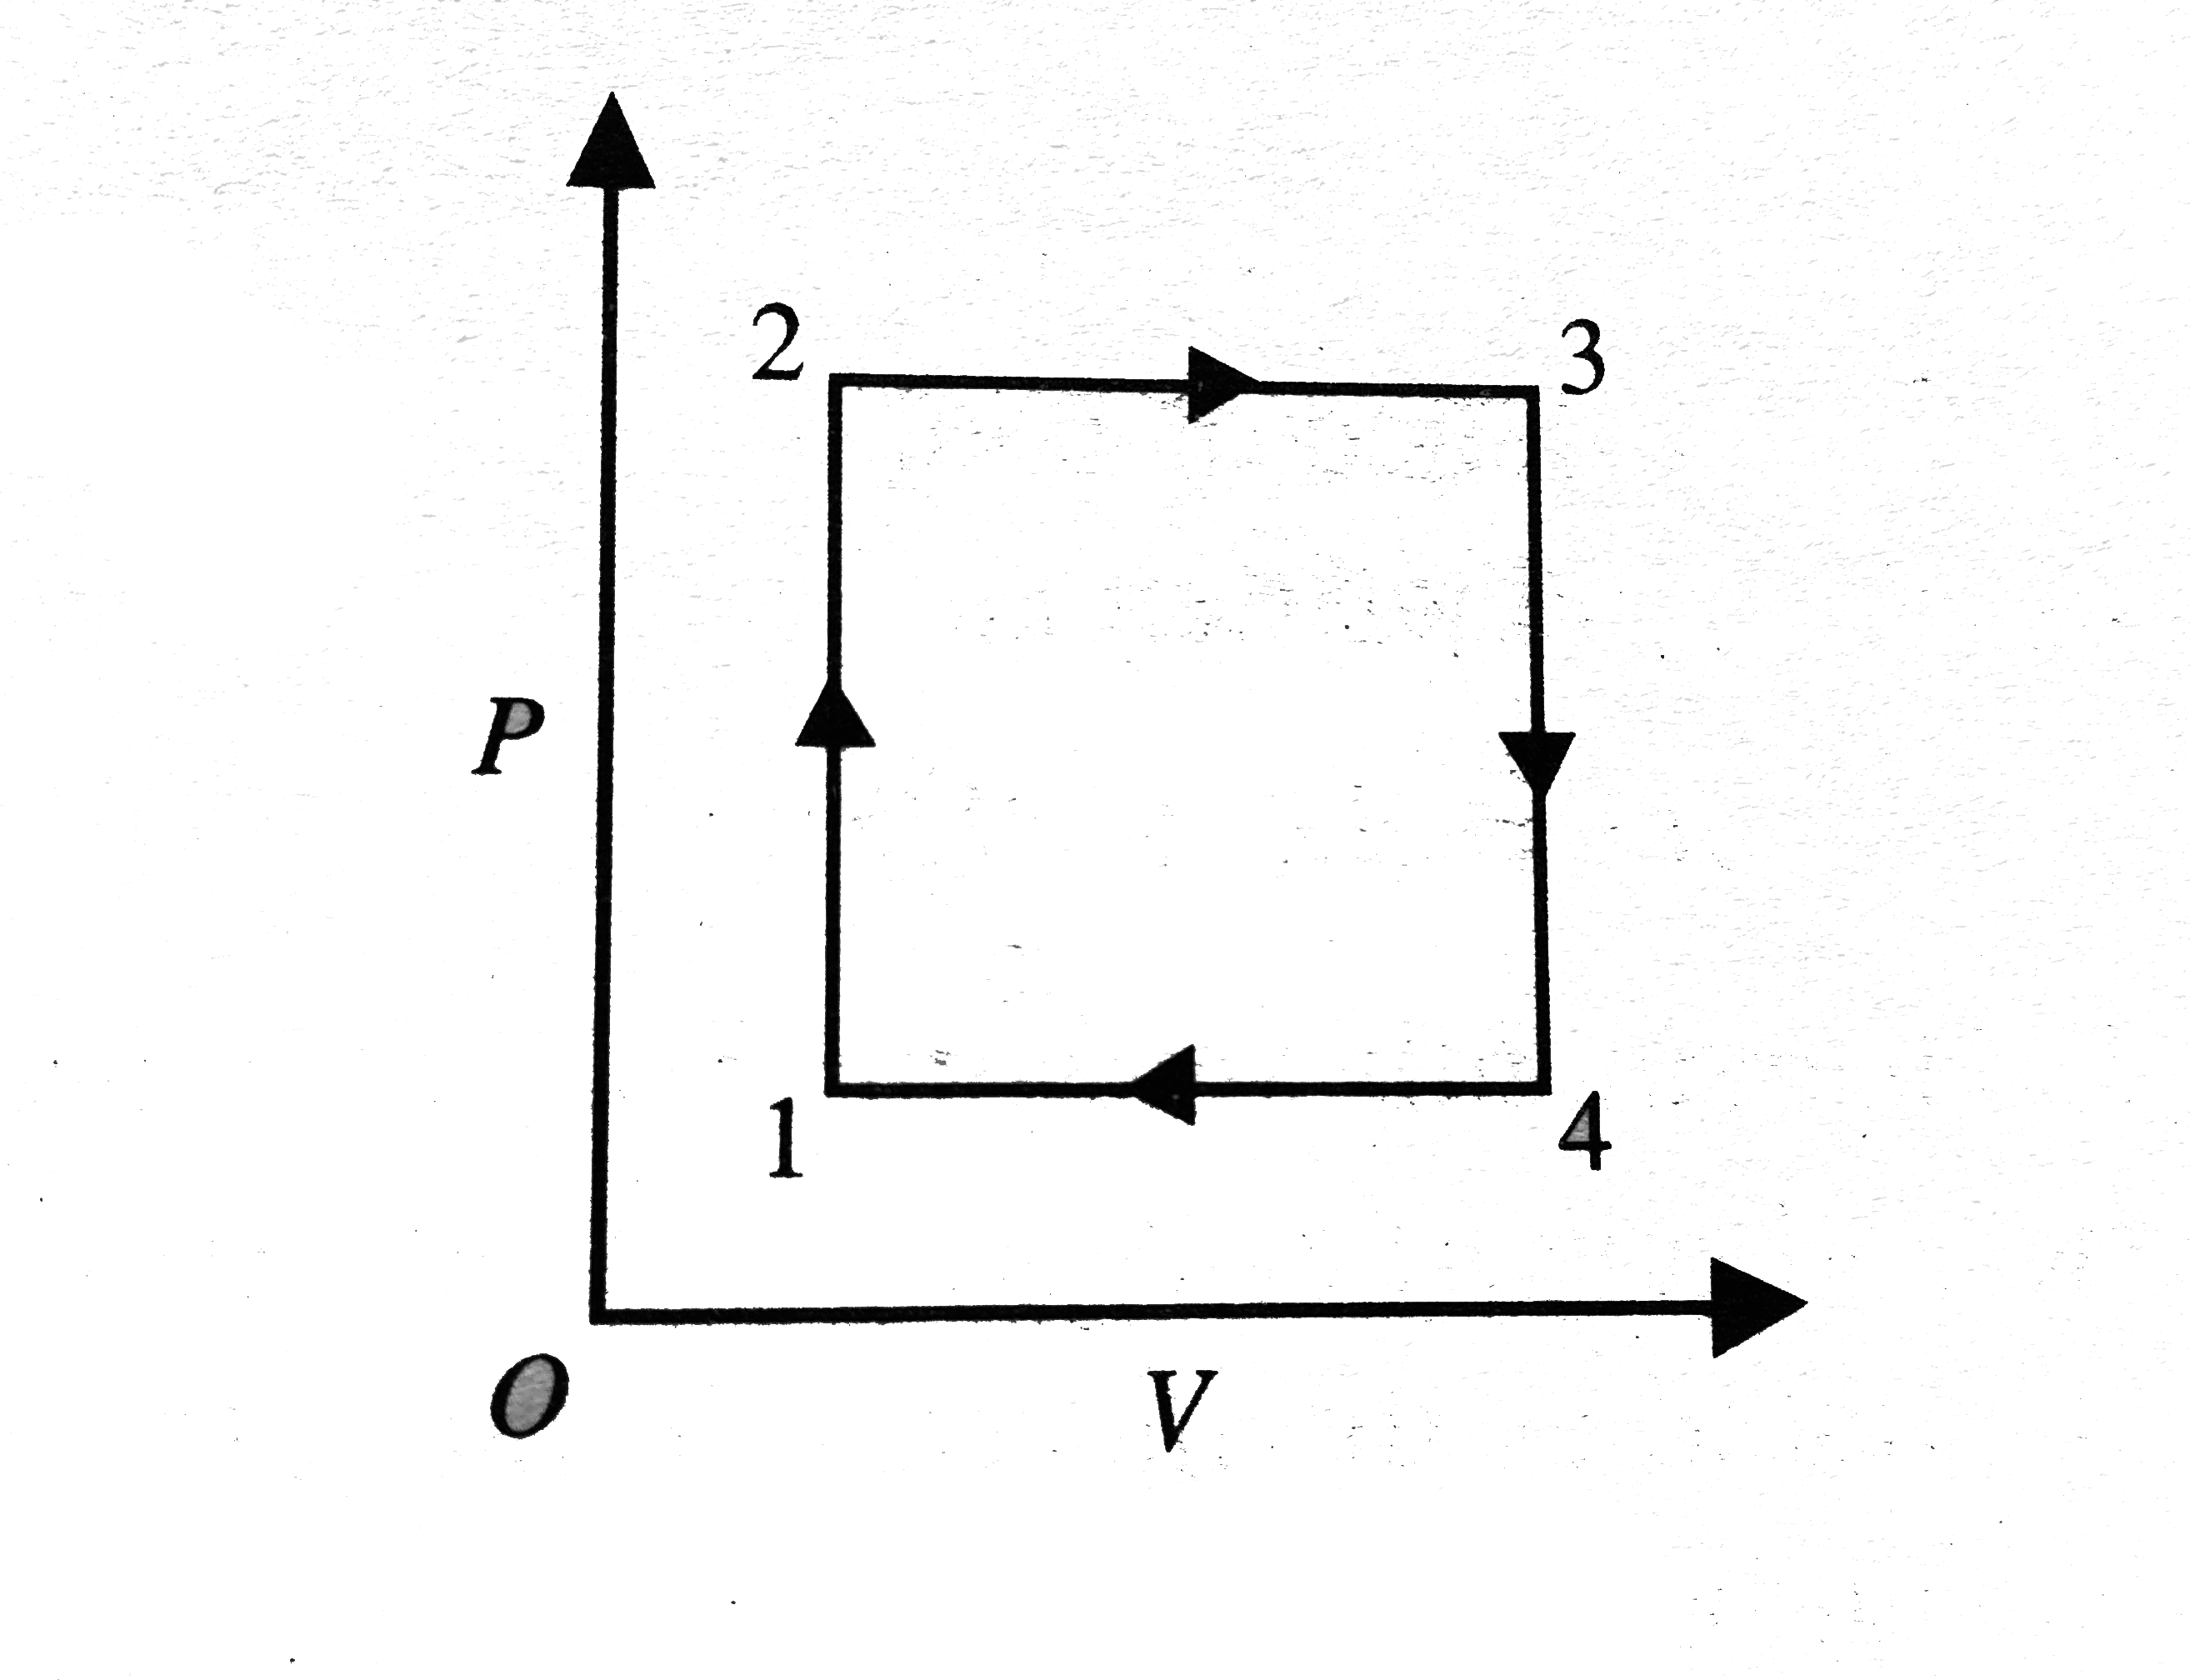
A gas has been subjected to isochoric-isobaric processes 1-2-3-4-1 see Fig. Plot this process on T - V and P - T diagrams.
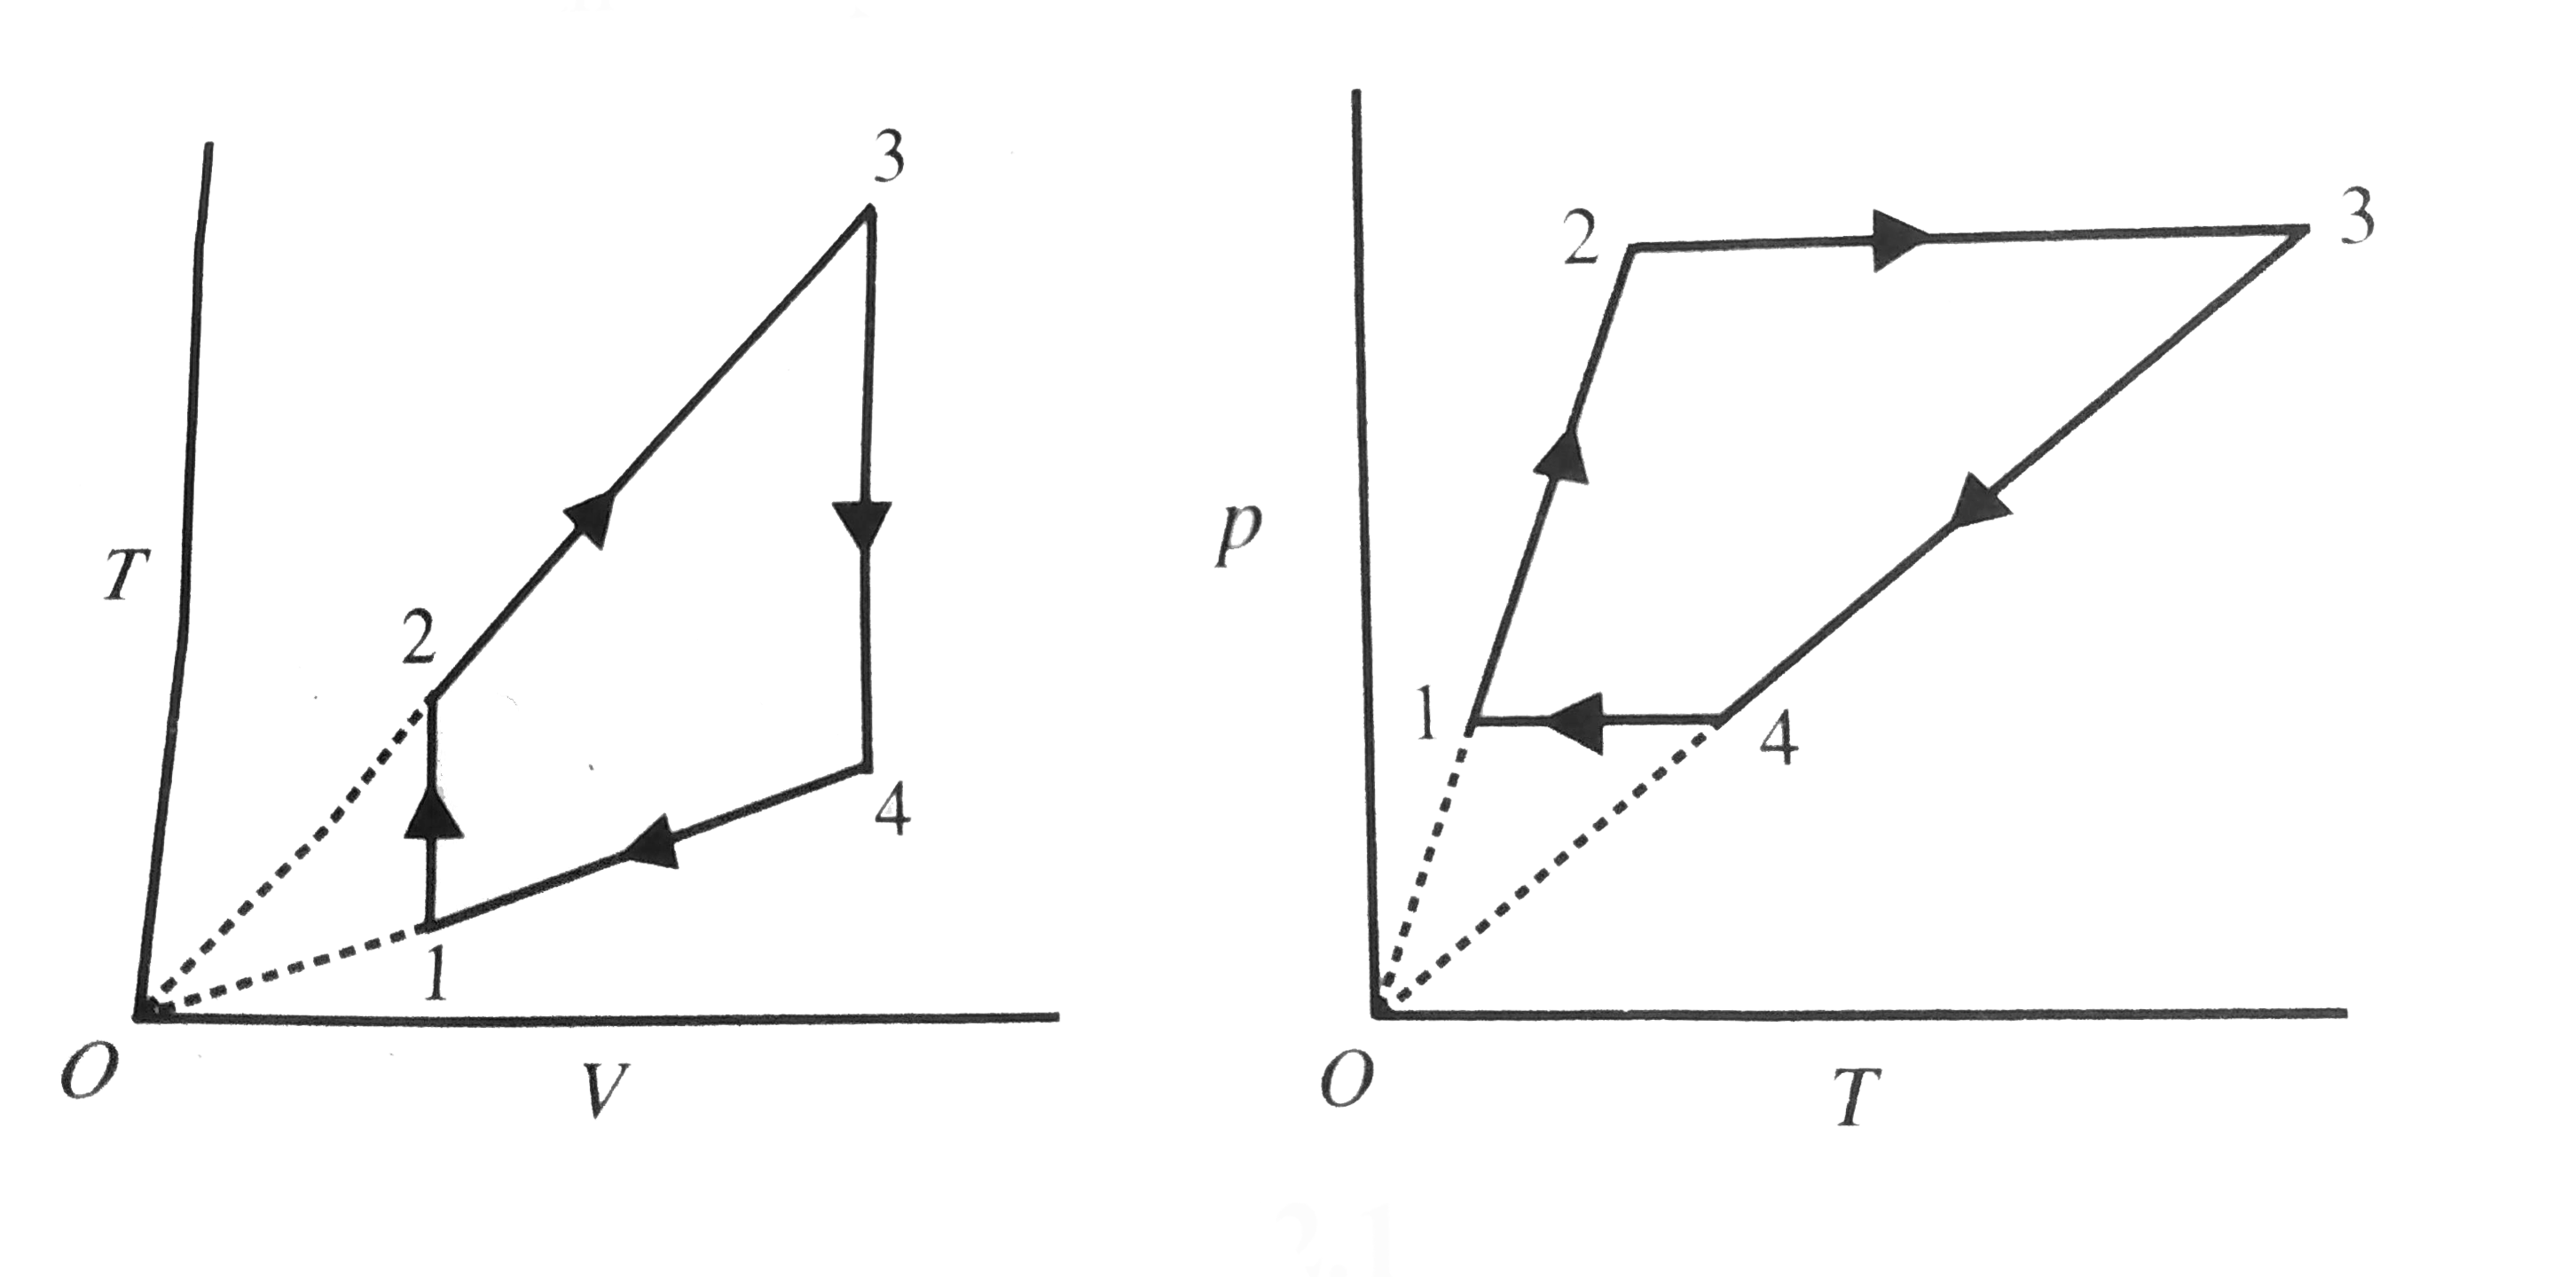
The plot is shown in Fig.
Explanation: Since 1−2,V remains constant, the plot of T against V is a straight line parallel to the T−aξs.
For an ideal gas pV=RT. So when p remains constant, V∞T. Hence the plot of T against V is a straight line passing through the origing. The same is repected fro 3−4 and 4−1. The plot of p against T is shown in the figure and can be explained similarly.
Topper's Solved these Questions
- KINETIC THEORY OF GASES AND FIRST LAW OF THERMODYNAMICSBOOK - CENGAGE PHYSICS ENGLISHCHAPTER - KINETIC THEORY OF GASES AND FIRST LAW OF THERMODYNAMICSEXERCISE - Exercise 2.2
28 Videos
- KINETIC THEORY OF GASES AND FIRST LAW OF THERMODYNAMICSBOOK - CENGAGE PHYSICS ENGLISHCHAPTER - KINETIC THEORY OF GASES AND FIRST LAW OF THERMODYNAMICSEXERCISE - Subjective
22 Videos
- KINETIC THEORY OF GASES AND FIRST LAW OF THERMODYNAMICSBOOK - CENGAGE PHYSICS ENGLISHCHAPTER - KINETIC THEORY OF GASES AND FIRST LAW OF THERMODYNAMICSEXERCISE - Solved Examples
14 Videos
- KINETIC THEORY OF GASESBOOK - CENGAGE PHYSICS ENGLISHCHAPTER - KINETIC THEORY OF GASESEXERCISE - Compression
2 Videos
- LINEAR AND ANGULAR SIMPLE HARMONIC MOTIONBOOK - CENGAGE PHYSICS ENGLISHCHAPTER - LINEAR AND ANGULAR SIMPLE HARMONIC MOTIONEXERCISE - Single correct anwer type
14 Videos
Similar Questions
Knowledge Check
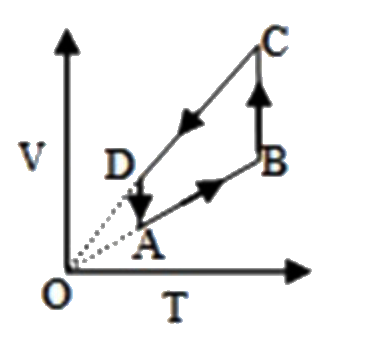
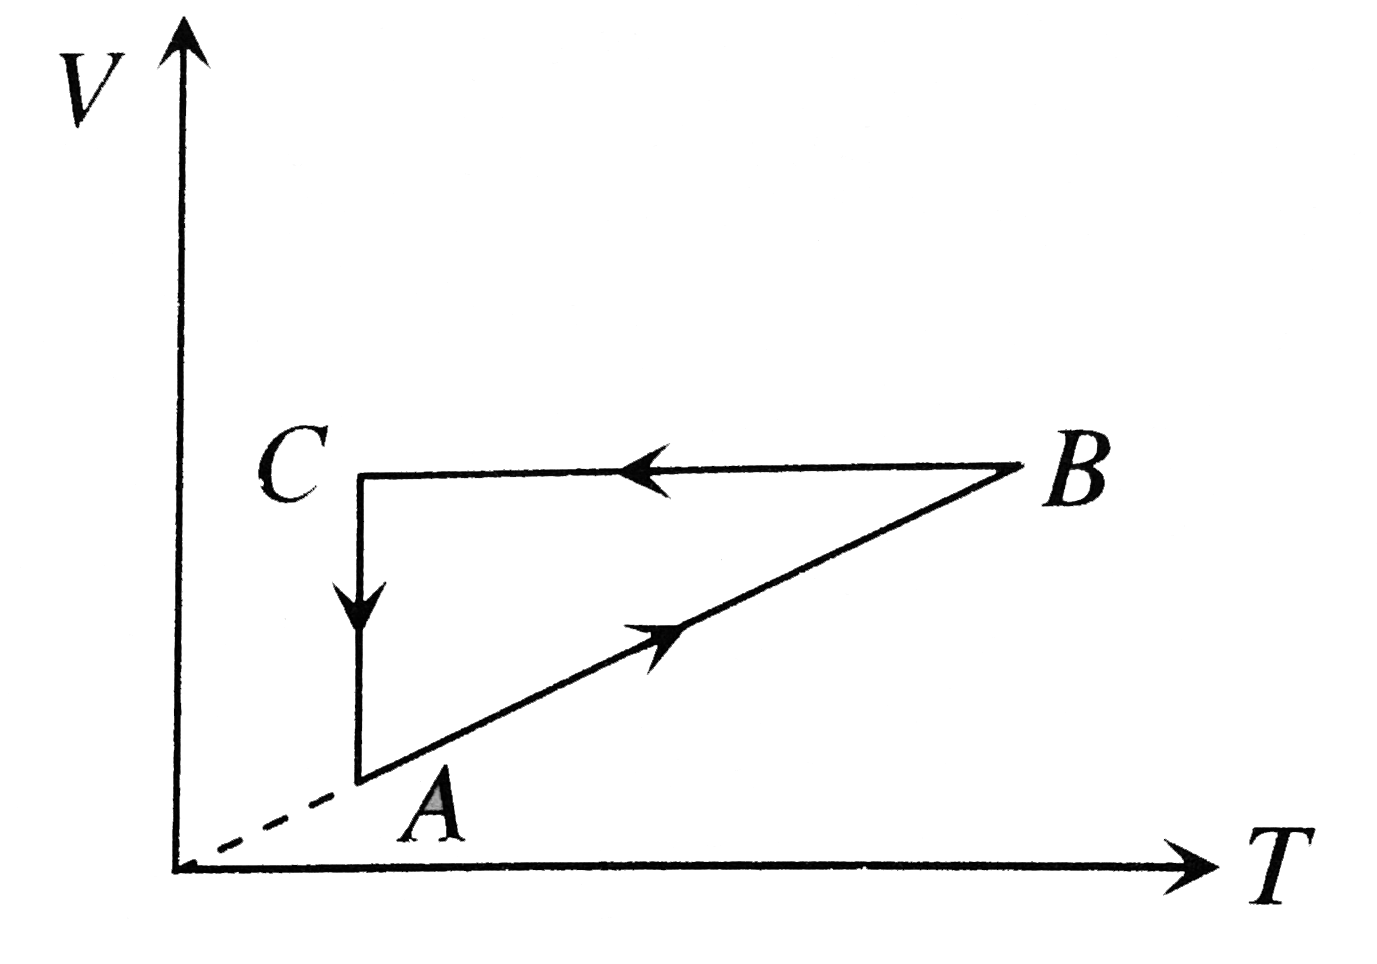
A cyclic process ABCA is shown in the V−T diagram process on the P−V
 A
A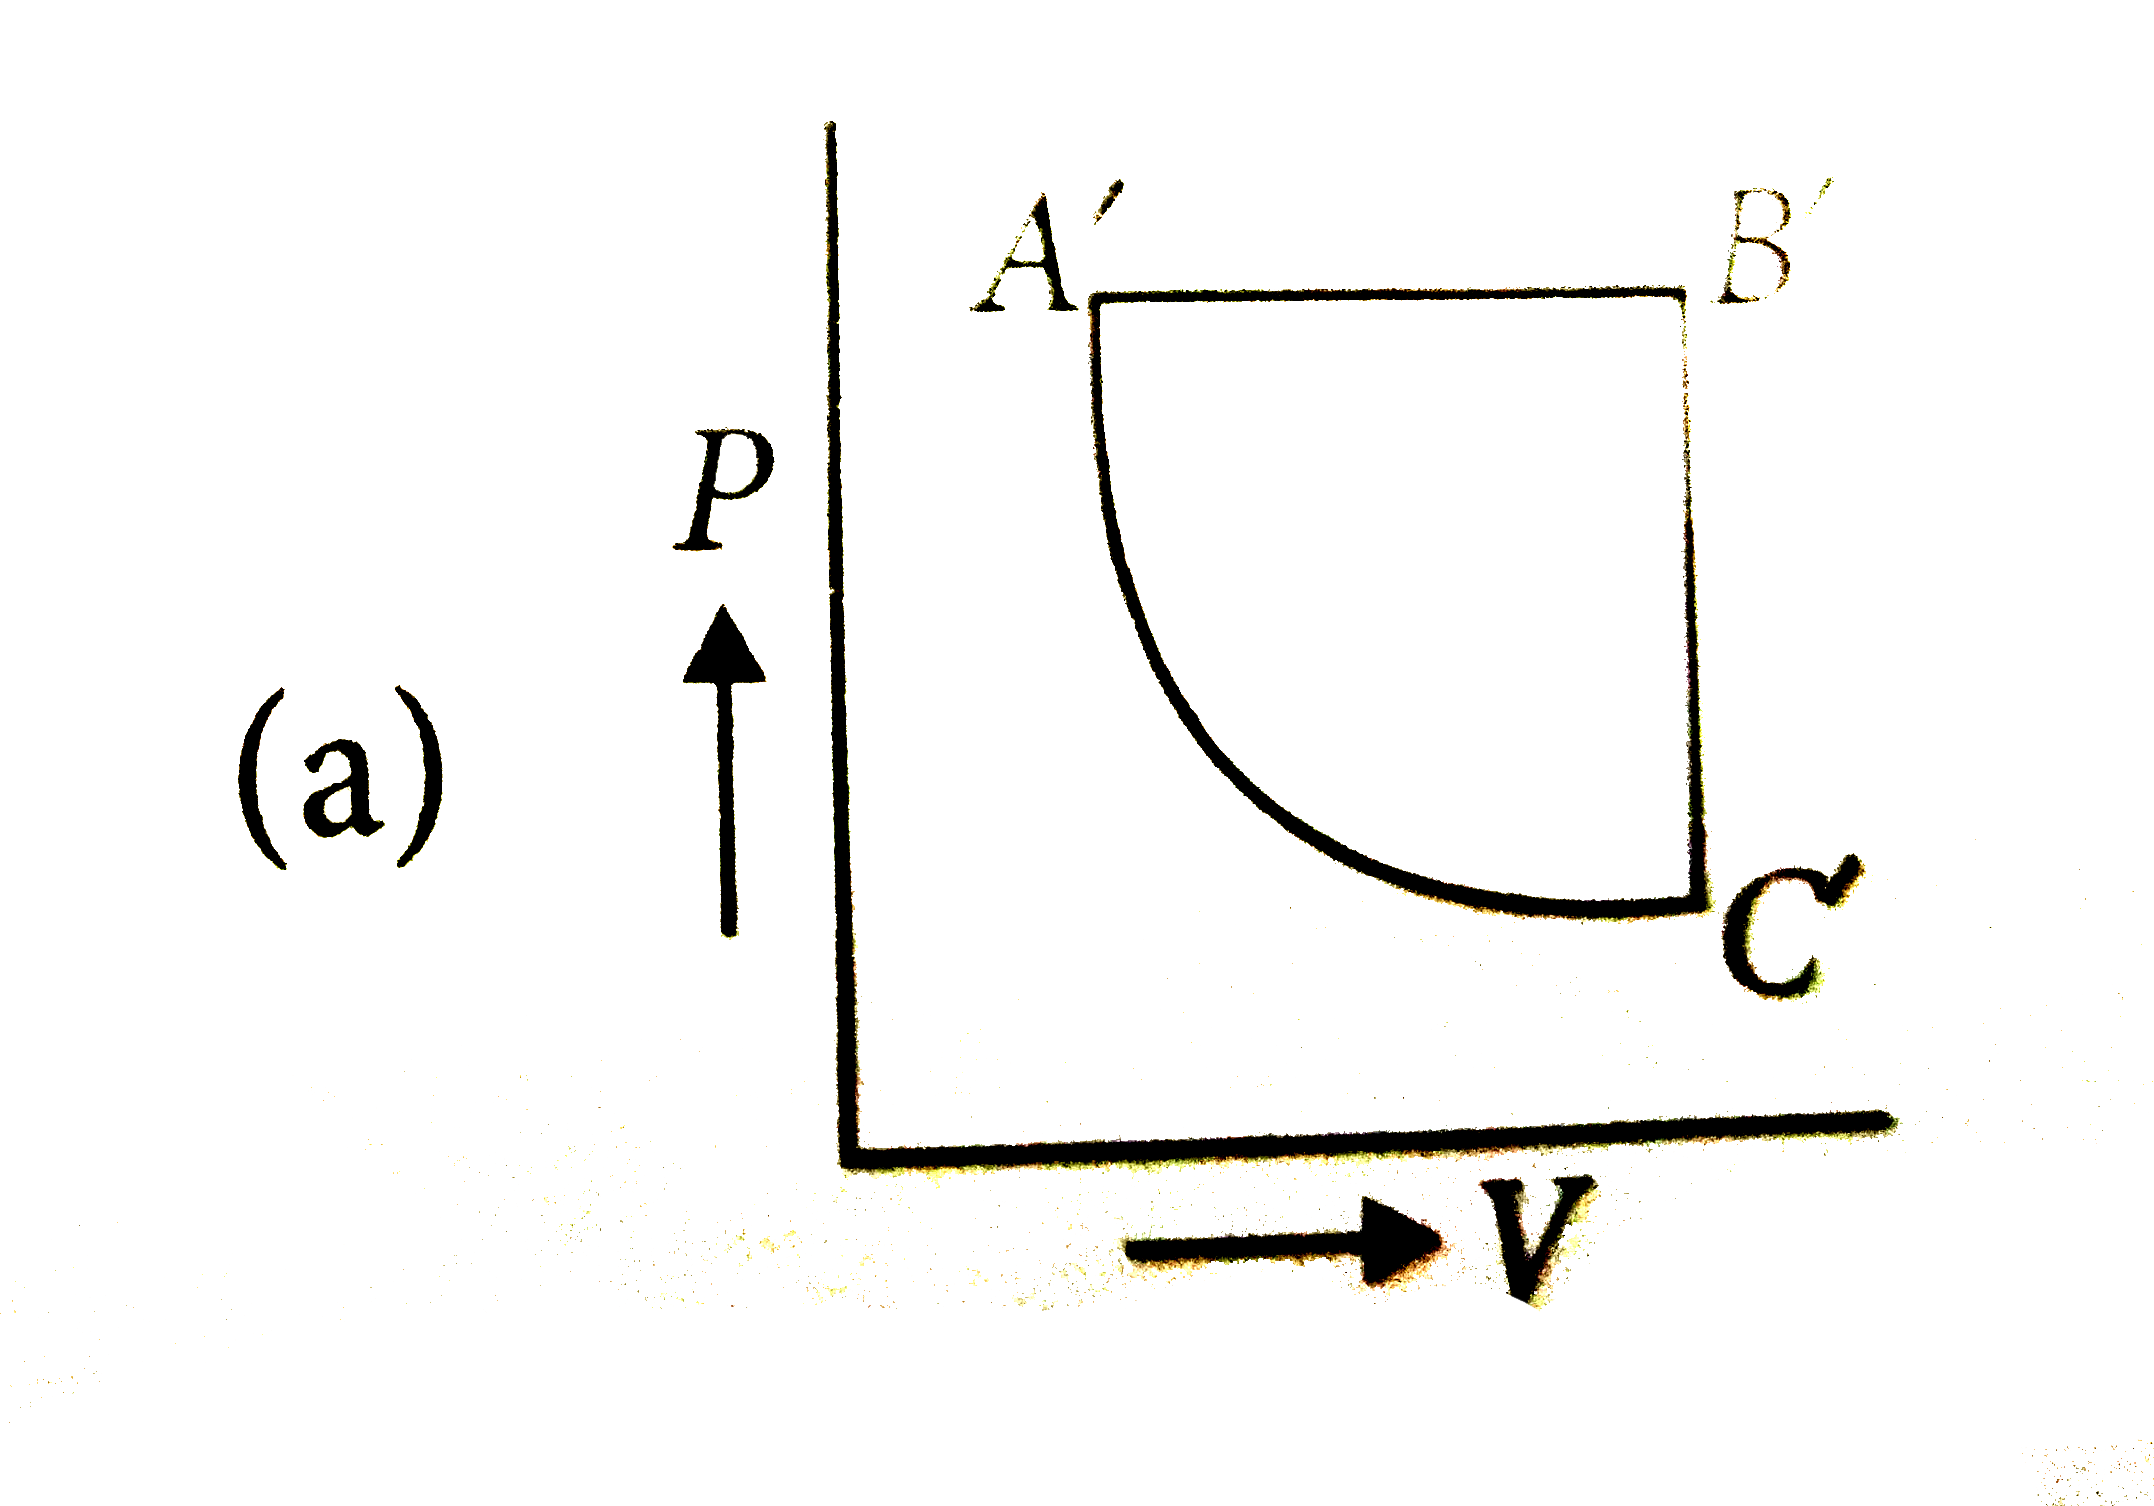 B
B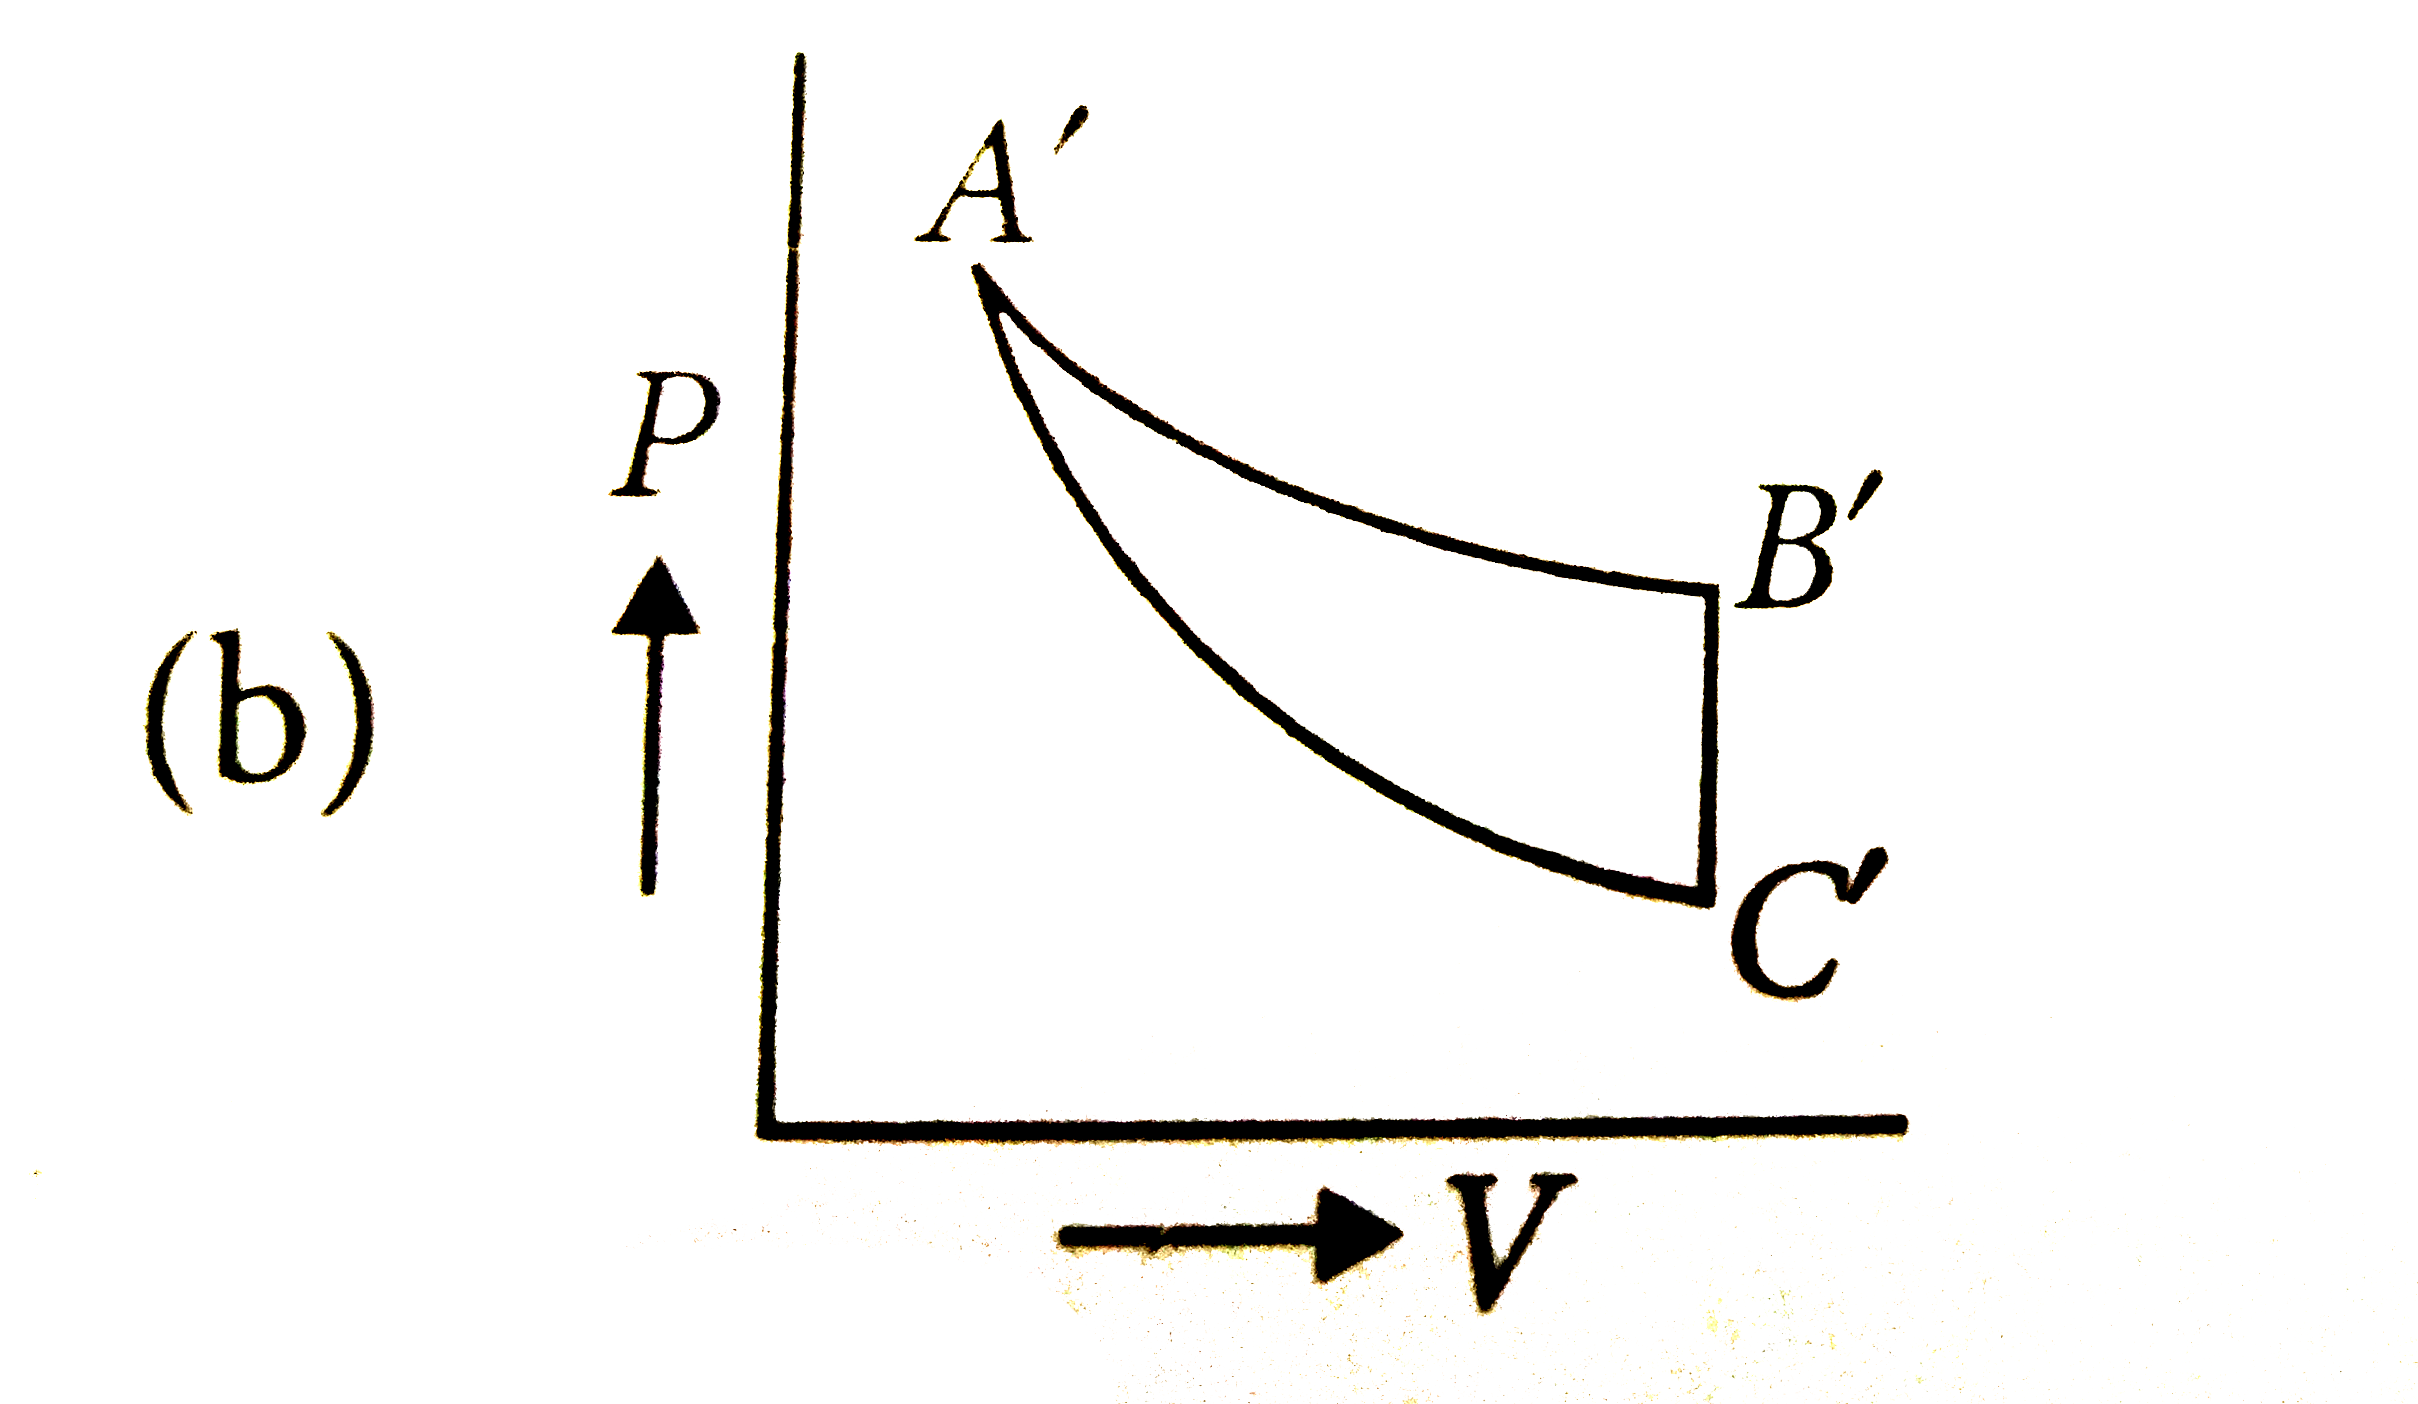 C
C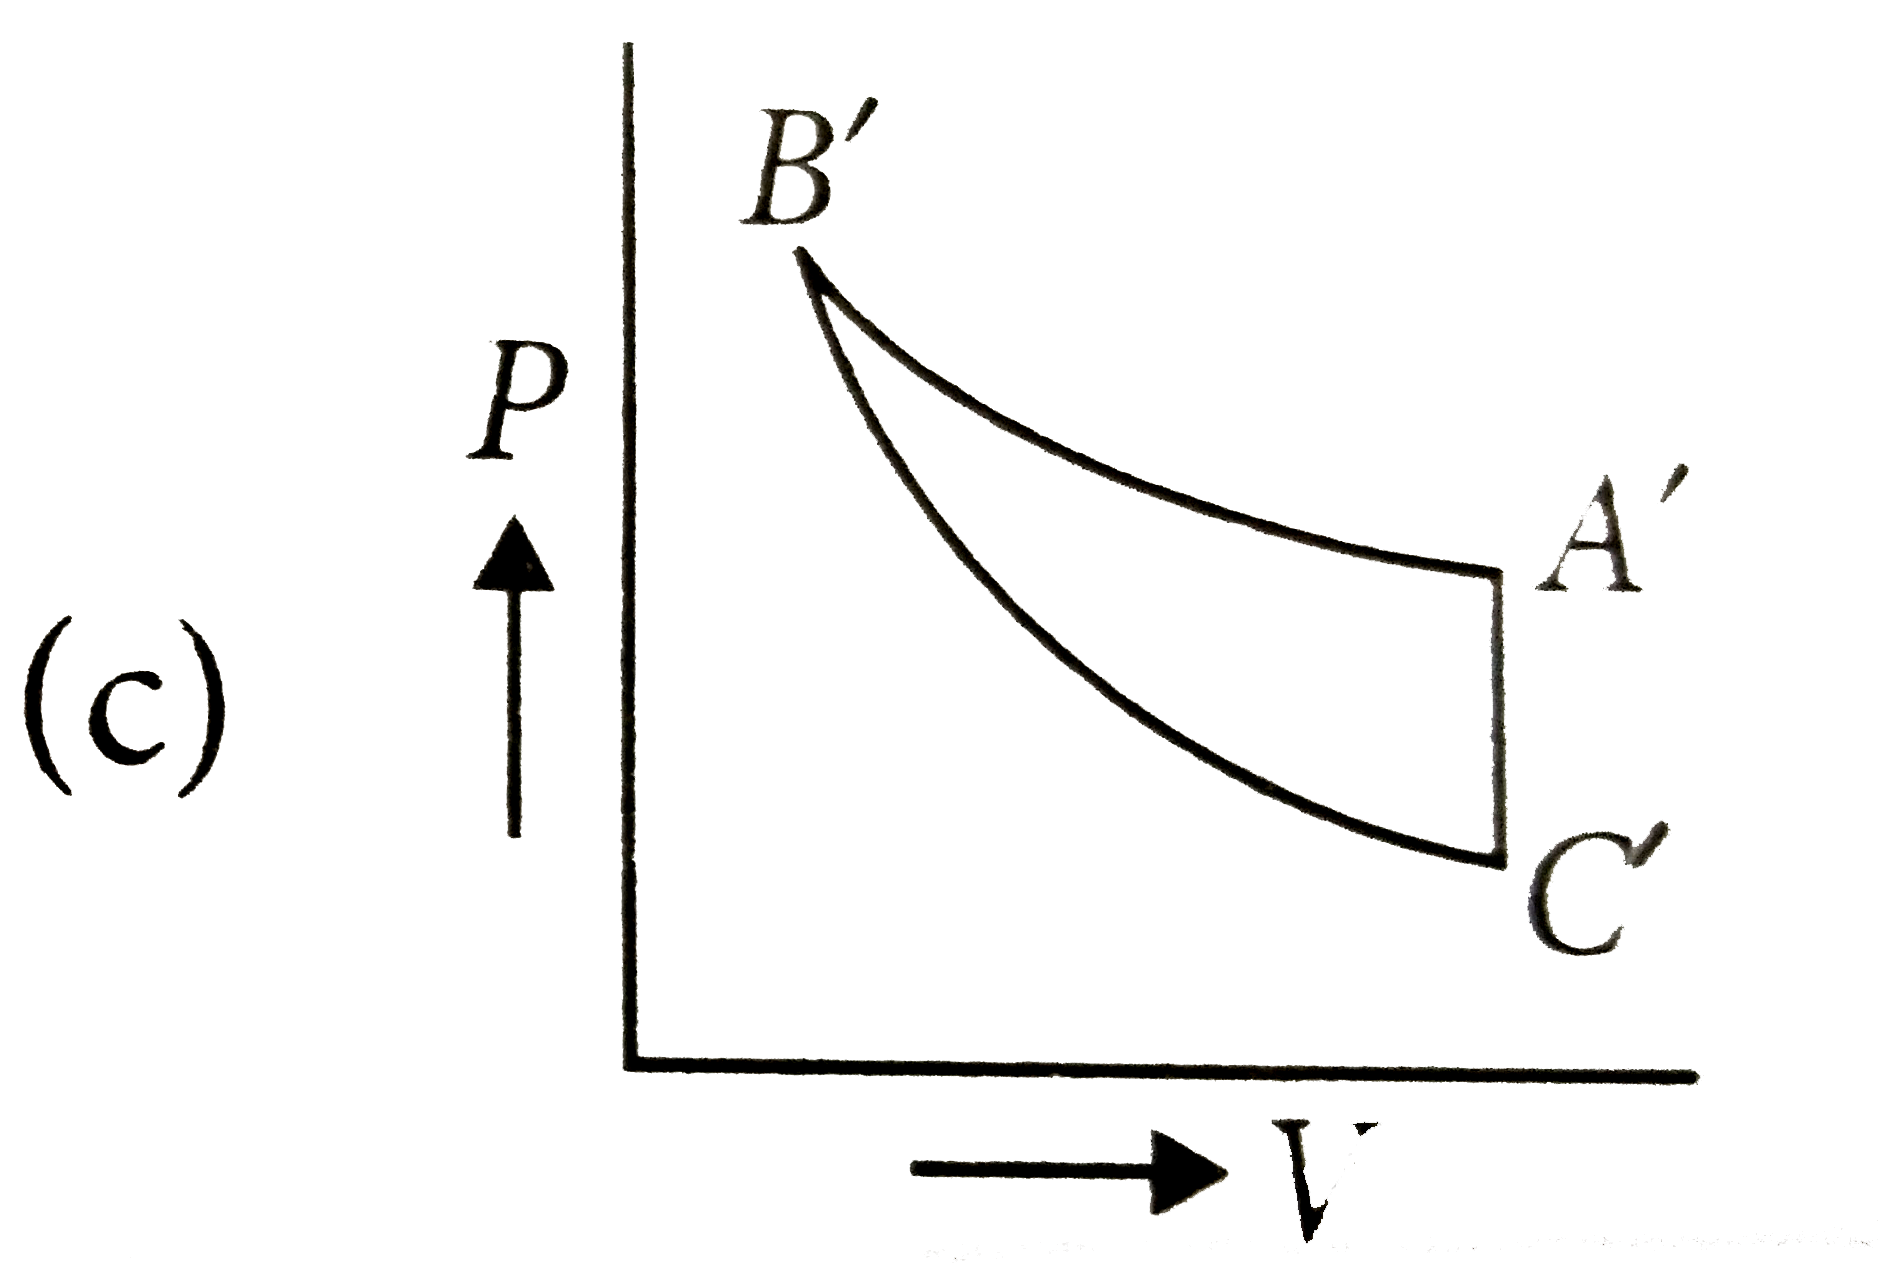 D
D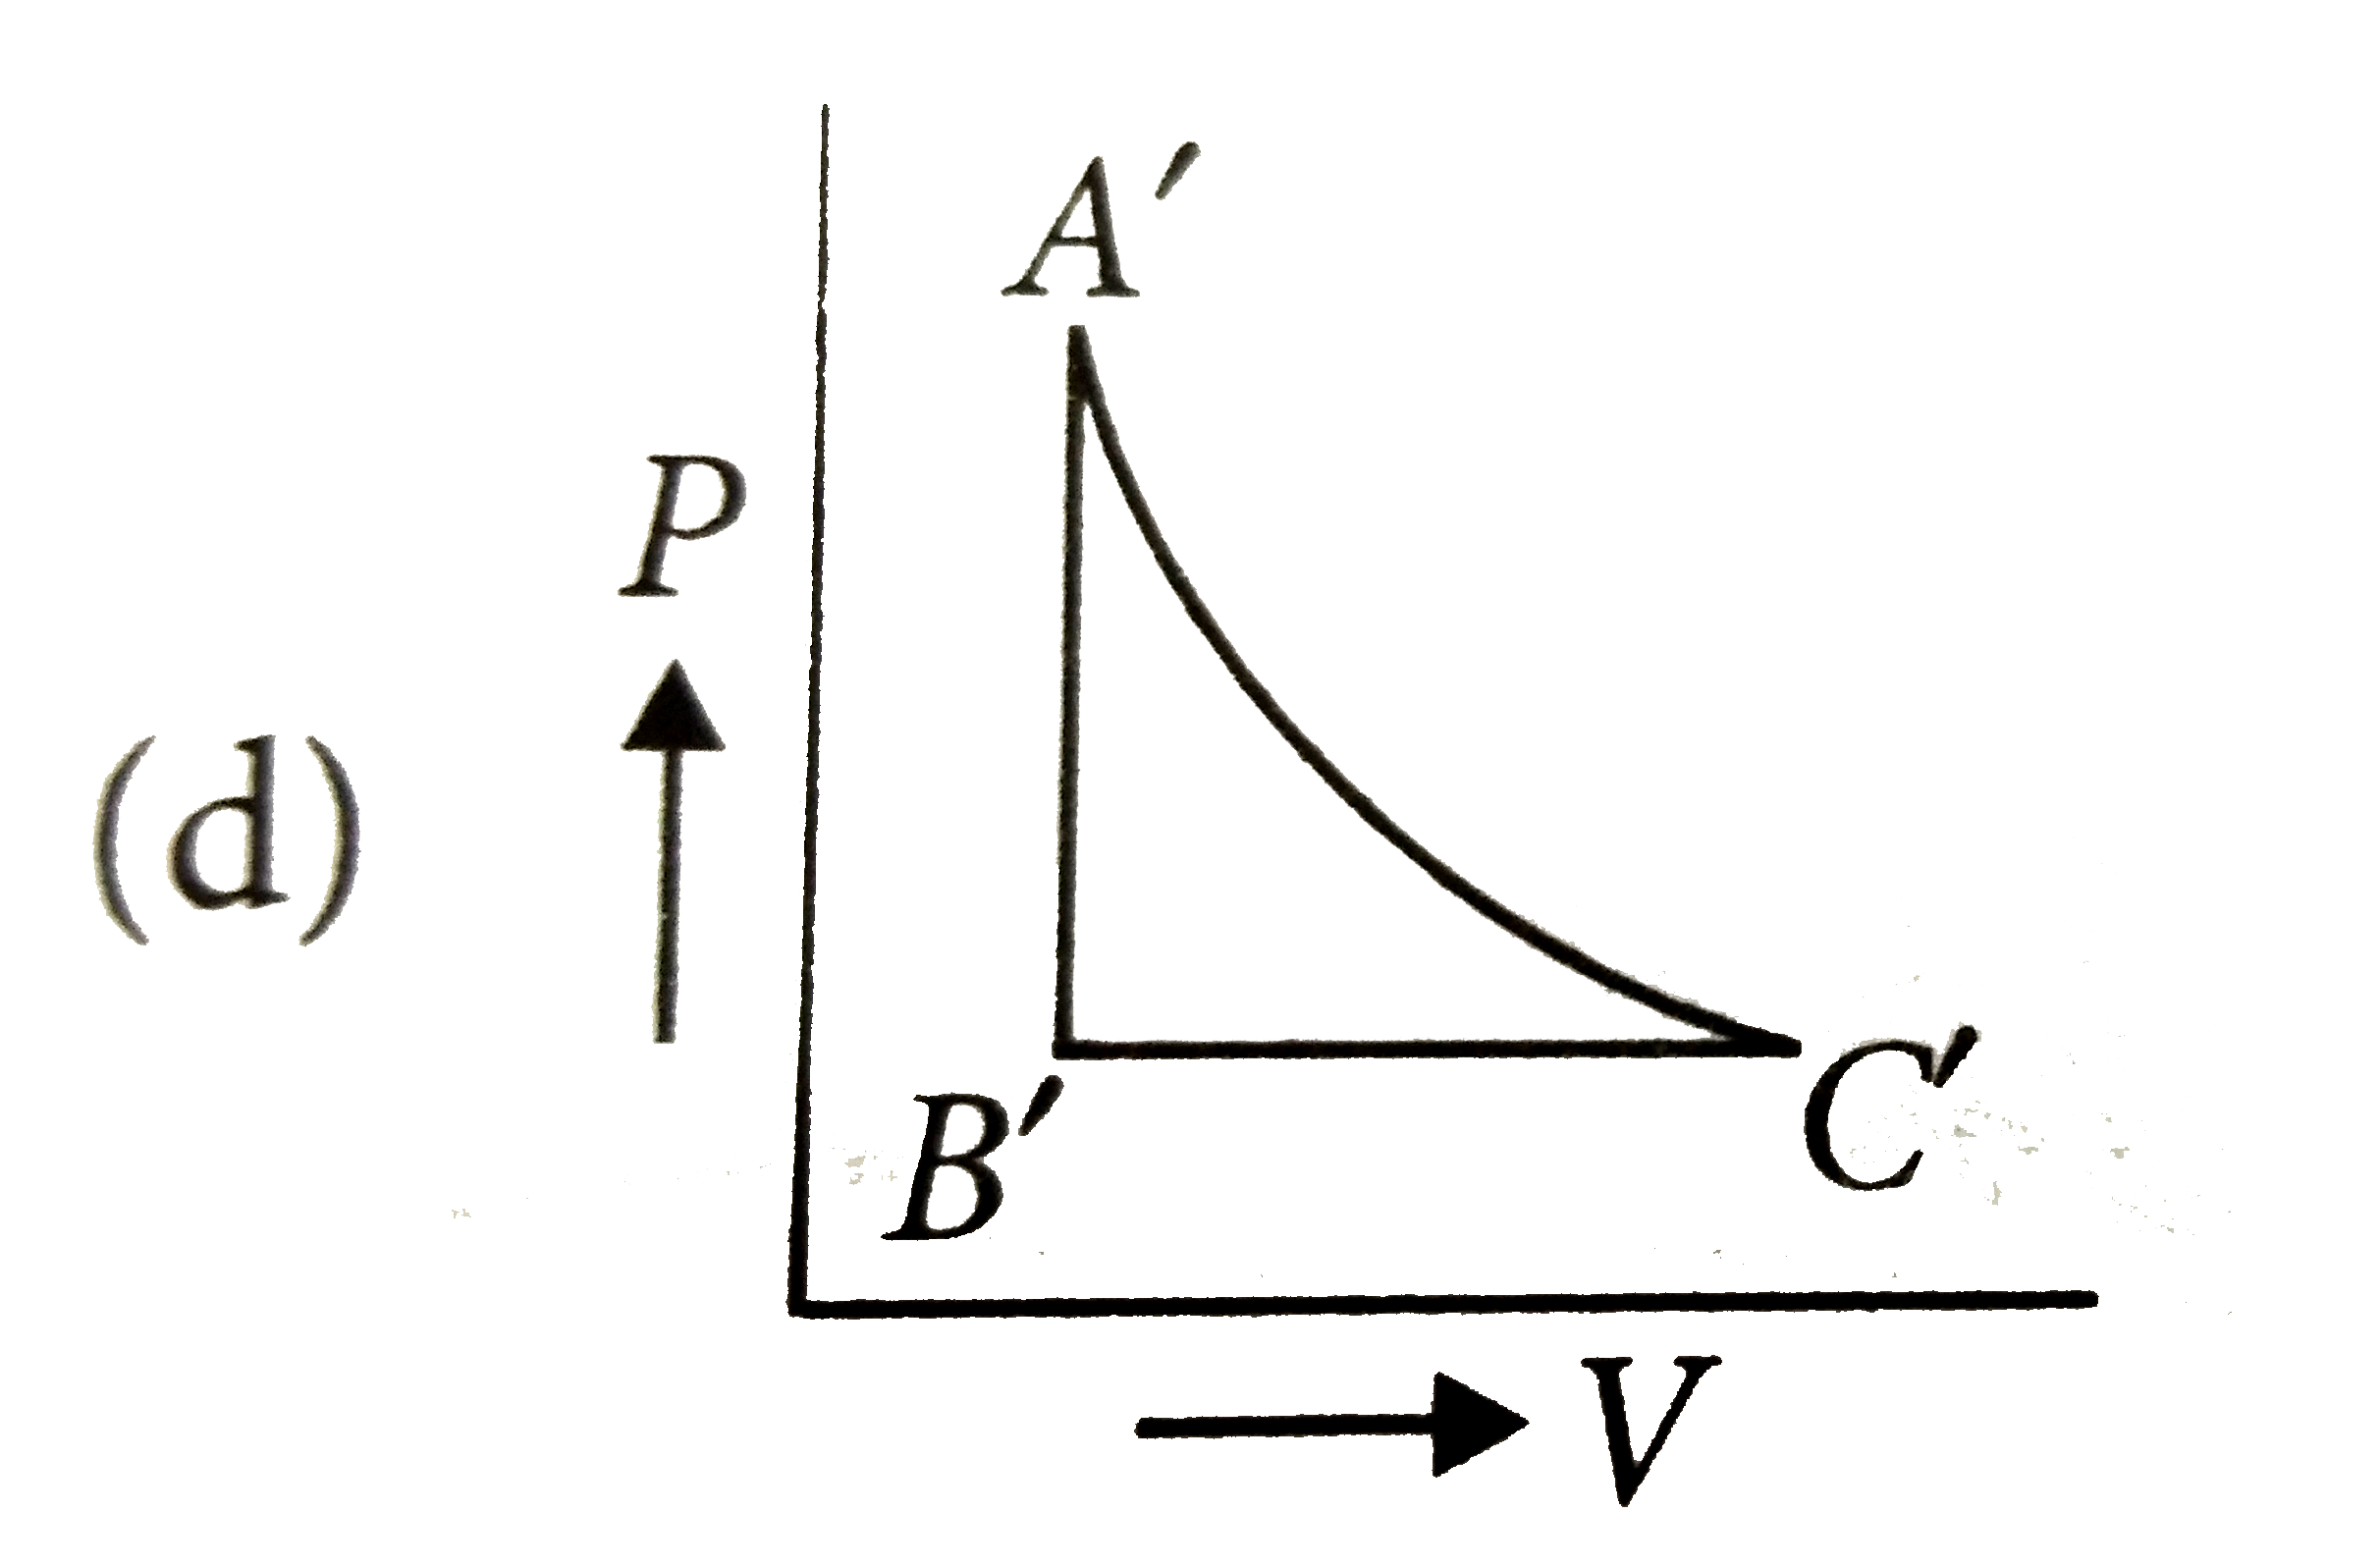
Draw at P-T curve for isobaric process.
View SolutionDraw at P-T curve for isobaric process.
View SolutionDraw at P-T curve for isochoric process.
View SolutionDraw at P-T curve for isochoric process.
View SolutionDraw P-V diagrams to show (i) isobaric process and (ii) isochoric process.
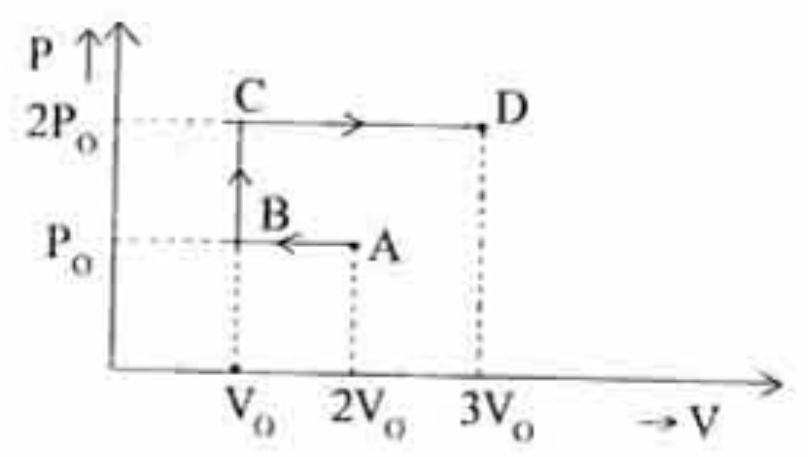
View SolutionThe work done by the gas in the process shown in given P-V diagram is
View SolutionAn ideal gas has pressure p0, volume V0 and temperature T0. It is taken an isochoric process till its pressure is doubled. It is now isothermally expanded to get the original pressure. Finally , the gas is isobarically compressed to its original volume V0. (a) Show the process on a p-V diagram. (b) What is the tempertaure in the isothermal part of the process? (c) What is the volume at the end of the isothermal part of the process?
View Solution

