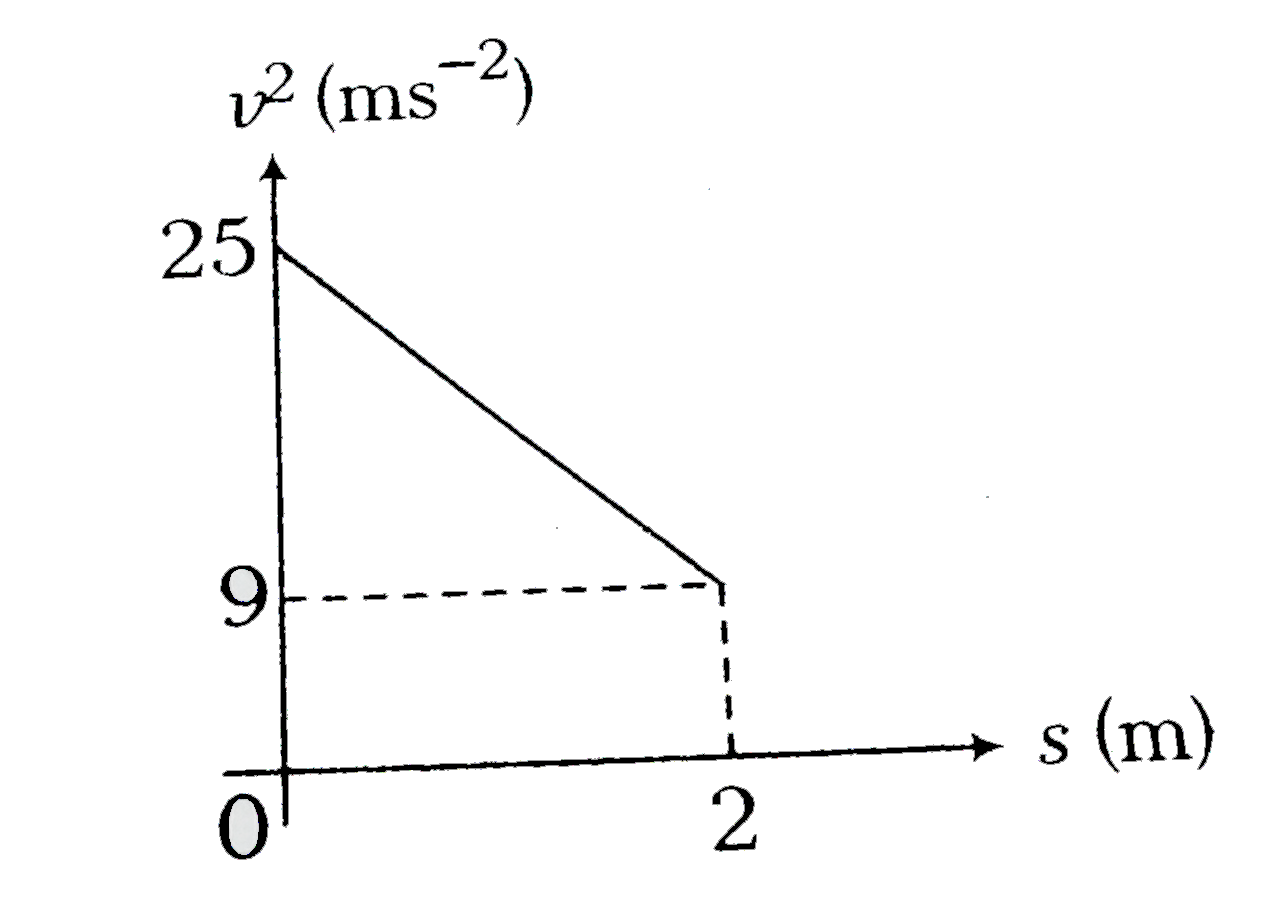
A graph between the square of the velocity of a particle and the distance s moved by the particle is shown in the figure. The acceleration of the particle is
A
−8ms−2
B
−4ms−2
C
−16ms−2
D
None of these
Video Solution
Text Solution
The correct Answer is:B
υ2=u2+2as, slope =2a=−162=−8ms−2
or a=−4ms−2
|
Topper's Solved these Questions
- MOTION IN A PLANEBOOK - DC PANDEYCHAPTER - MOTION IN A PLANEEXERCISE - Check point 3.7
15 Videos
- MOTION IN A PLANEBOOK - DC PANDEYCHAPTER - MOTION IN A PLANEEXERCISE - (A) Taking it together
75 Videos
- MOTION IN A PLANEBOOK - DC PANDEYCHAPTER - MOTION IN A PLANEEXERCISE - Check point 3.5
25 Videos
- MOTIONBOOK - DC PANDEYCHAPTER - MOTIONEXERCISE - Medical entrances gallery
19 Videos
- PROJECTILE MOTIONBOOK - DC PANDEYCHAPTER - PROJECTILE MOTIONEXERCISE - Level - 2 Subjective
10 Videos
Similar Questions
Knowledge Check
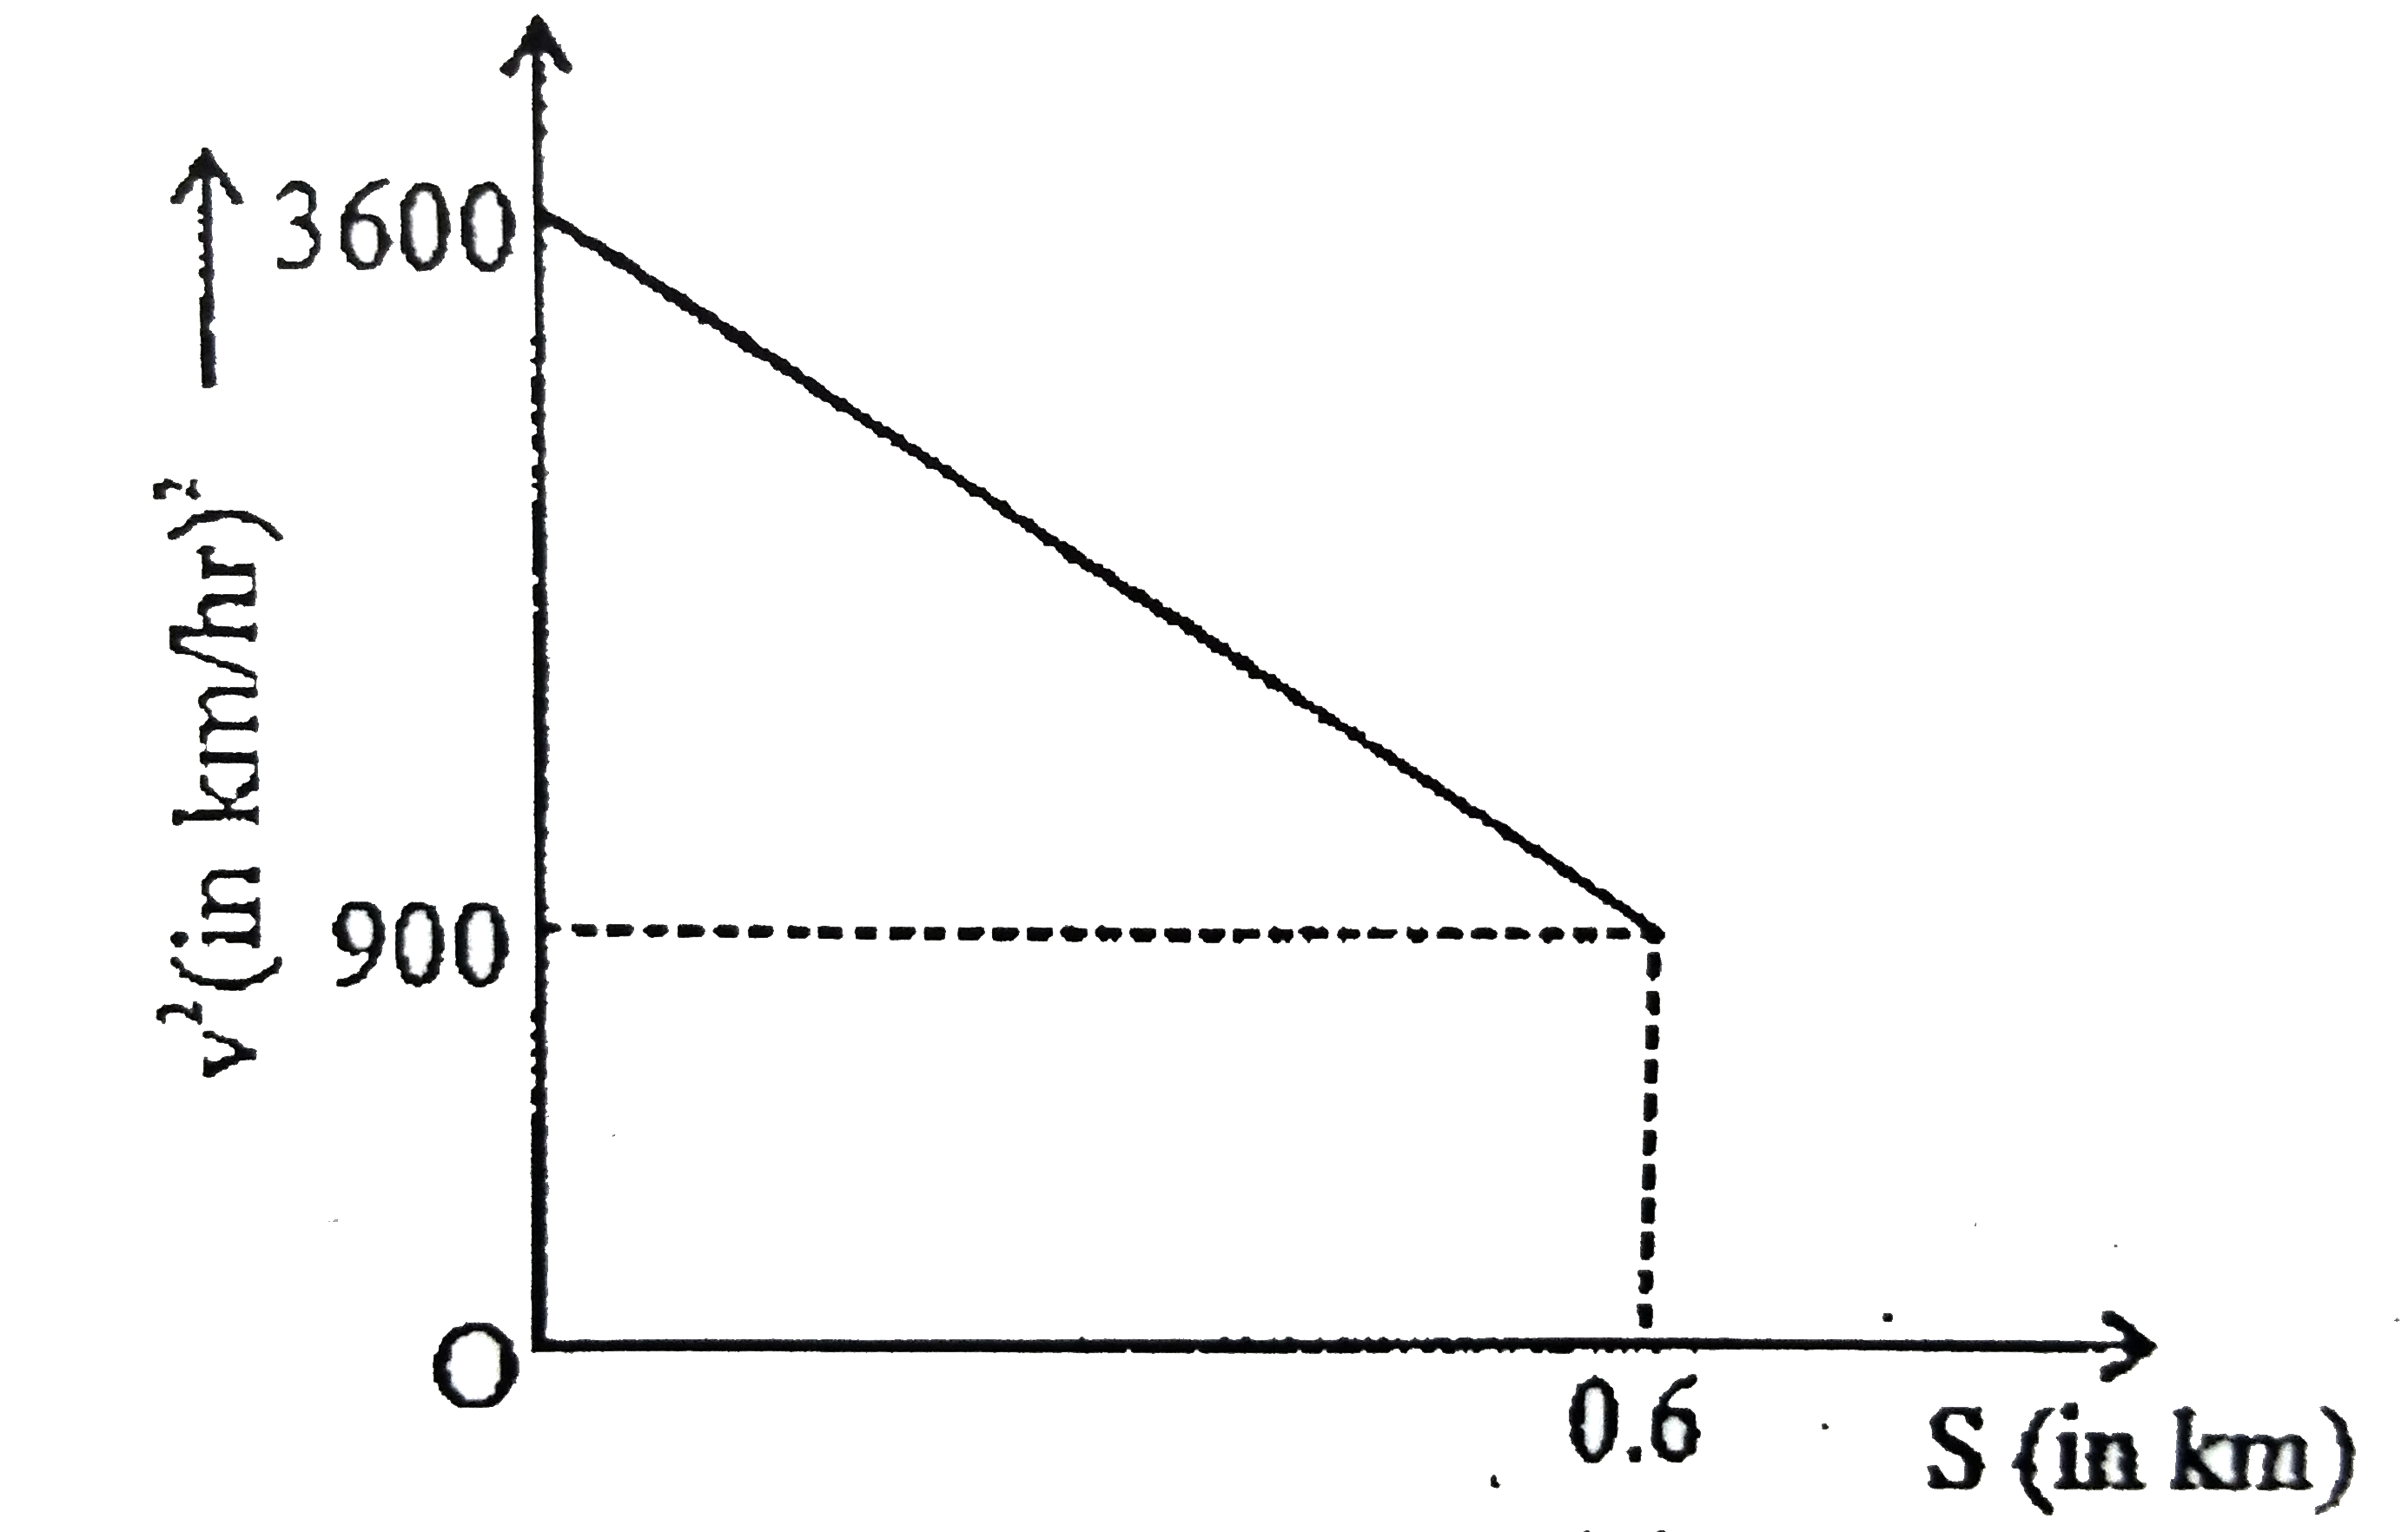
A graph between the square of the velocity of a particle and the distance 'S' moved by the particle is shown in the figure. The acceleration of the particle in kilometer per hour square is
 A2250B225C−2250D−1225
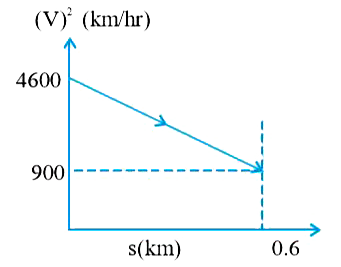
A graph between the square of the velocity of a particle and the distance(s) moved is shown in figure. The acceleration of the particle in kilometers per hour square is:-
 A2250B3084C-2250D-3084
A graph between the square of the velocity of a particle and the distance(s) moved is shown in figure. The constant acceleration of the particle in kilometer per hour square is:
 A2250B3084C−2250D−3084
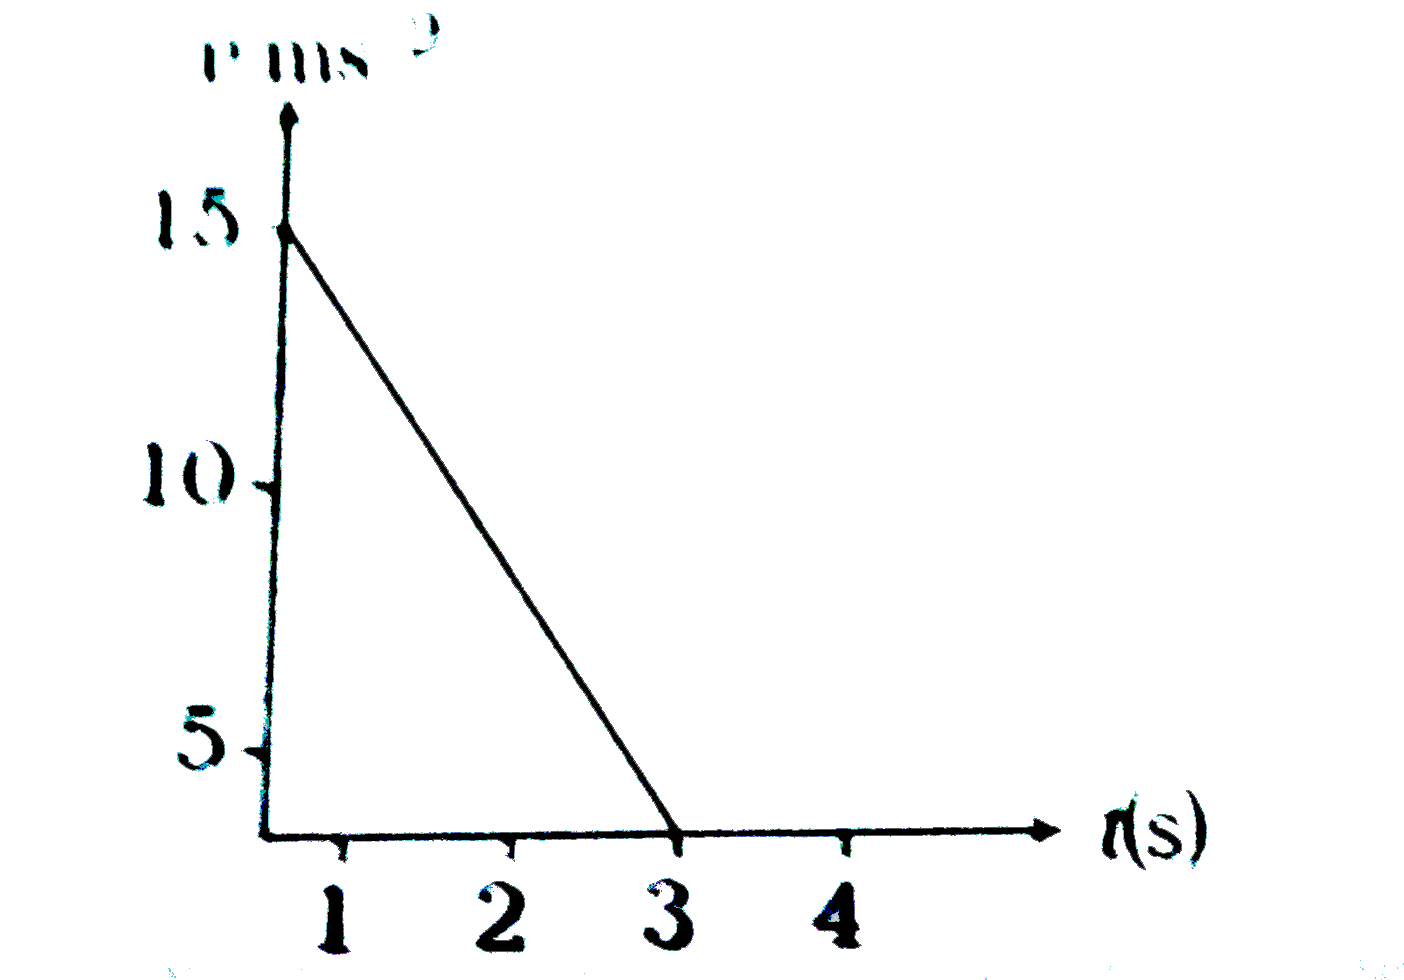
The velocity - time graph is shown in the figure, for a particle. The acceleration of particle is
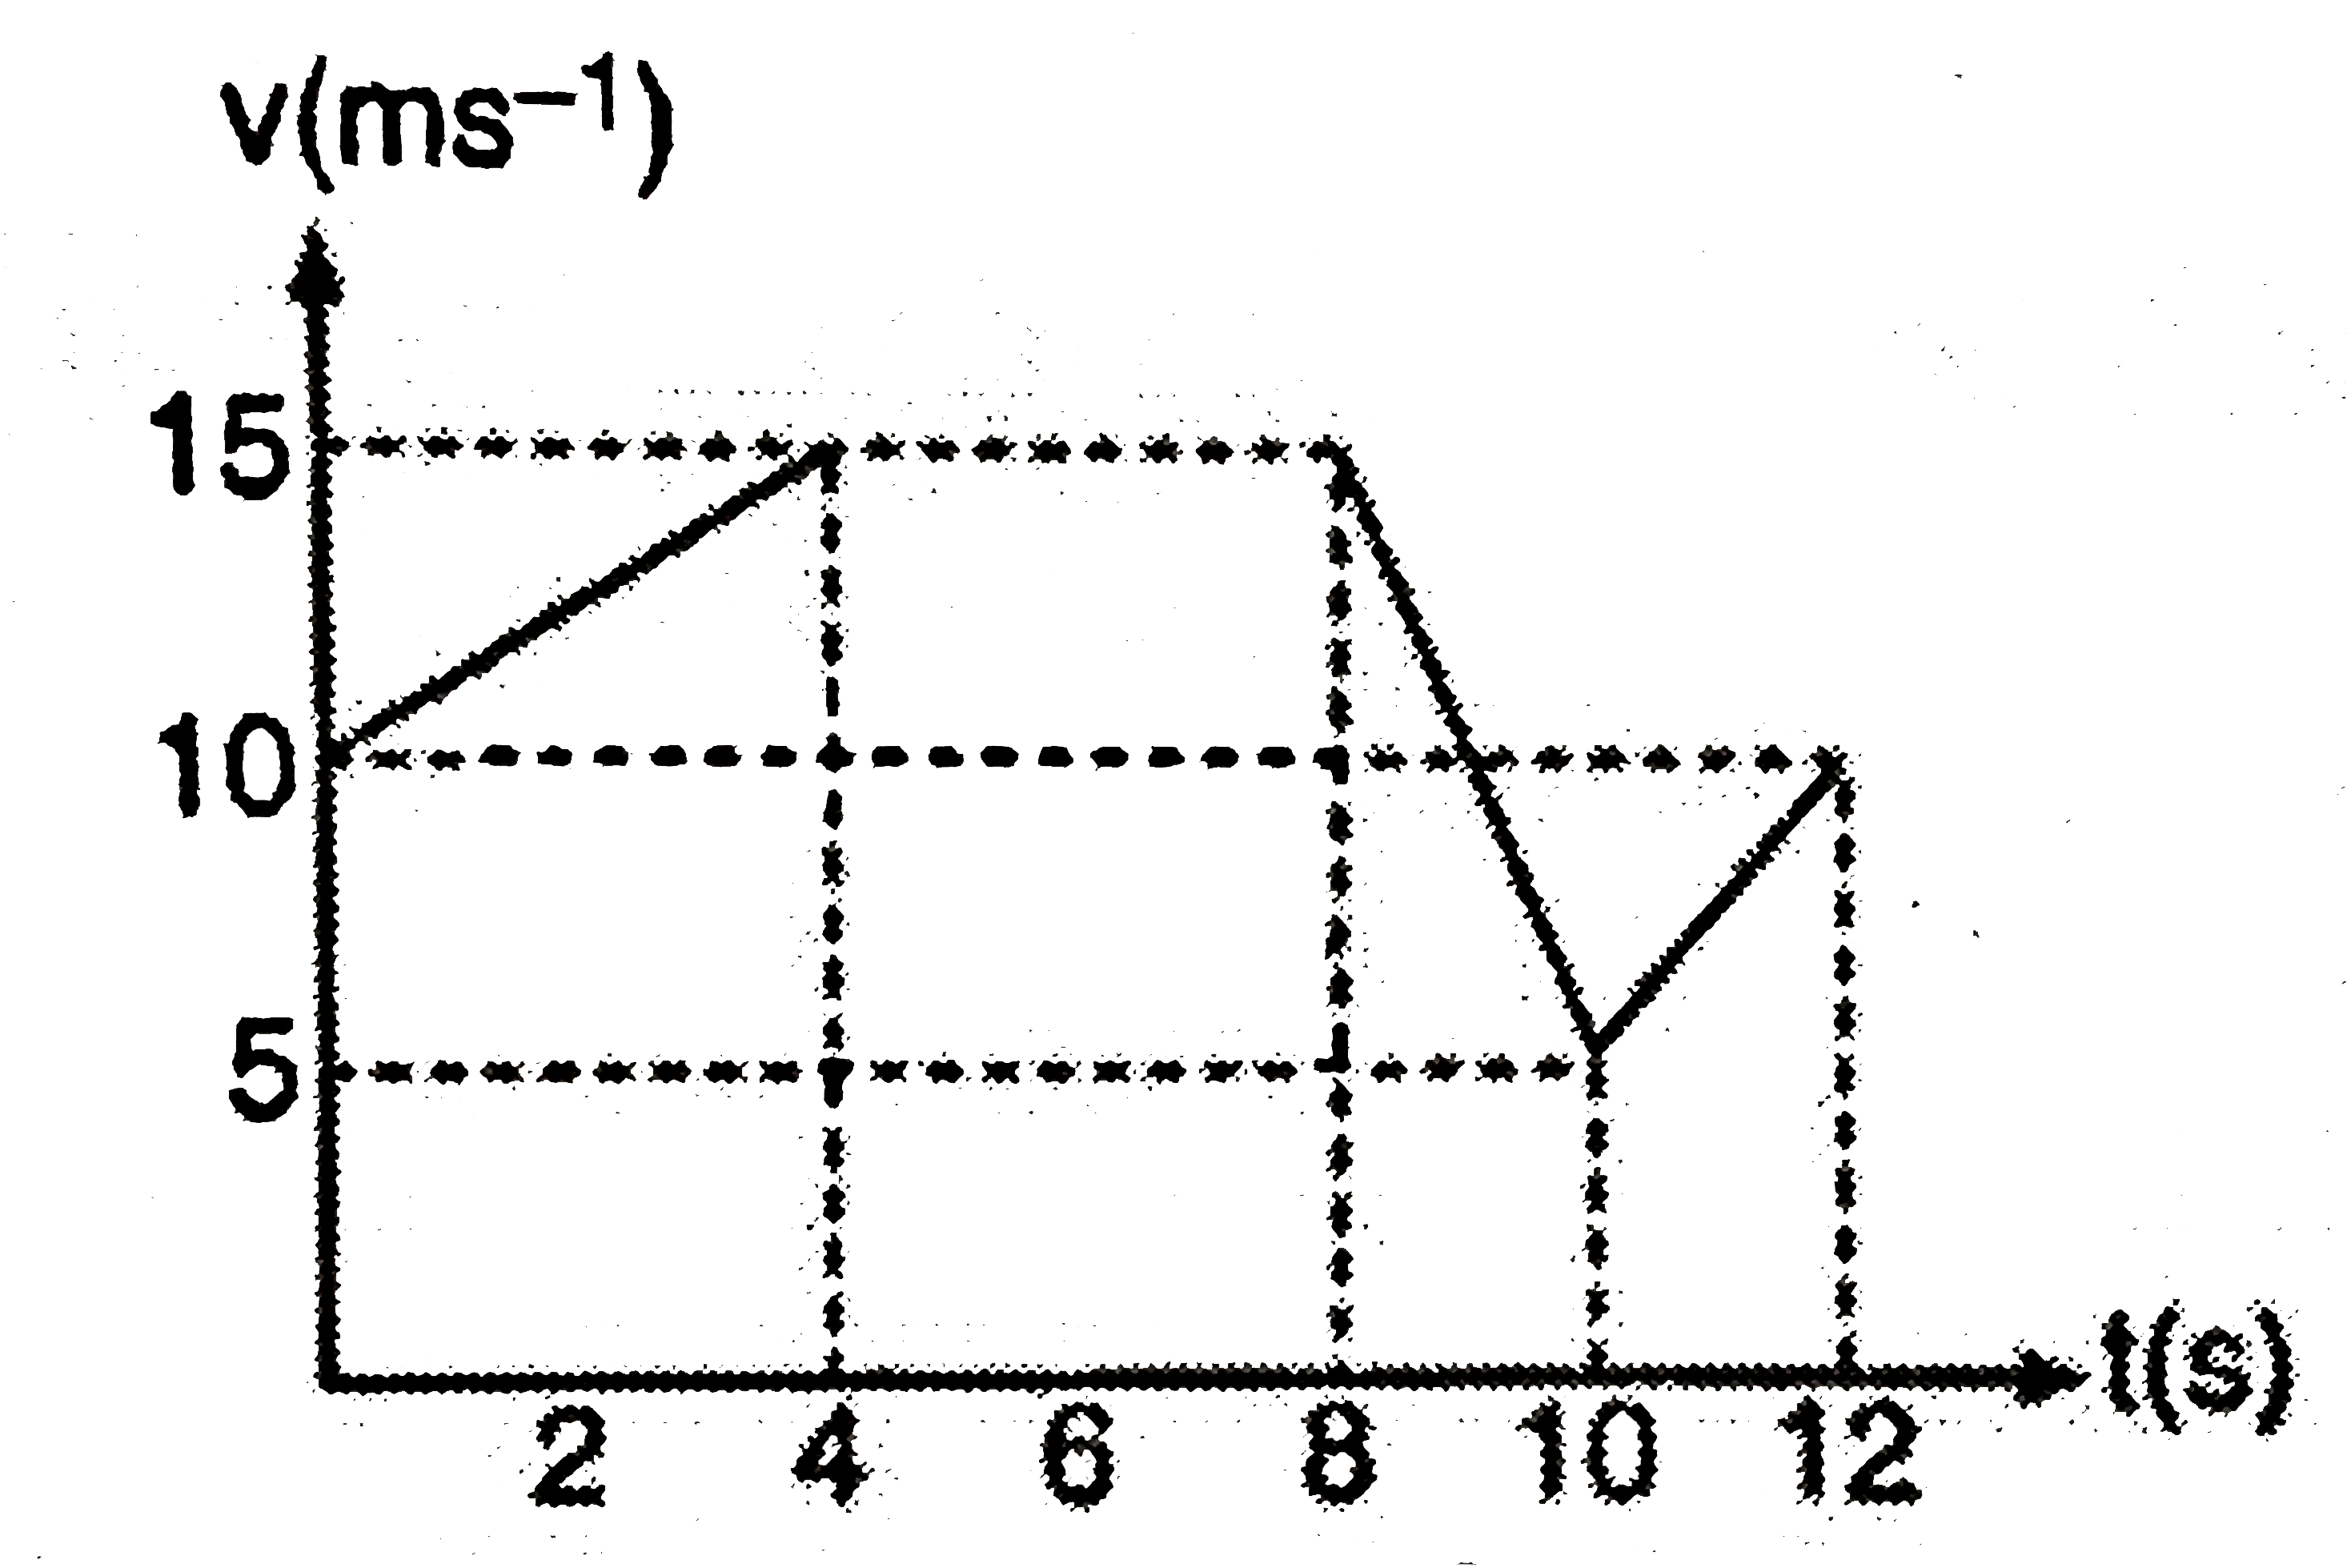
View SolutionThe velocity -time (v−t) graph of a particle moving in a straight line is shown in figure. The acceleration of the particle at t=9 is:
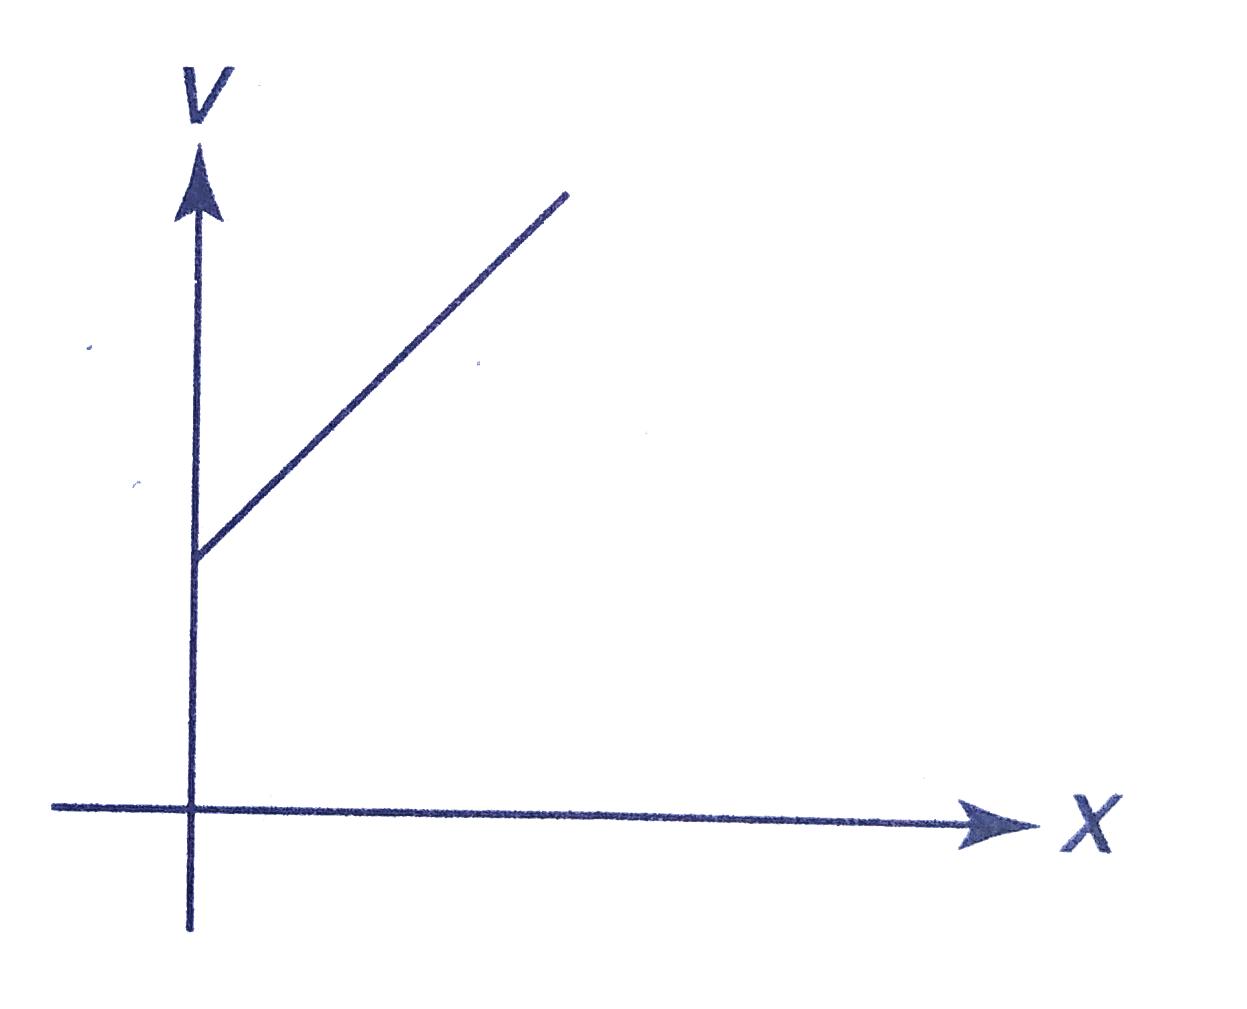
View SolutionGraph of velocity versus displacement of a particle moving in a straight line is as shown in figure.
The acceleration of the particle is.
View SolutionThe velovity-time graph of a particle moving in a straitht line is shown in . The acceleration of the particle at t=9s is.
 .
.
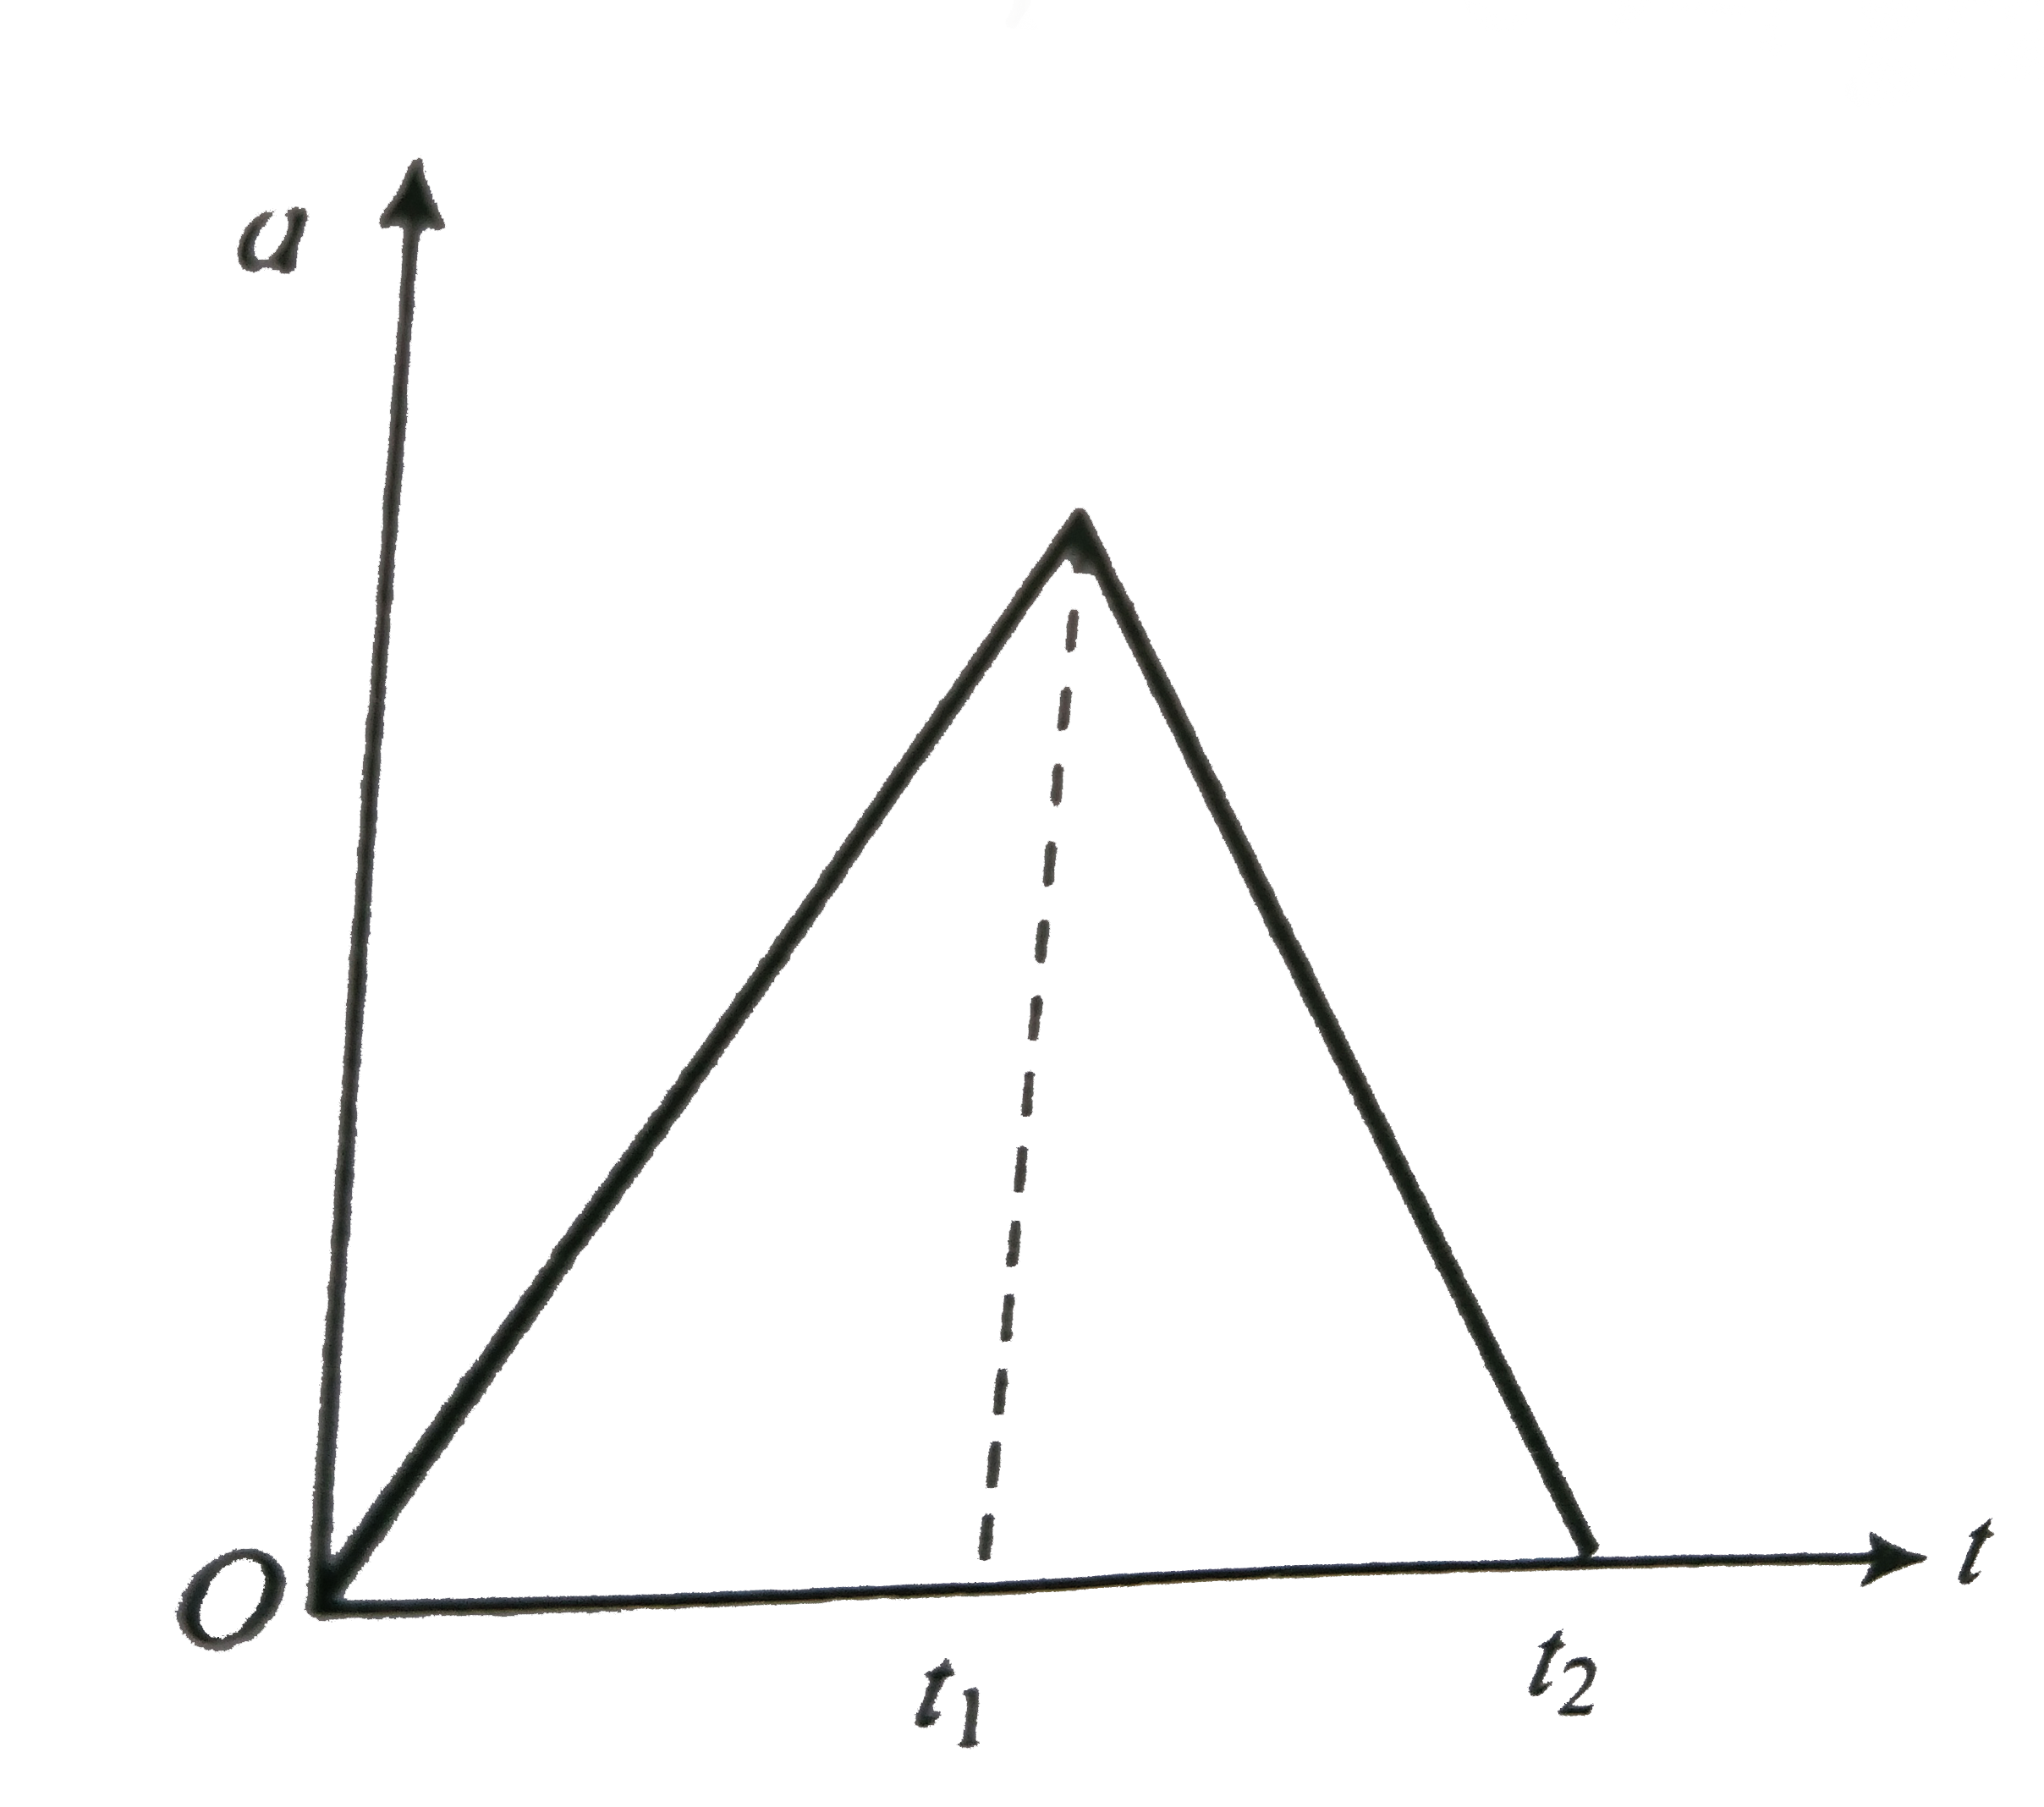
View SolutionThe acceleration versus time graph of a particle is shown in the figure. The respective v−t graph of the particle is .
 .
.
View Solution

