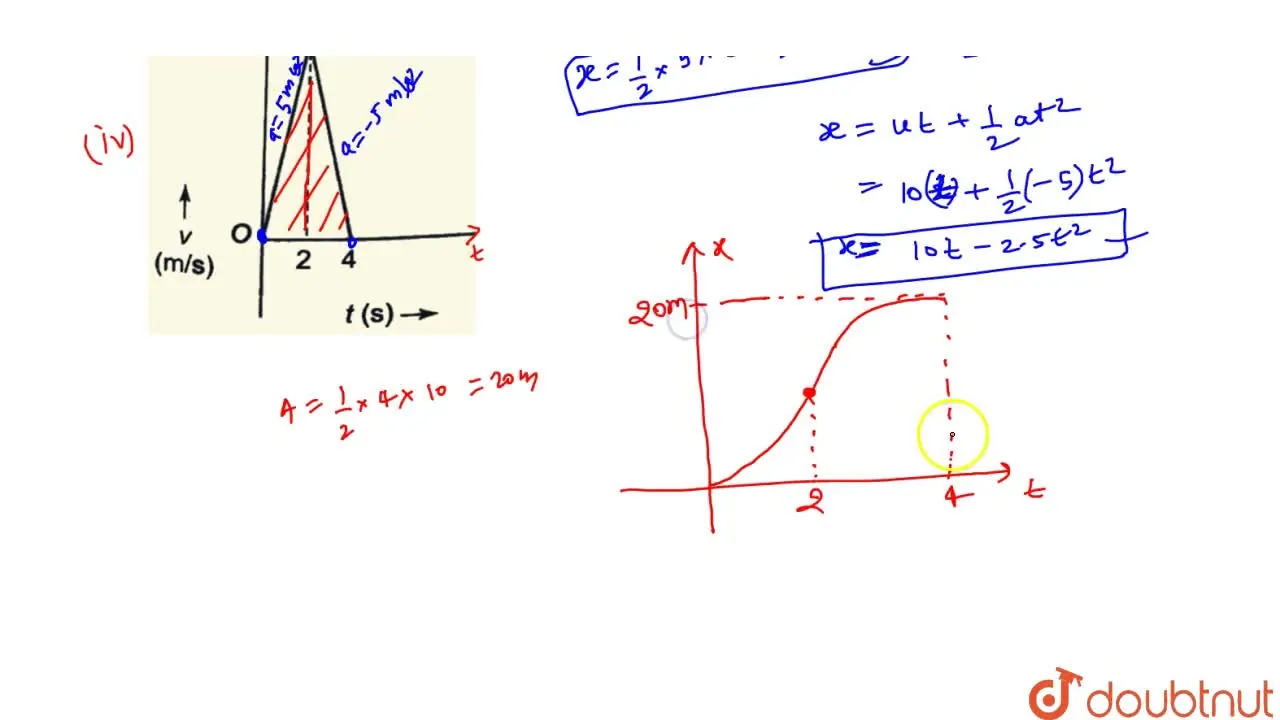
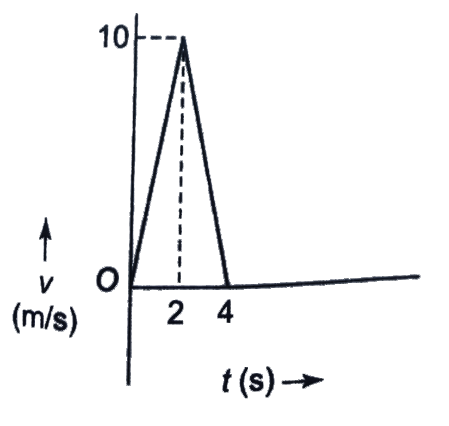
A partical is moving along the x-axis and its velocity-time graph is shown in following diagrams. Sketch displacement-time graph.
(a) 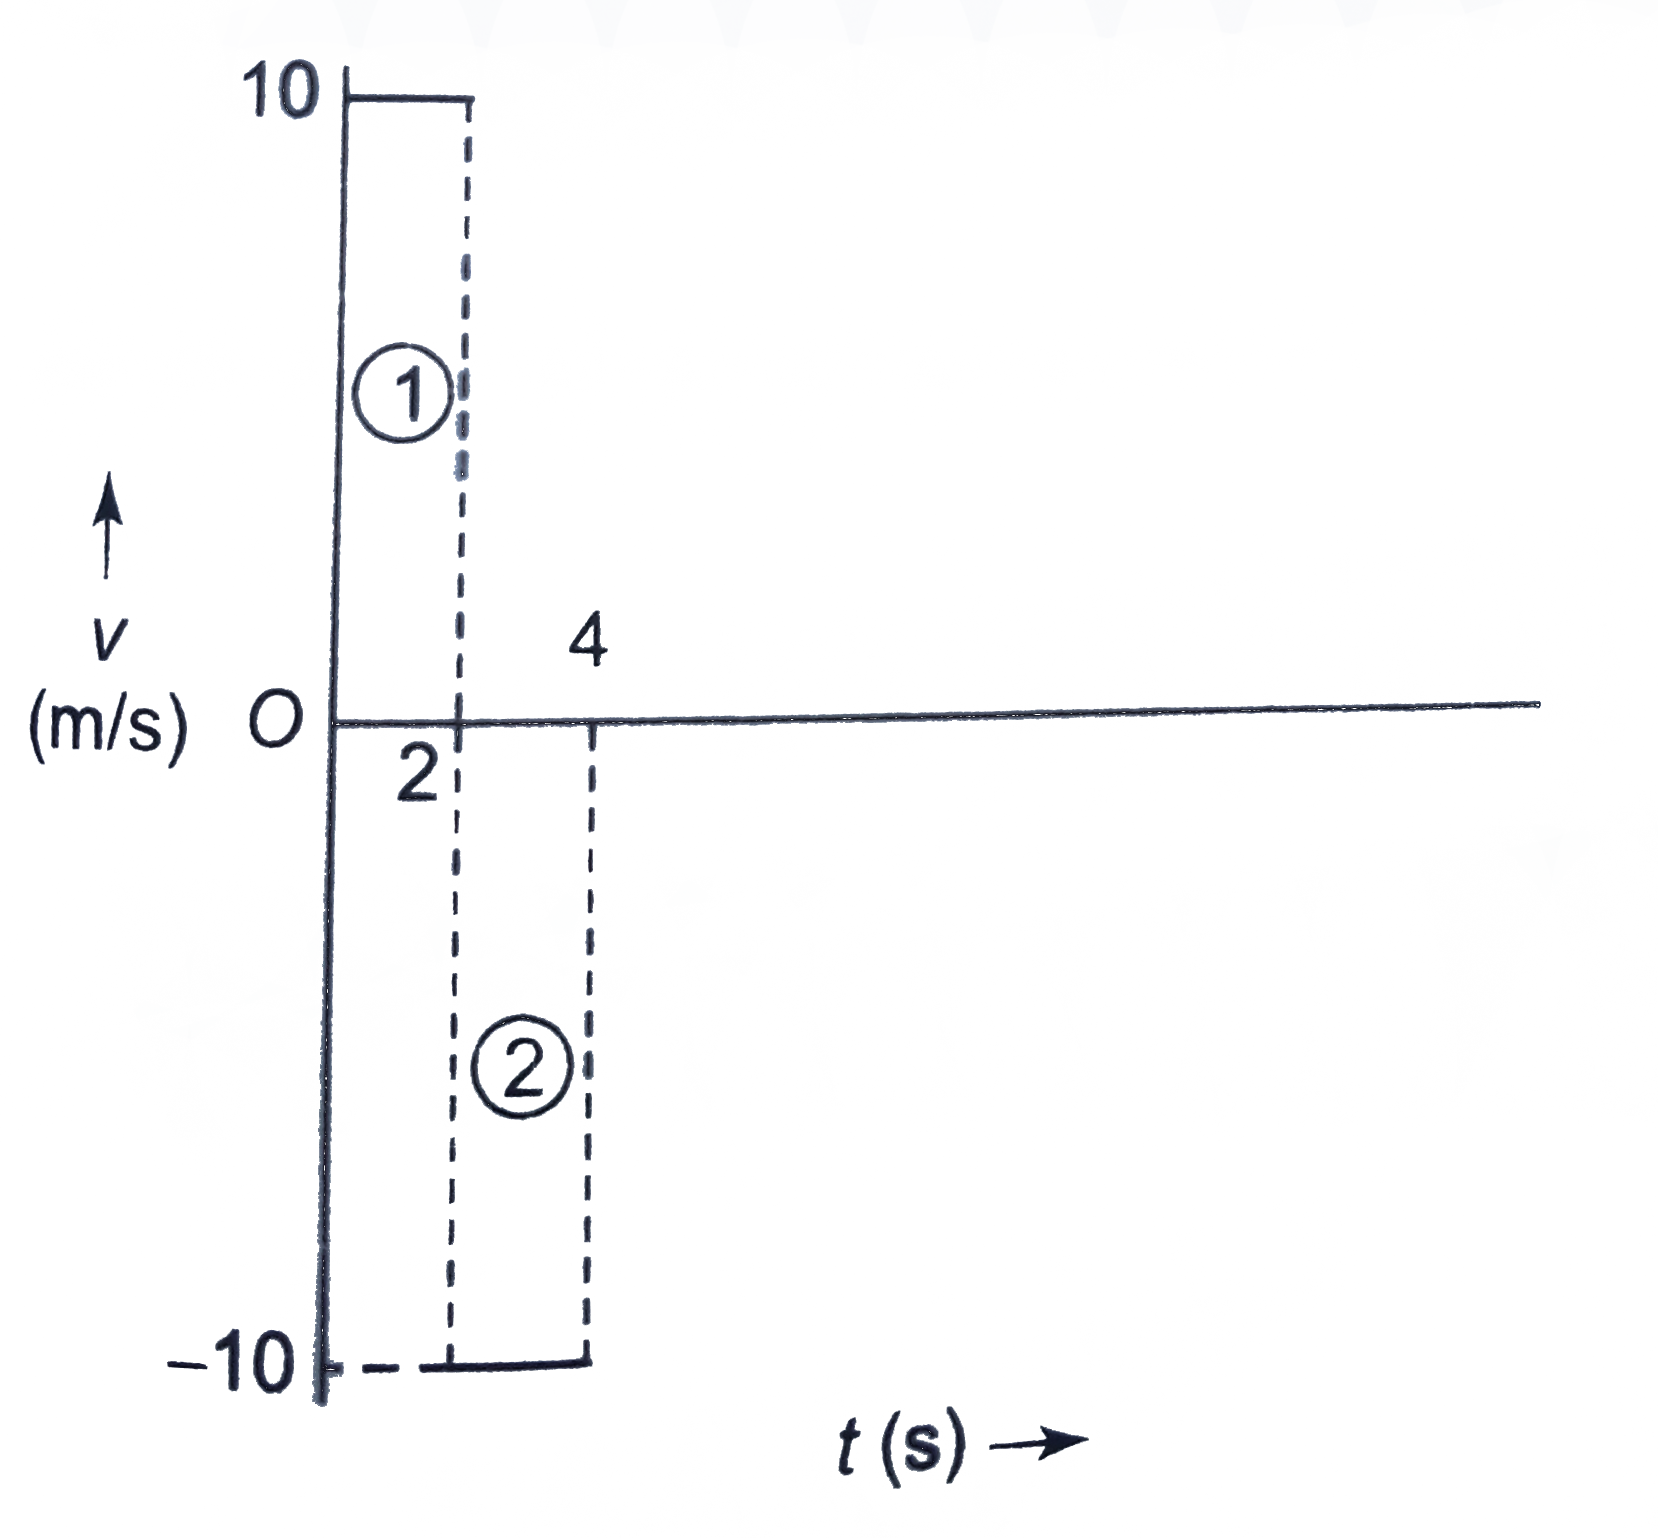
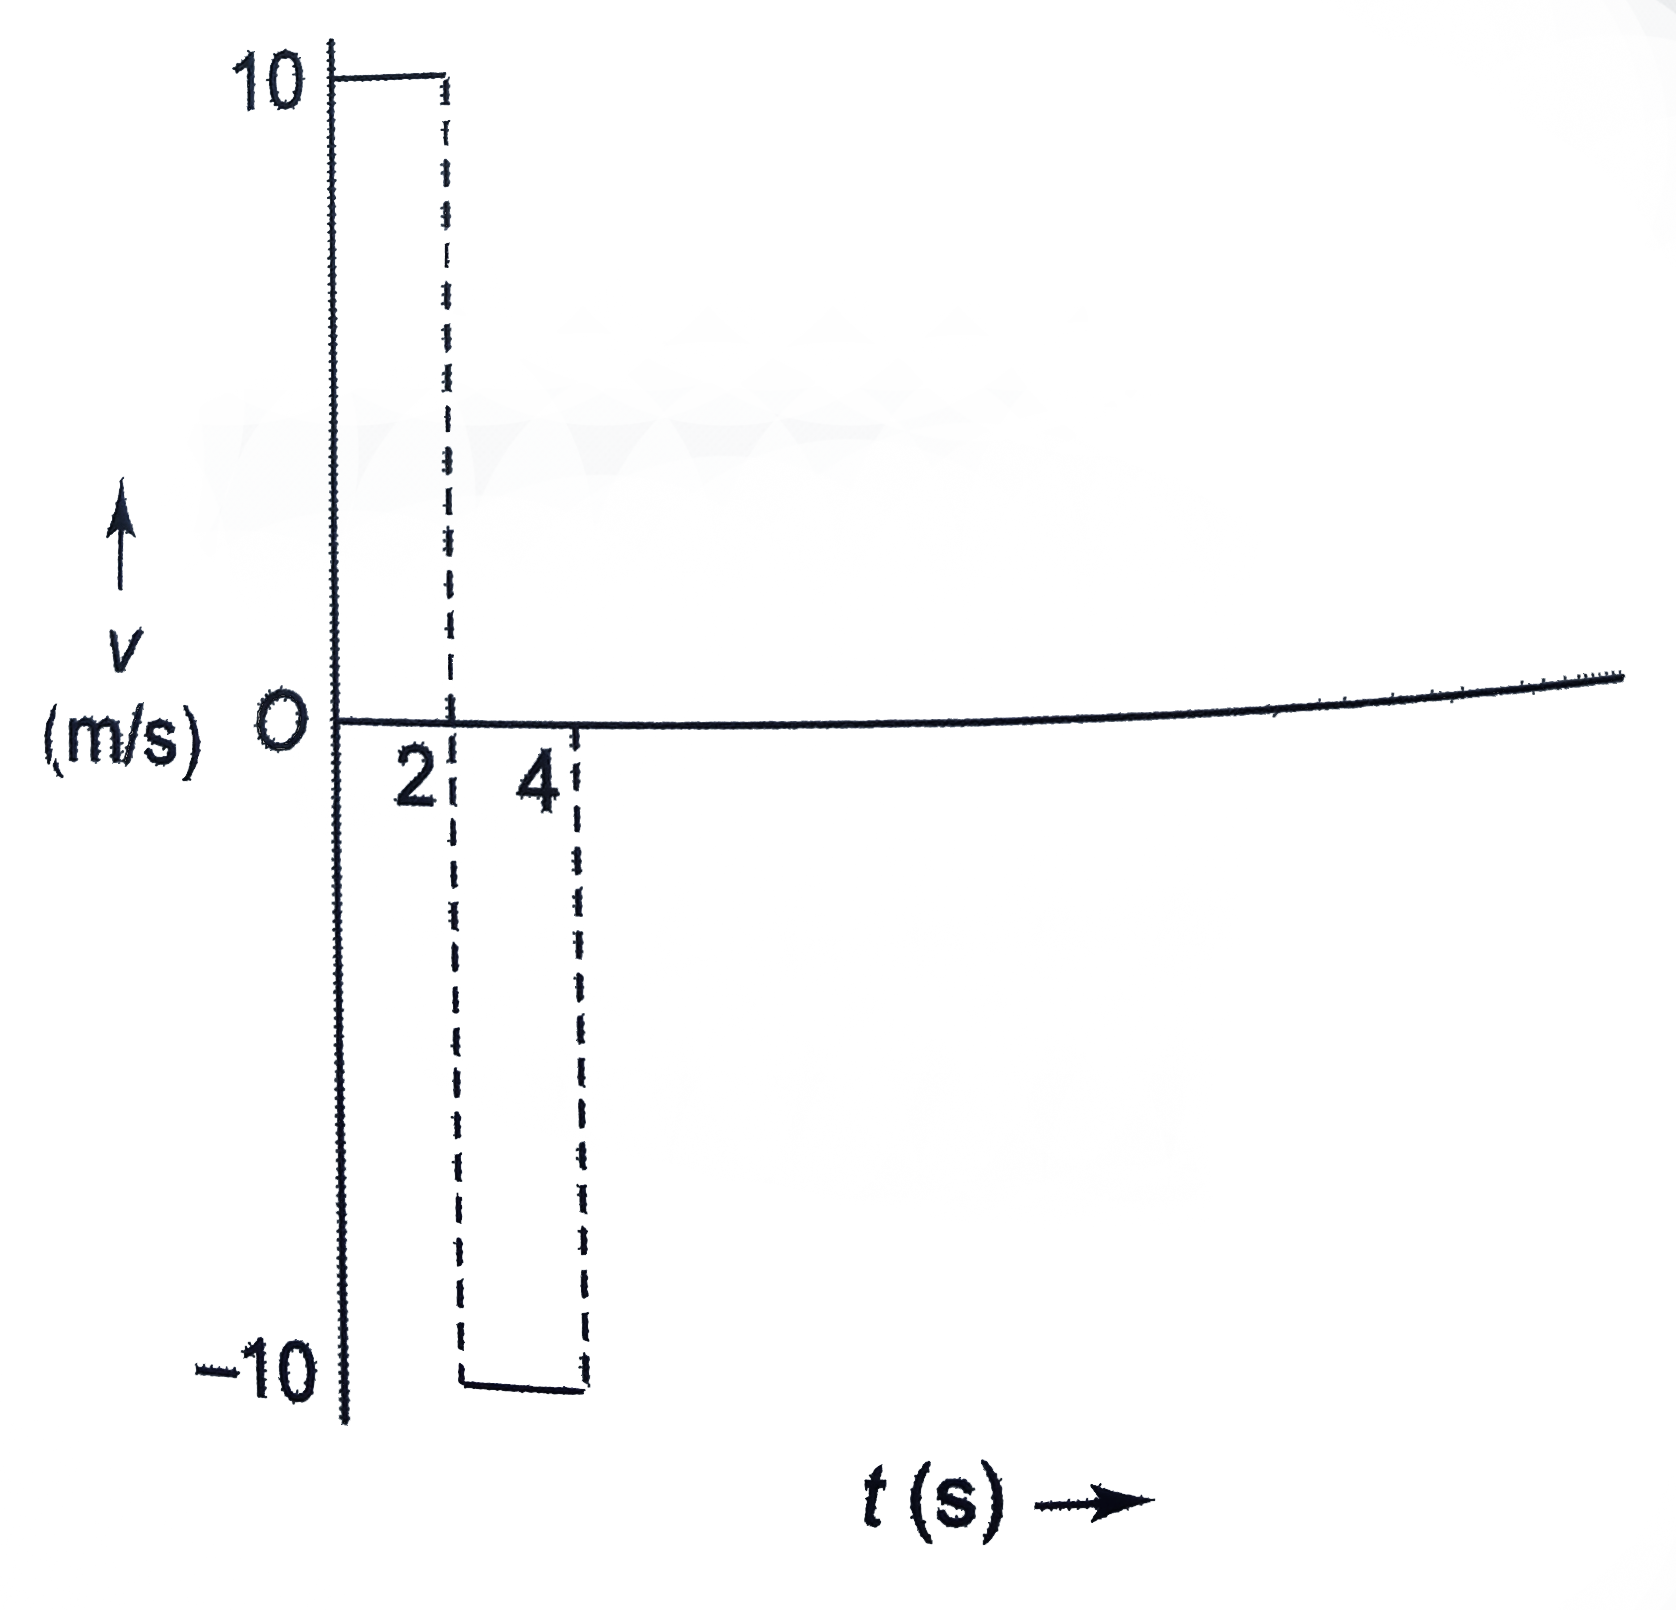
Area of the v-t graph gives displacement.
Area(1)=20
Area(2)=−20
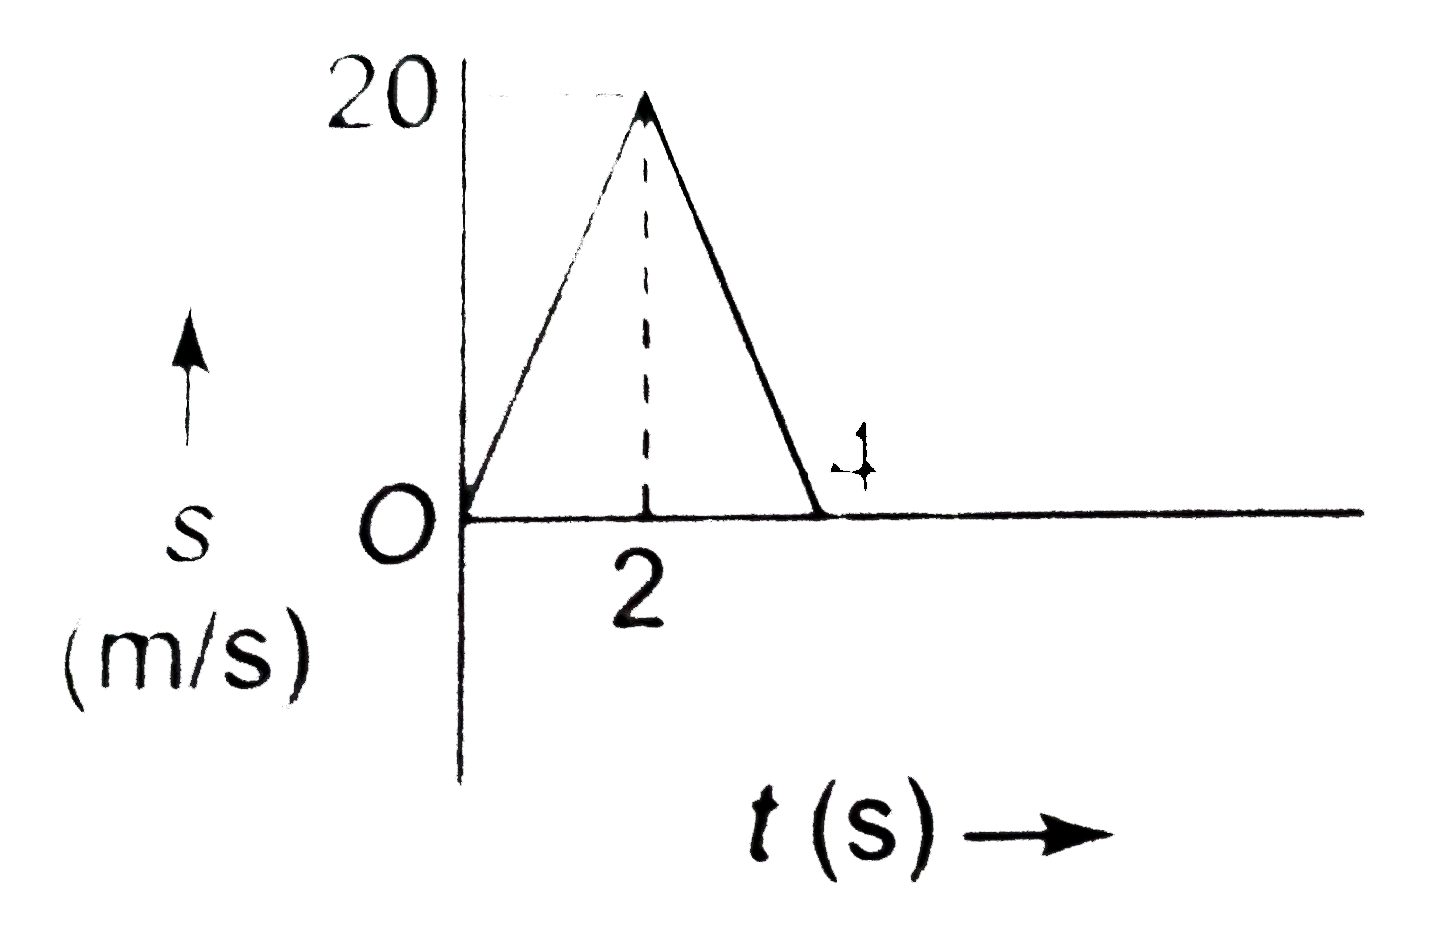
t=0 to t=2s, Displacement=20
t=0 to t=4s, Displacement=0
t=0 to t=2s, is +ve and constant and hence the slope of the s-t graph is positive and constant, graph will be a straight line of positive slope.
t=2 to t=4s, v is -ve and constant and the slope of the s-t graph is -ve and constant, graph will be a straight line of -ve slope.
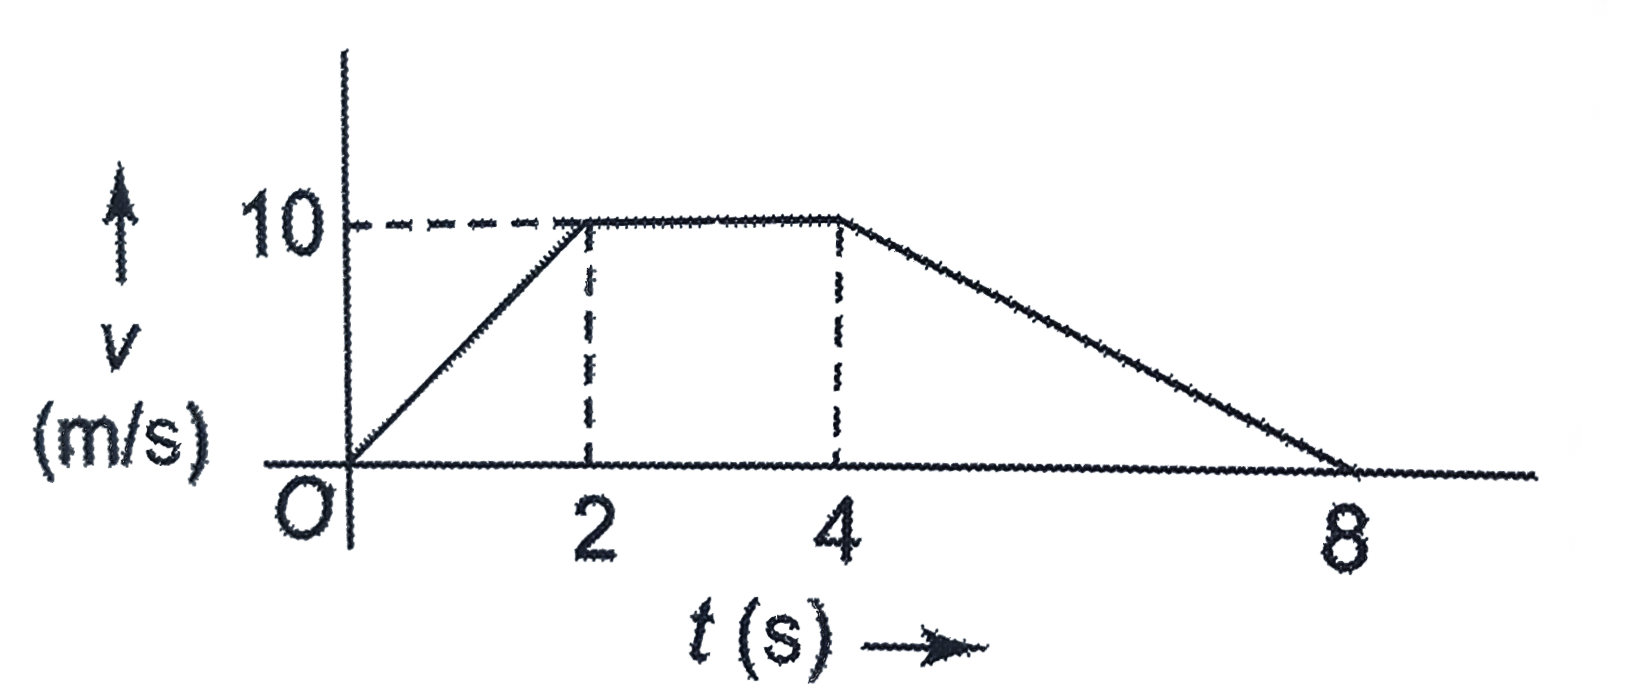
(b) 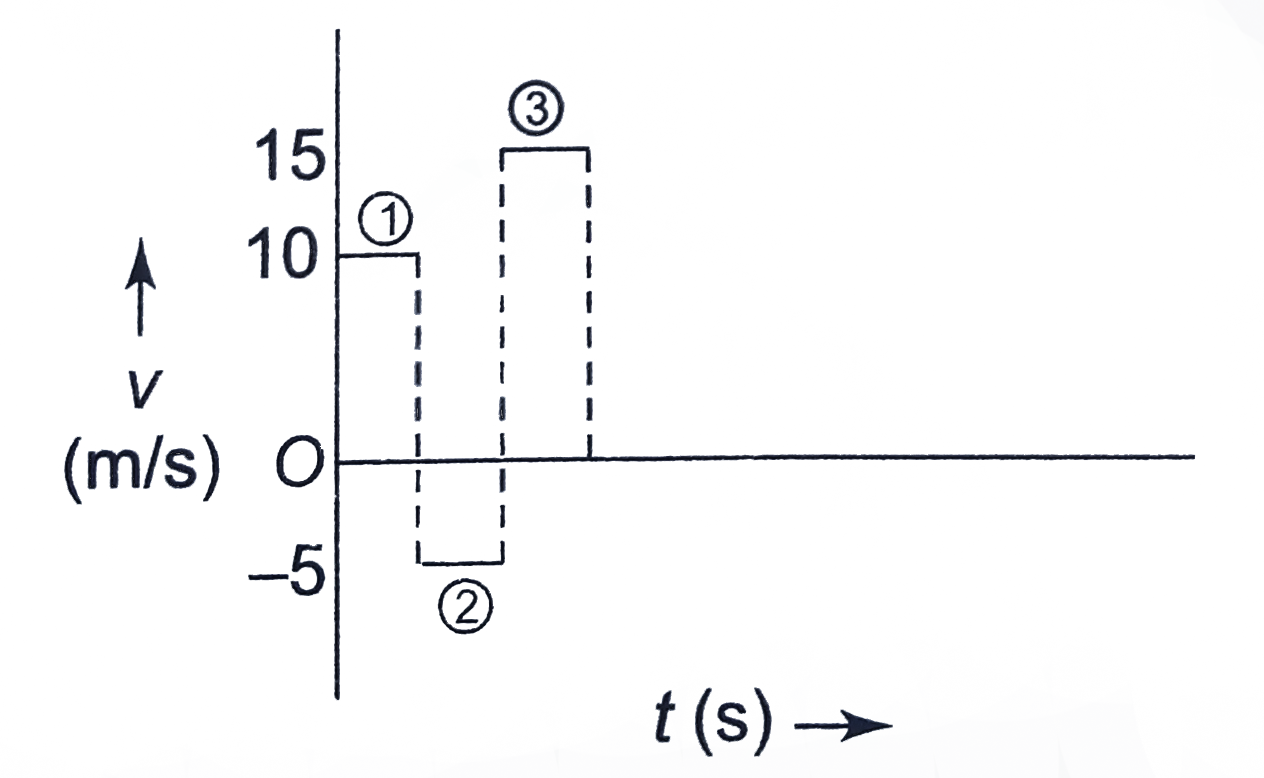
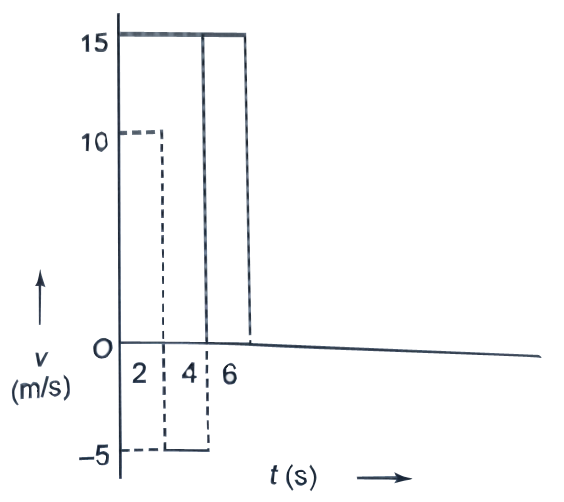
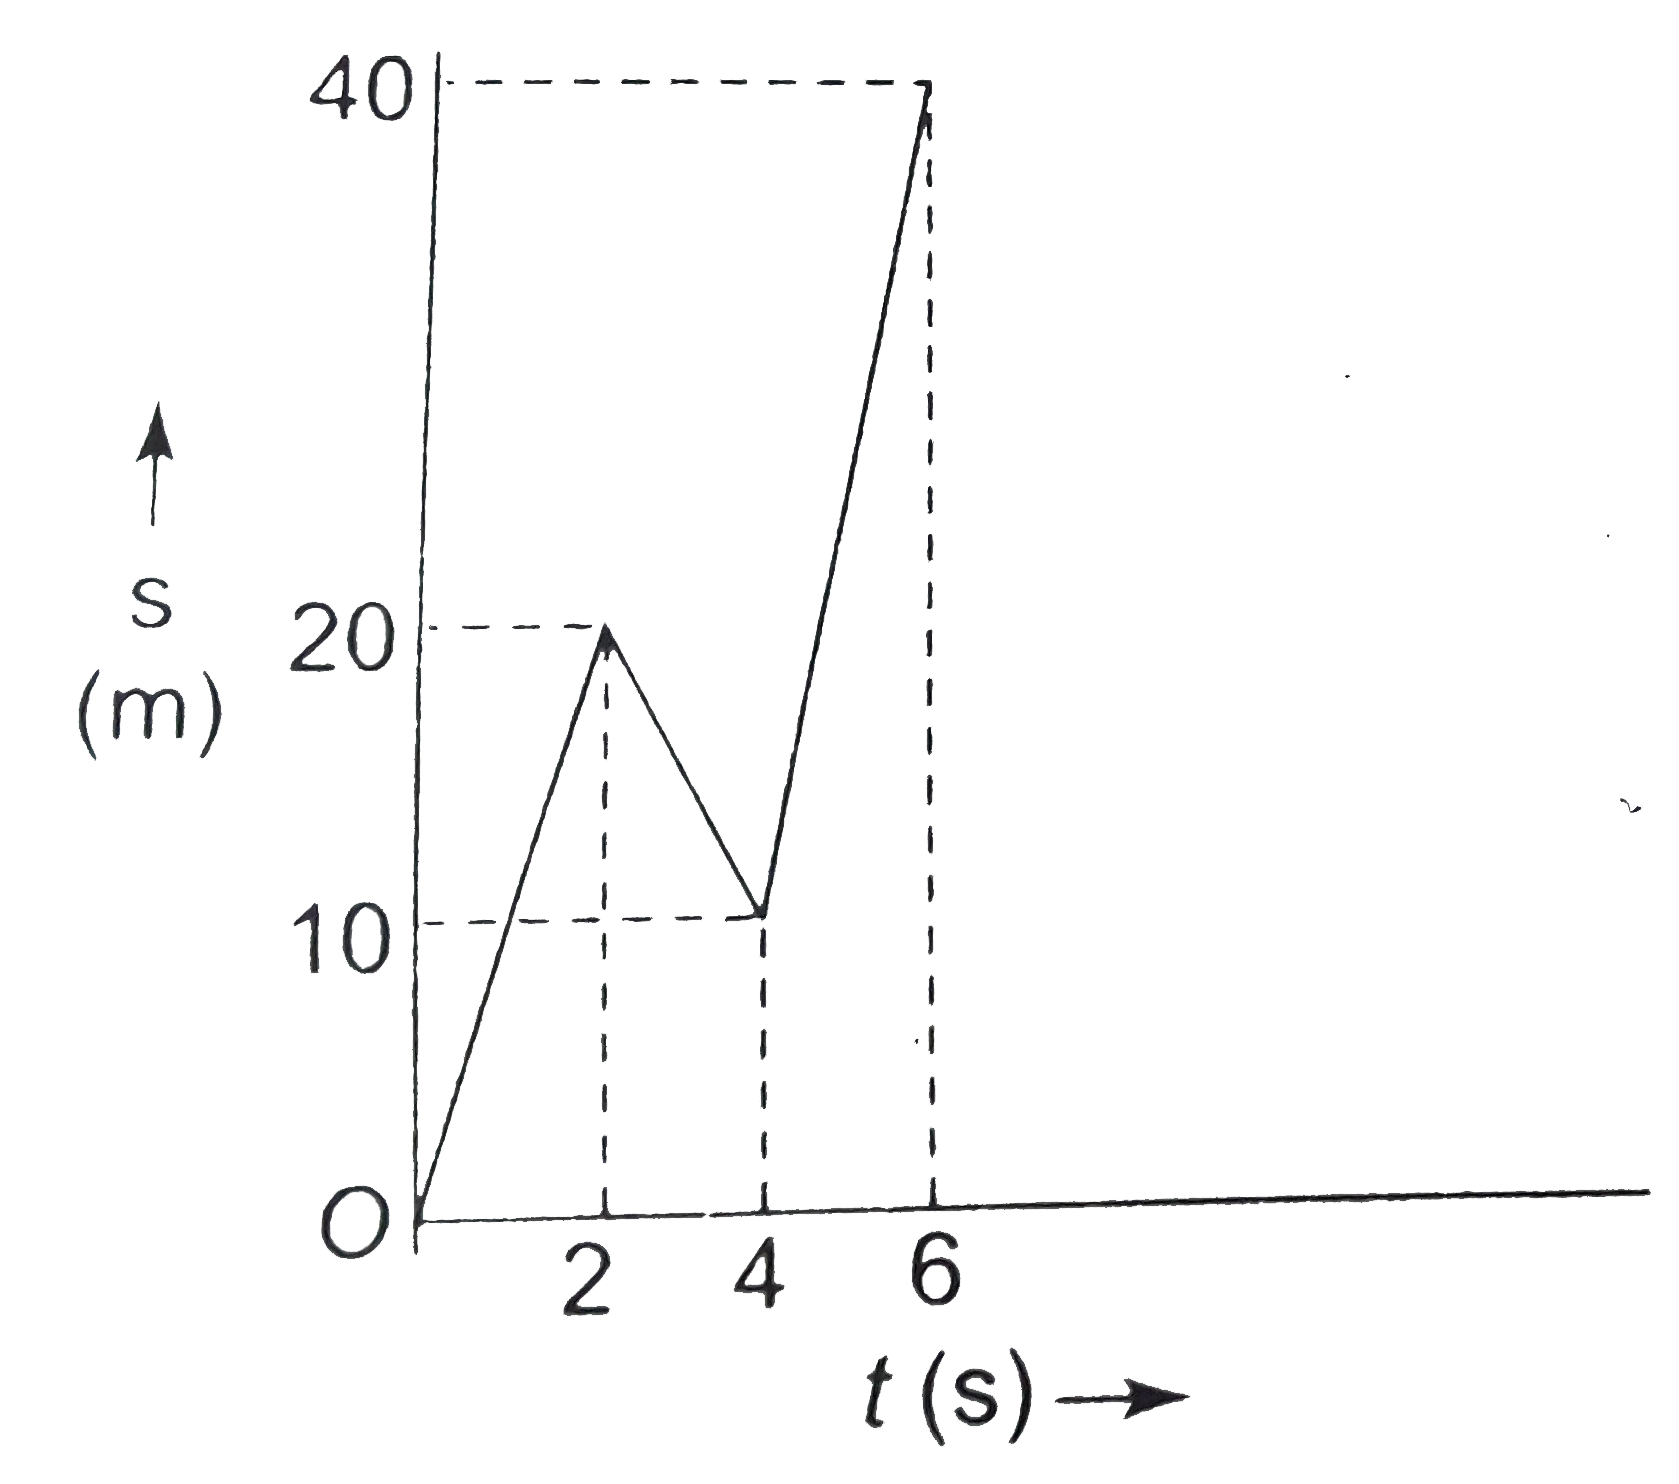
Area(1)=20,Area(2)=−10,Area(3)=30
t=0 to t=2s, Displacement=20m
t=0 to t=4s, Displacement=10m
t=0 to t=6s, Displacement=40m
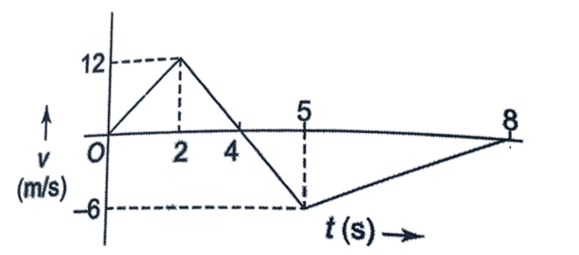
(c ) 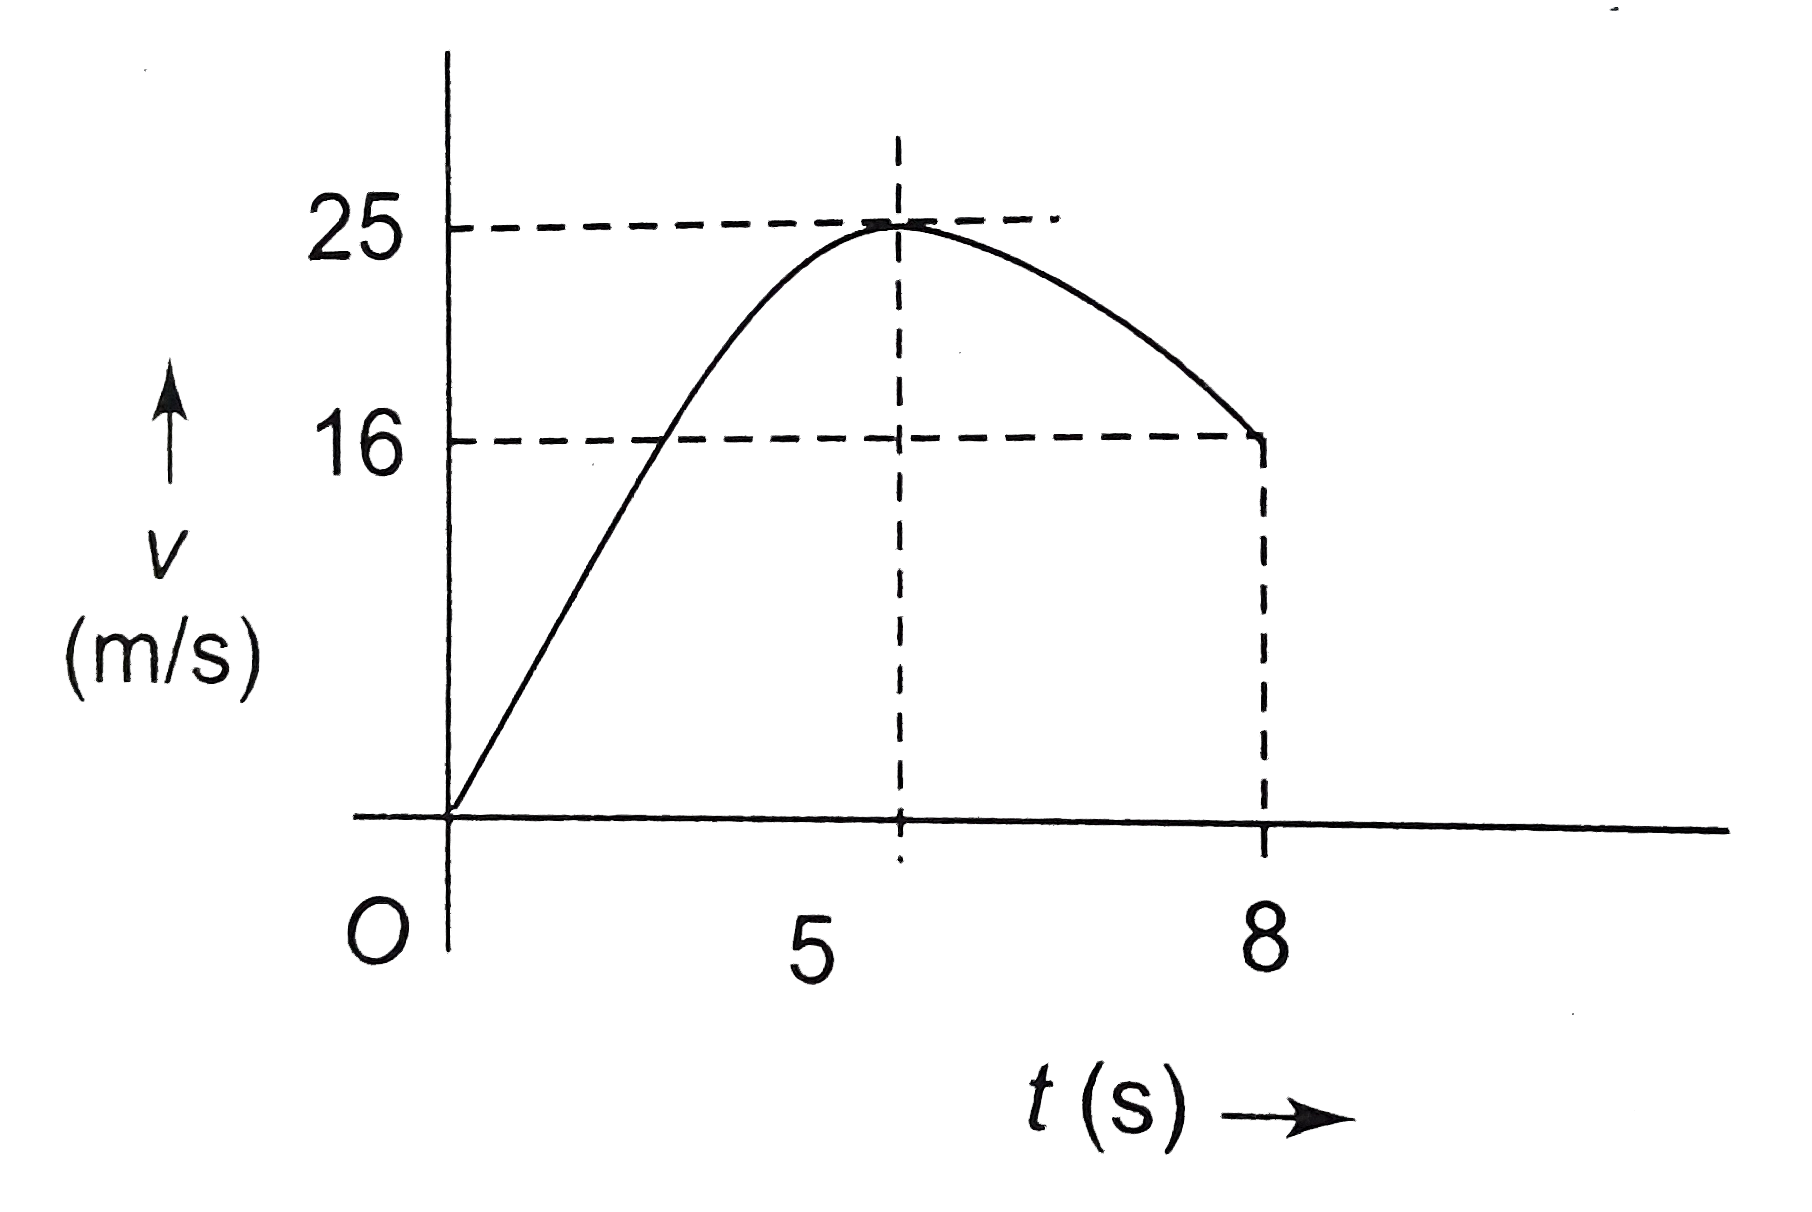
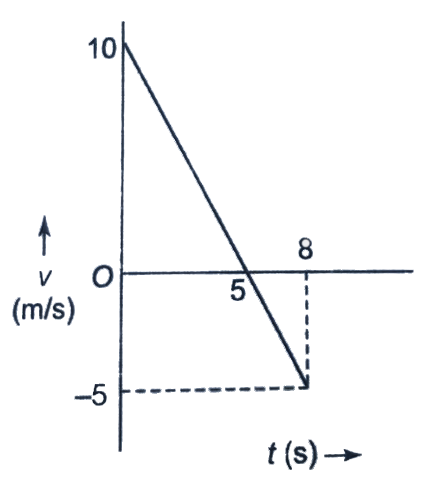
Area(1)=25,Area(2)=−9
t=0 to t=5s, Displacement =25m
t=0 to t=8s, Displacement =16 m
t=0 to 8s, Acceleration=Slope of v-t graph=-2 m/s2
From t=0 to t=5s,
(i) v gt 0, i.e. slope of the s-t slowing down, slope of the s-t graph is decreasing
From t=5 to t=8s,
(i) v lt 0, i.e. slope of the s-t graph is -ve
(ii) v lt 0, a lt 0, particle is speeding up, slope of the s-t graph is increasing
At t=5 s
v=0, slope of the s-t graph is 0, direction of motion changes

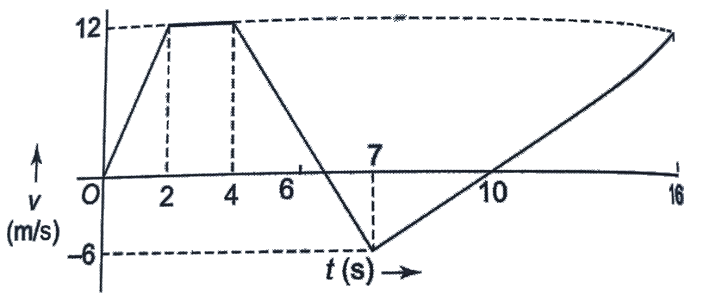
(d) 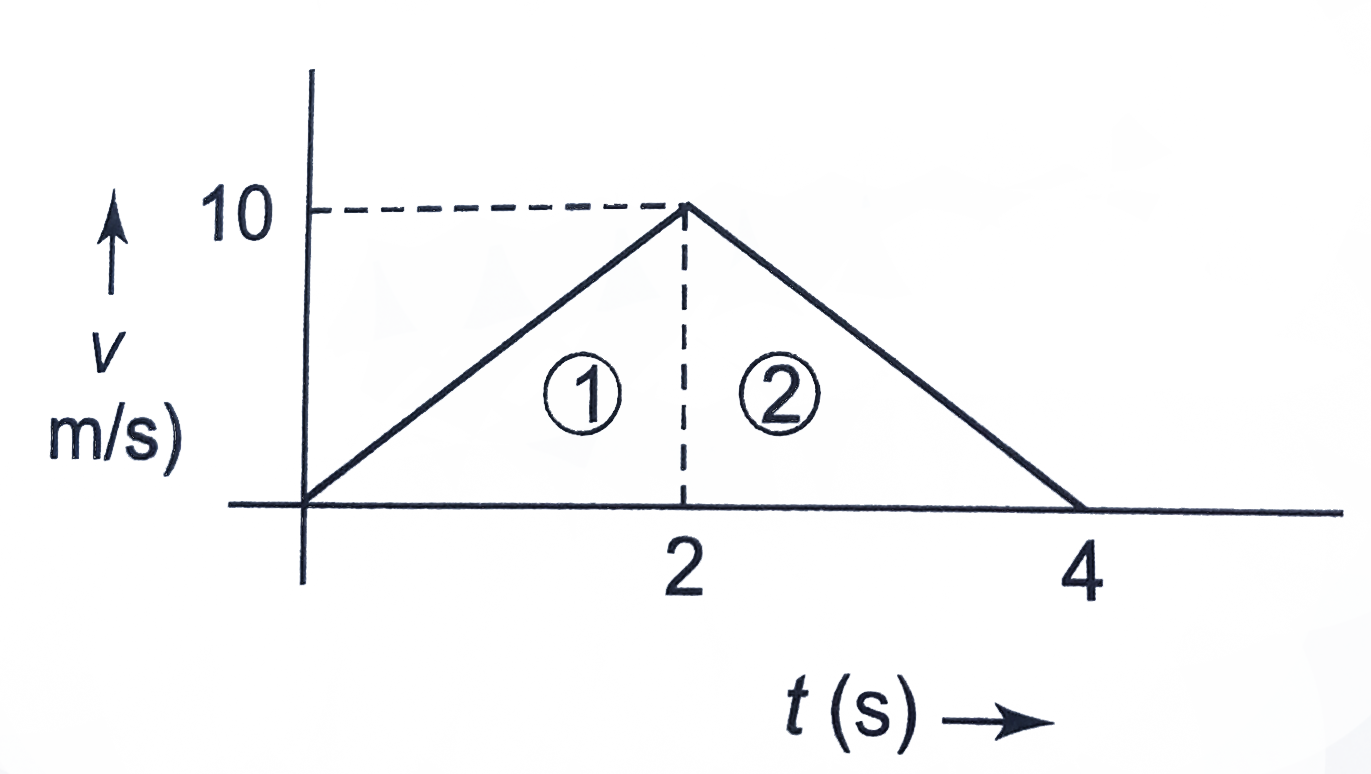
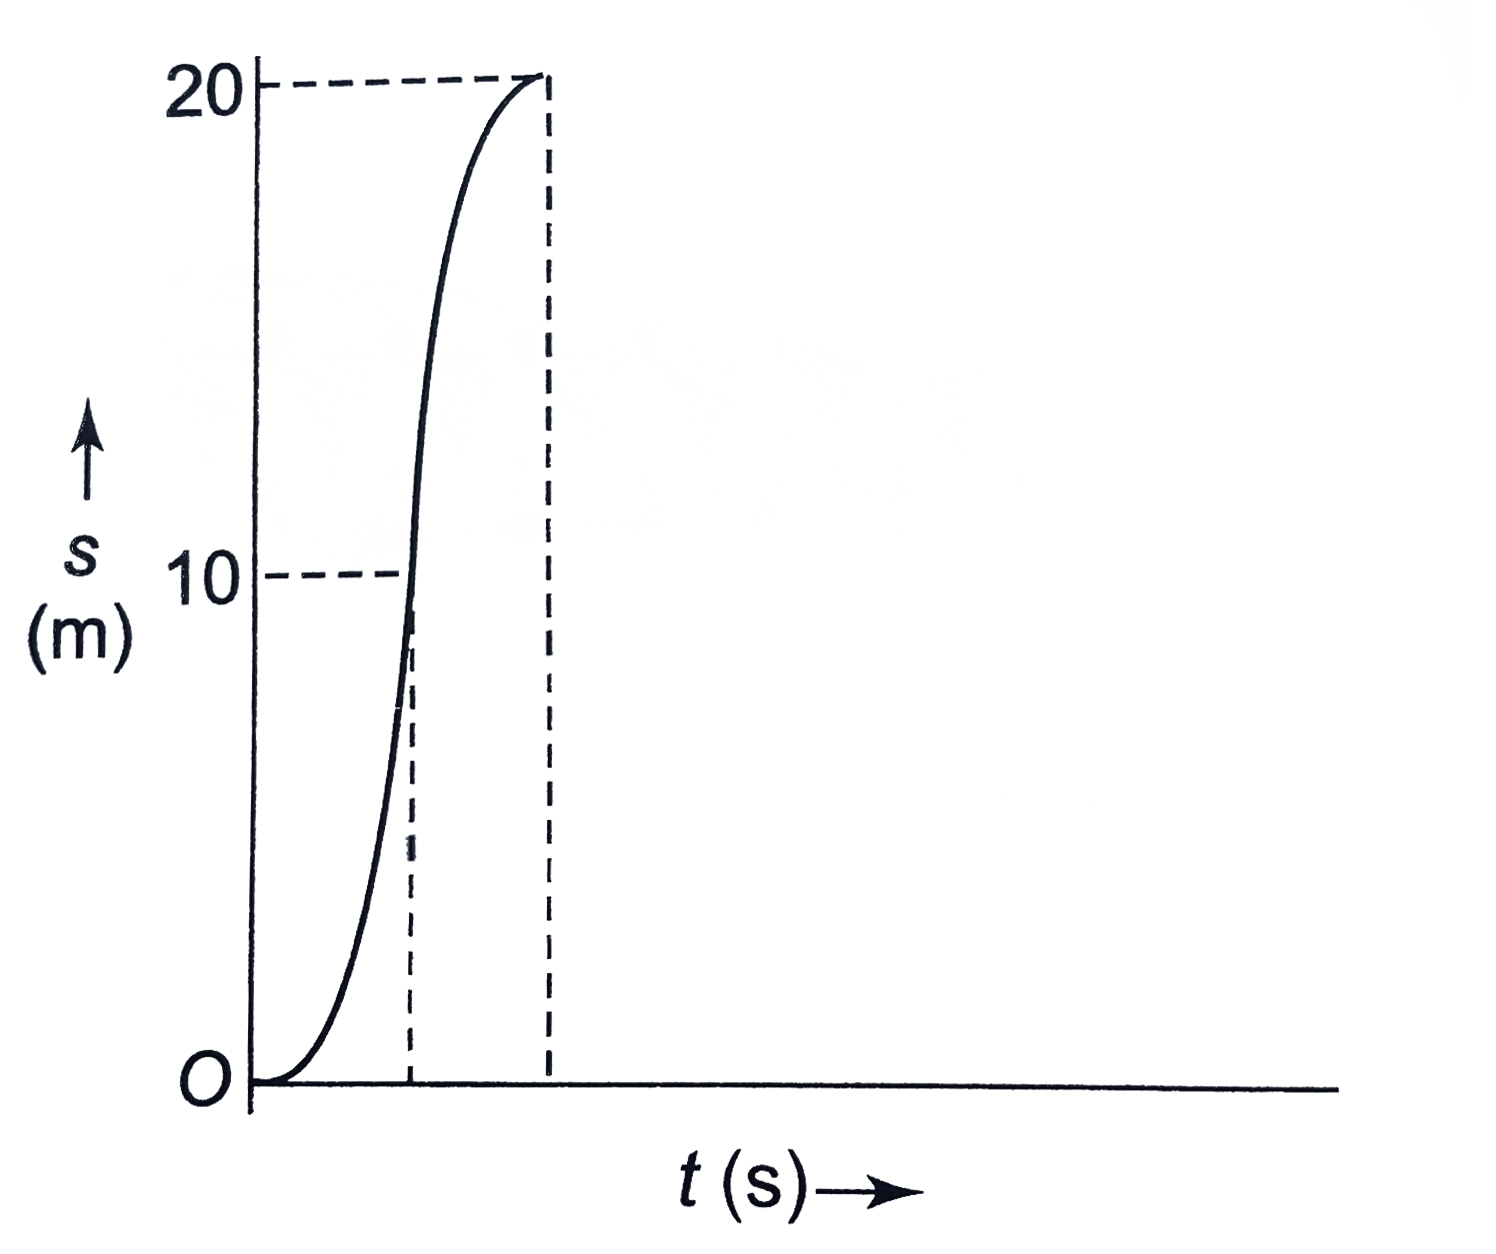
Area (1)=10, Area (2) =10
t=0 to t=2s, Displacement=10m
t=0 to t=4s, Displacement=20m
t=0 to t=2s, a=5m/s2
(i) v gt 0, slope of the s-t graph is +ve
(ii) v gt 0, a gt 0, particle is speeding up, slope of the s-t graph is increasing
t=2 to t=4s, a=−5m/s2
(i) v gt 0, slope of the s-t graph is +ve
v gt 0, a lt 0, particle is slowing down, slope of the s-t graph is decreasing
Related Playlists
Similar Questions
A particle is moving along the x-axis and its velocity-time graph ia as shown in the following diagrems. Sketch the displacement-time graph.
 View Solution
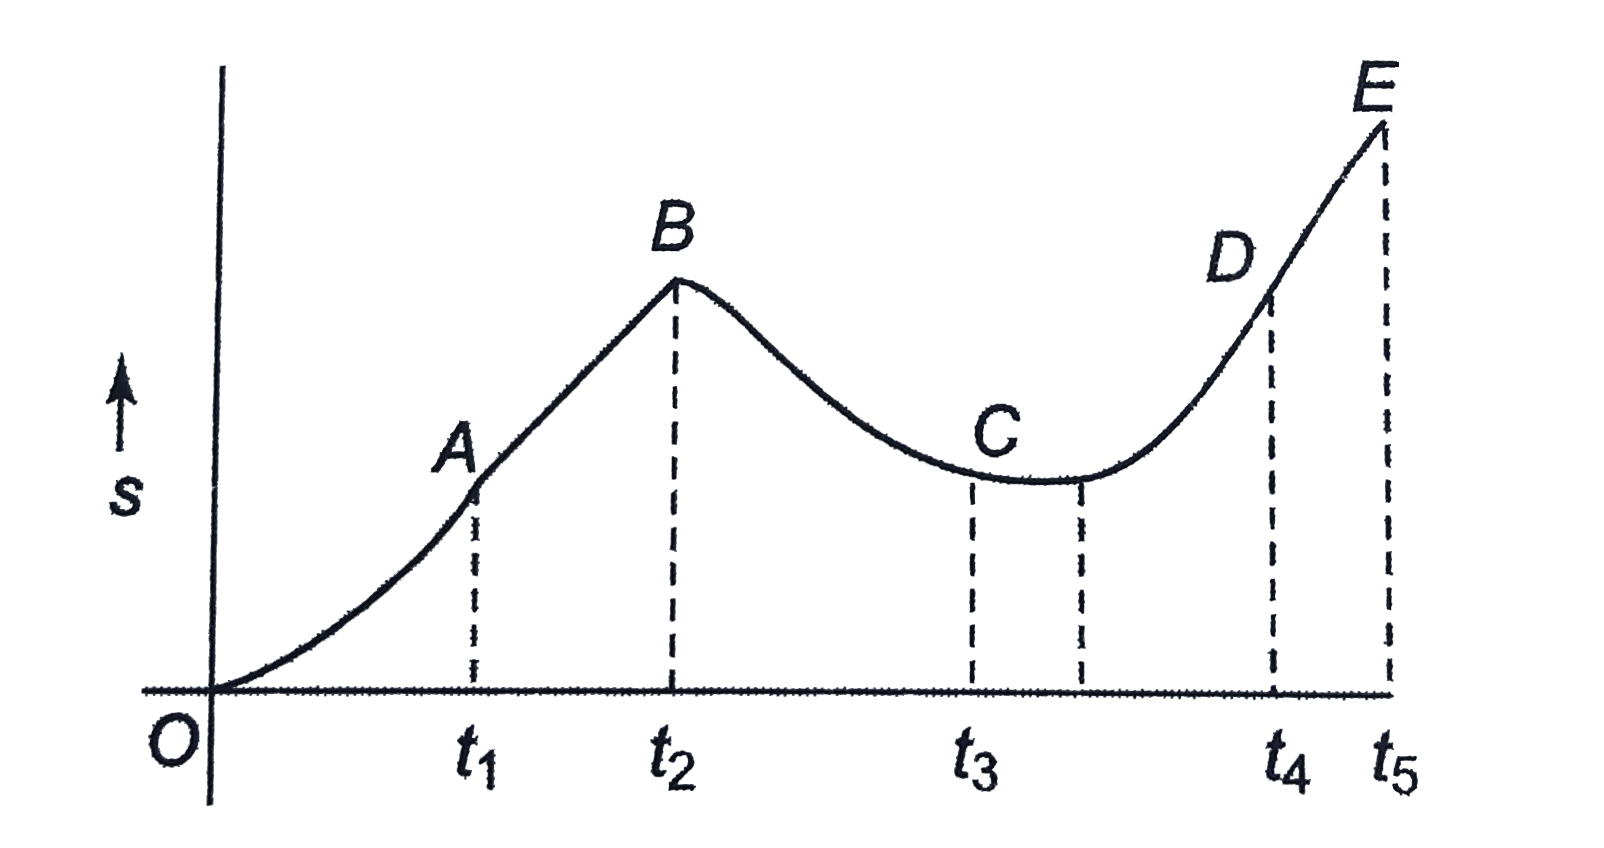
A particle is moving along the x-axis and its position-time graph is shown. Determine the sign of acceleration.
 View Solution
A particle is moving in a straight line along the xaxis. Its velocity-time graph is as shown. Sketch the displacement-time and distance-time grapgs.
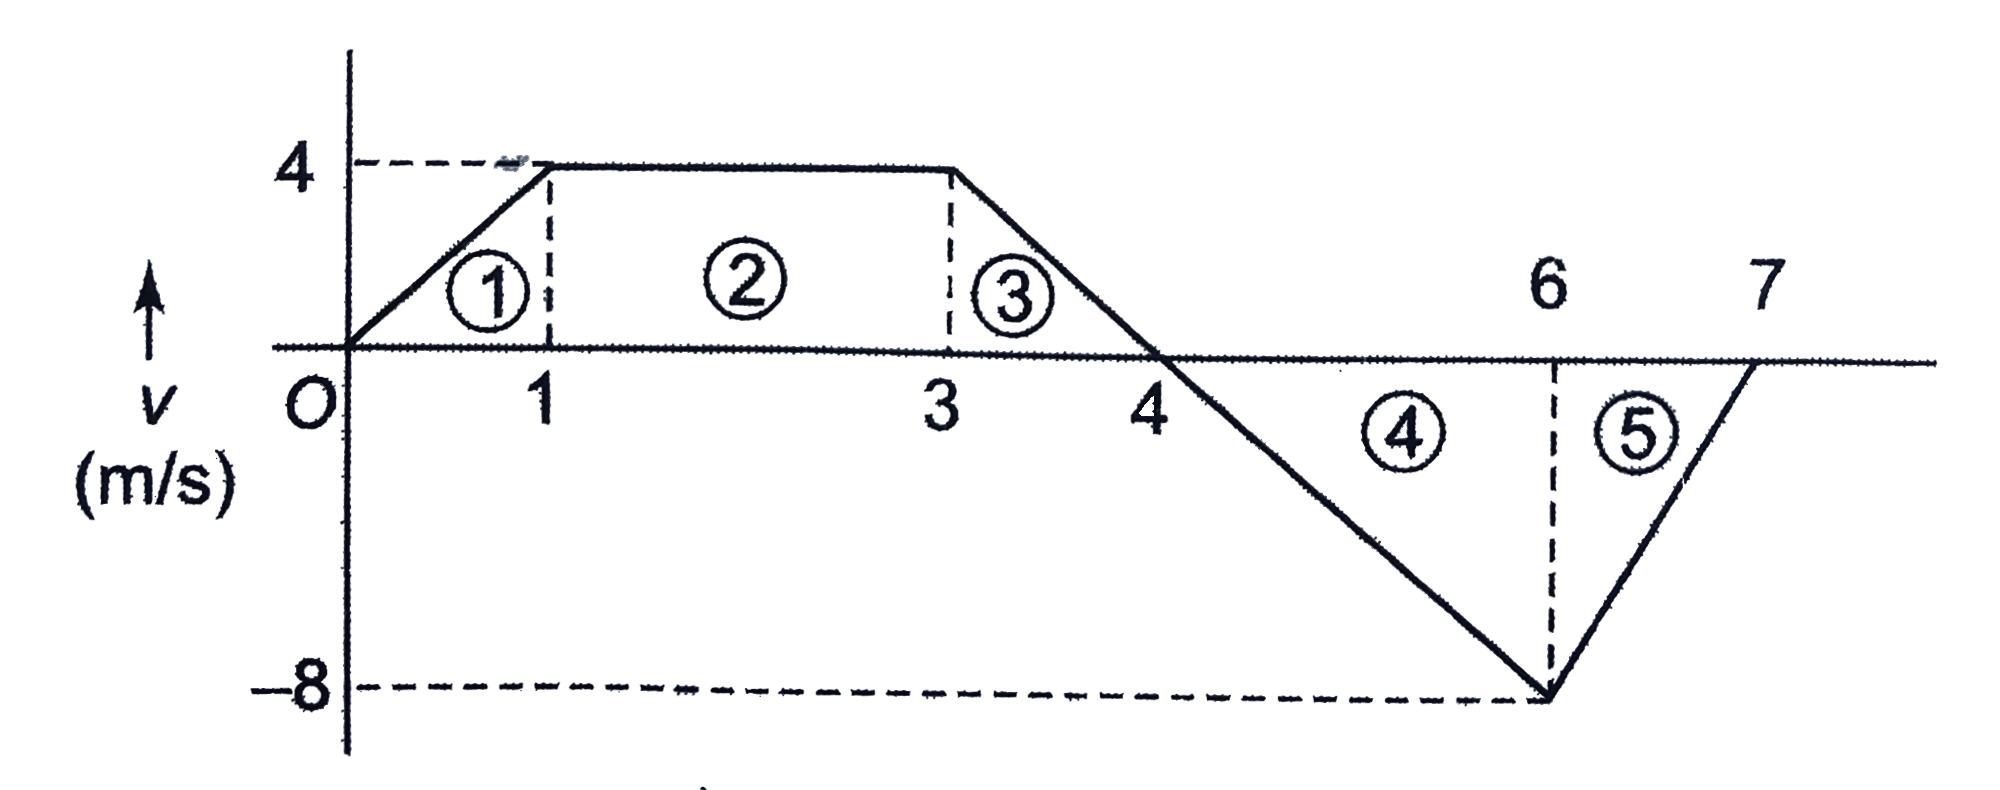 View Solution
For a particle moving along x-axis, velocity-time graph is as shown in figure. Find the displacement of the particle?
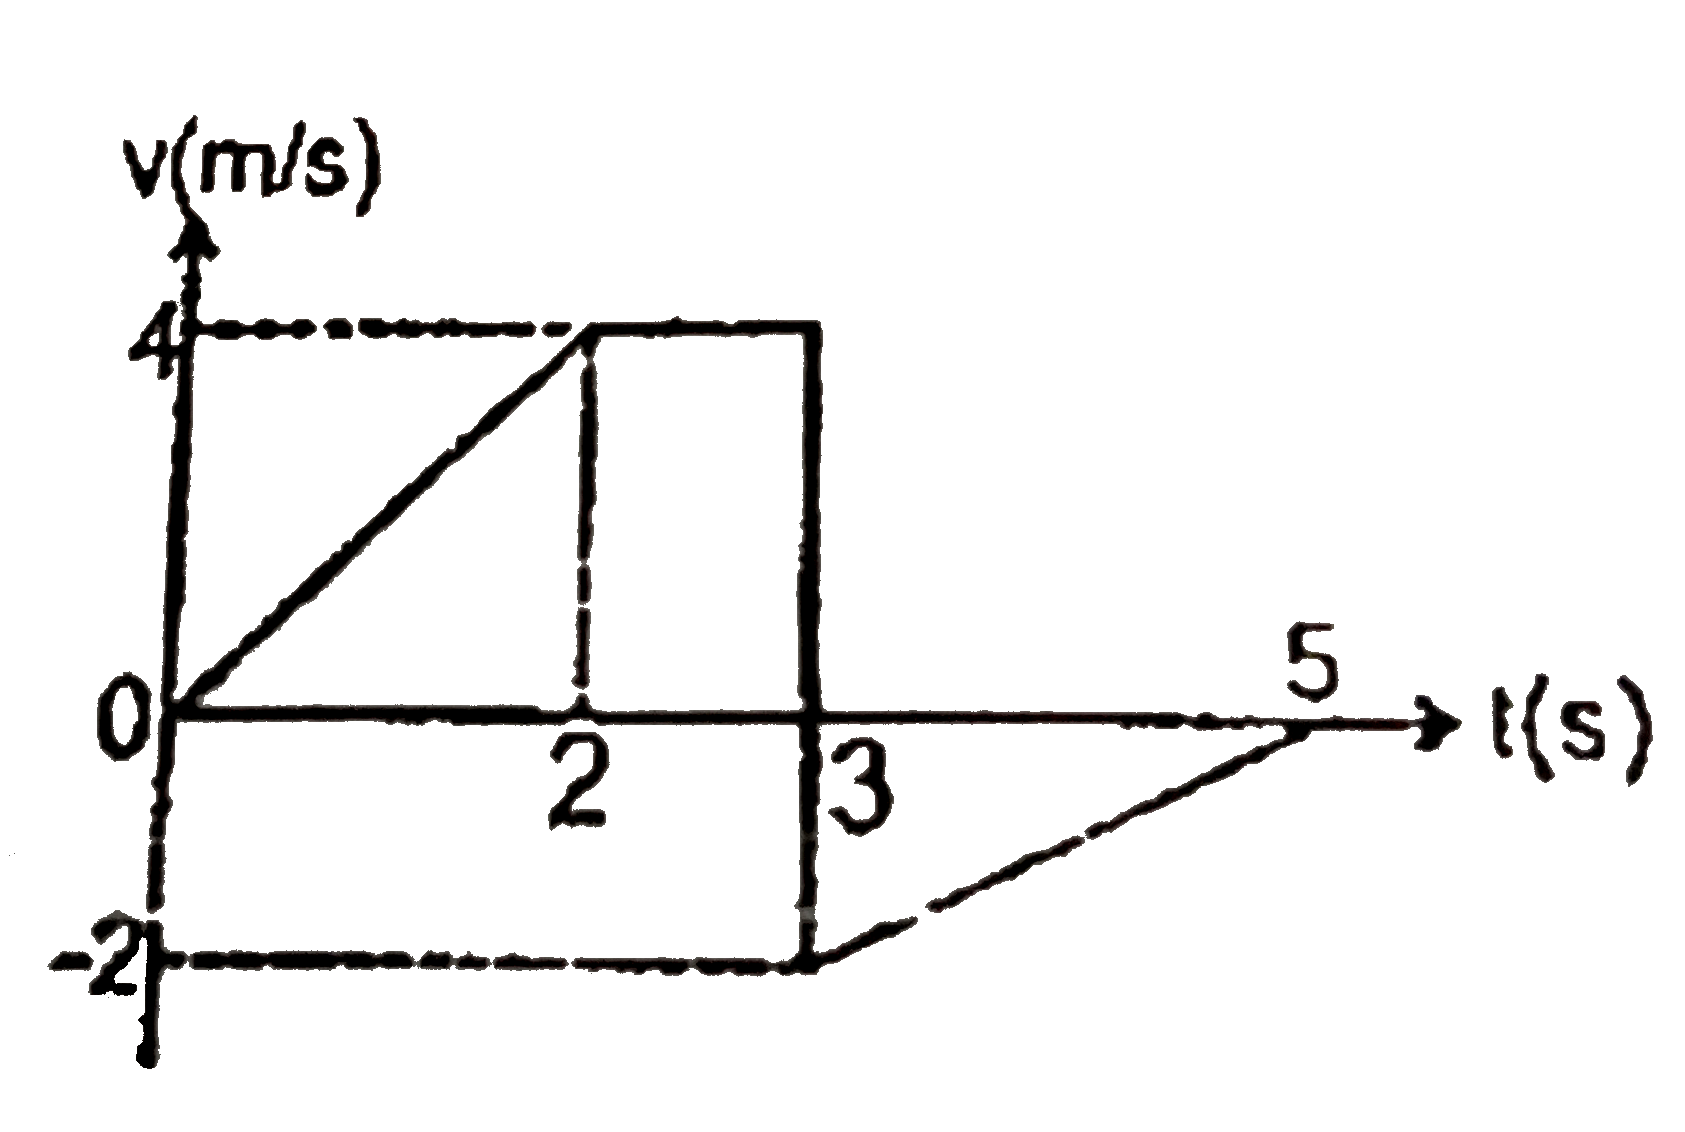 View Solution
The velocity-time graph of a body is shown in .
The displacement of the body in 8s is.
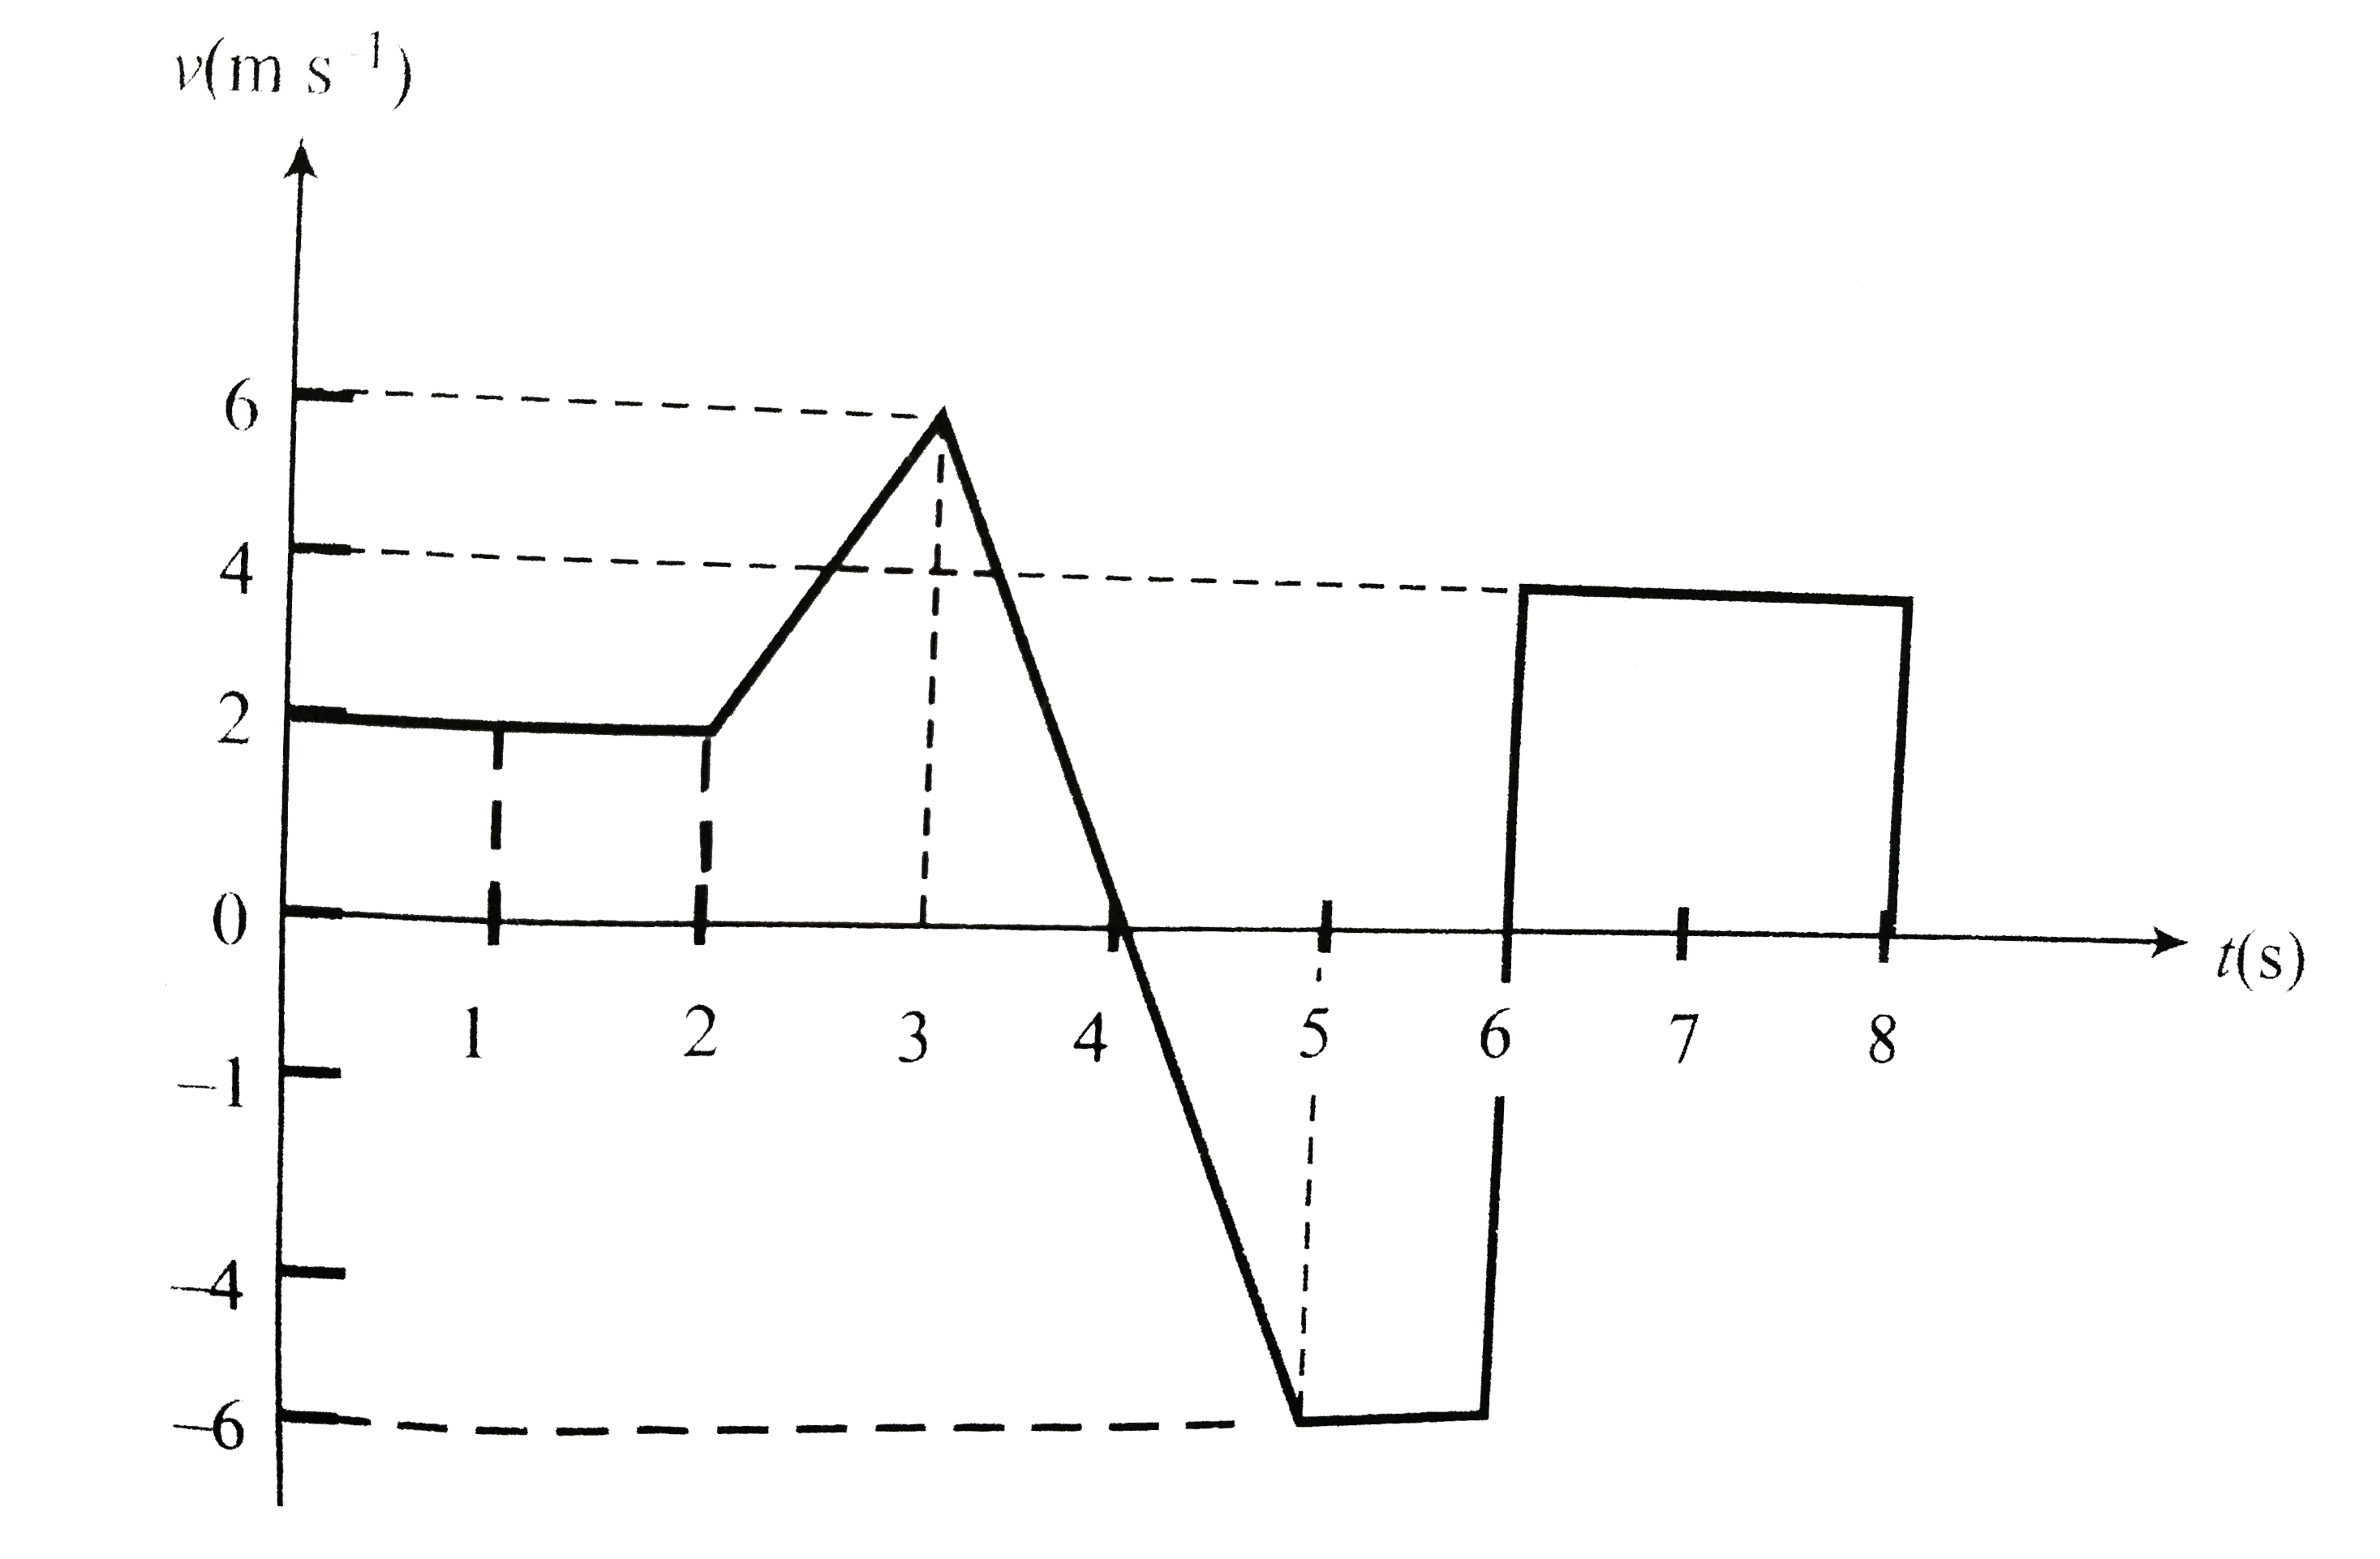 .View Solution
velocity time graph of a particle is shown in figure. Find displacement of the particle.
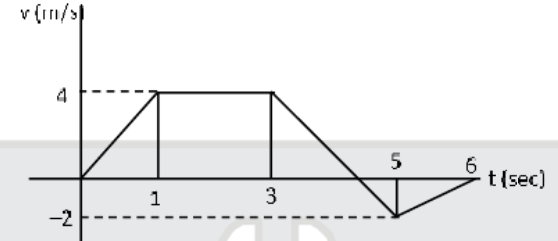 View Solution
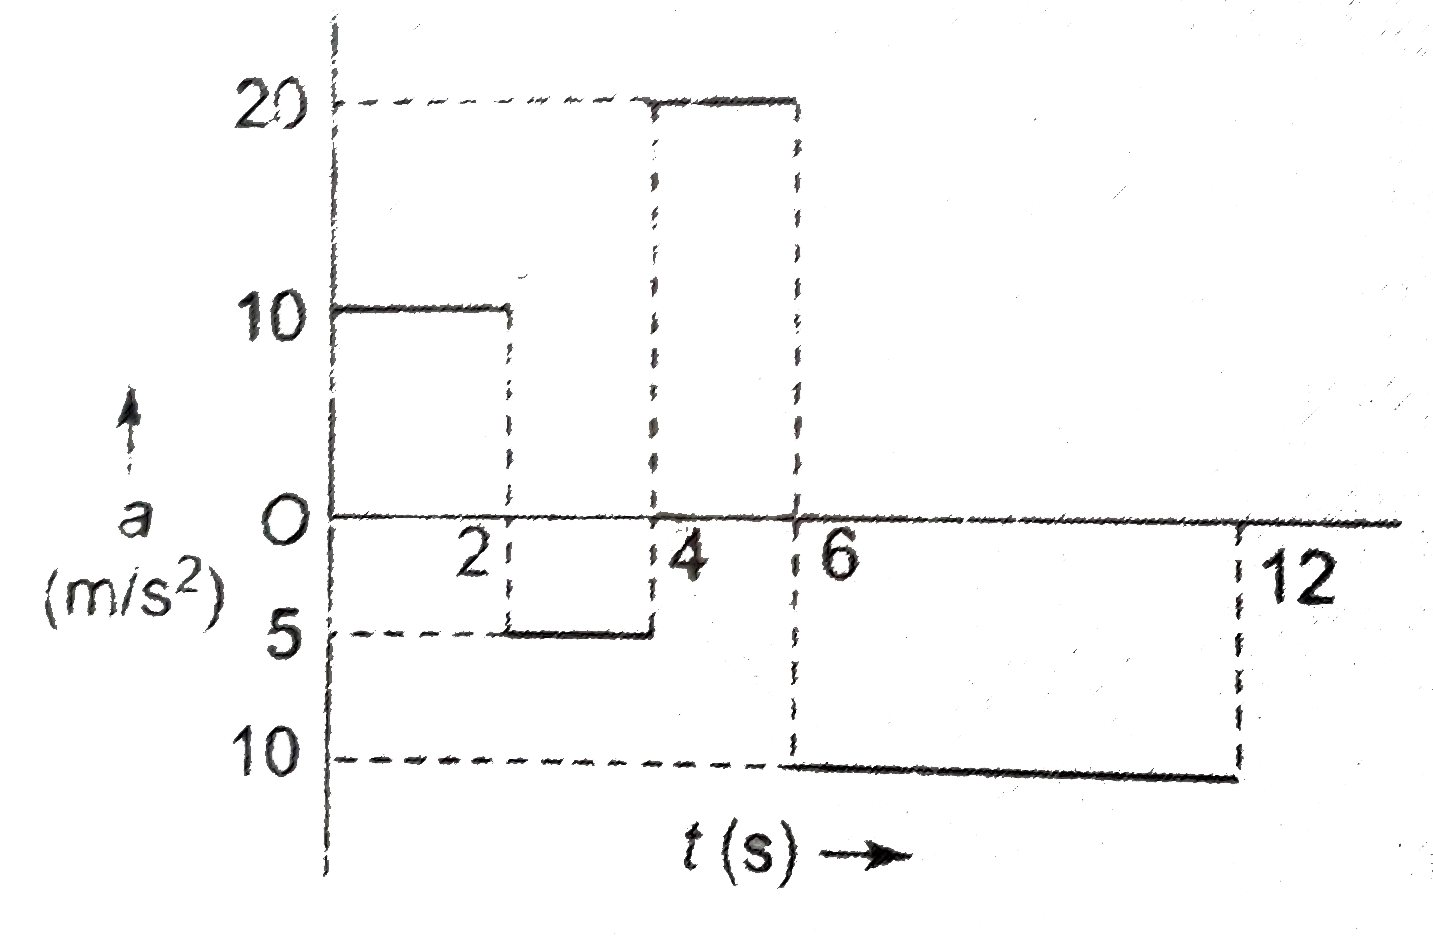
A particle is moving along the x-axis. Consider it’s a-t graph. If initial velocity is 10 m//s, sketch the v-t graph and calculate the displacement in the time interval t=0 to 12 s.
 View Solution
A particle is moving along x-axis. Its x-coordinate versus time graph is as shown below.
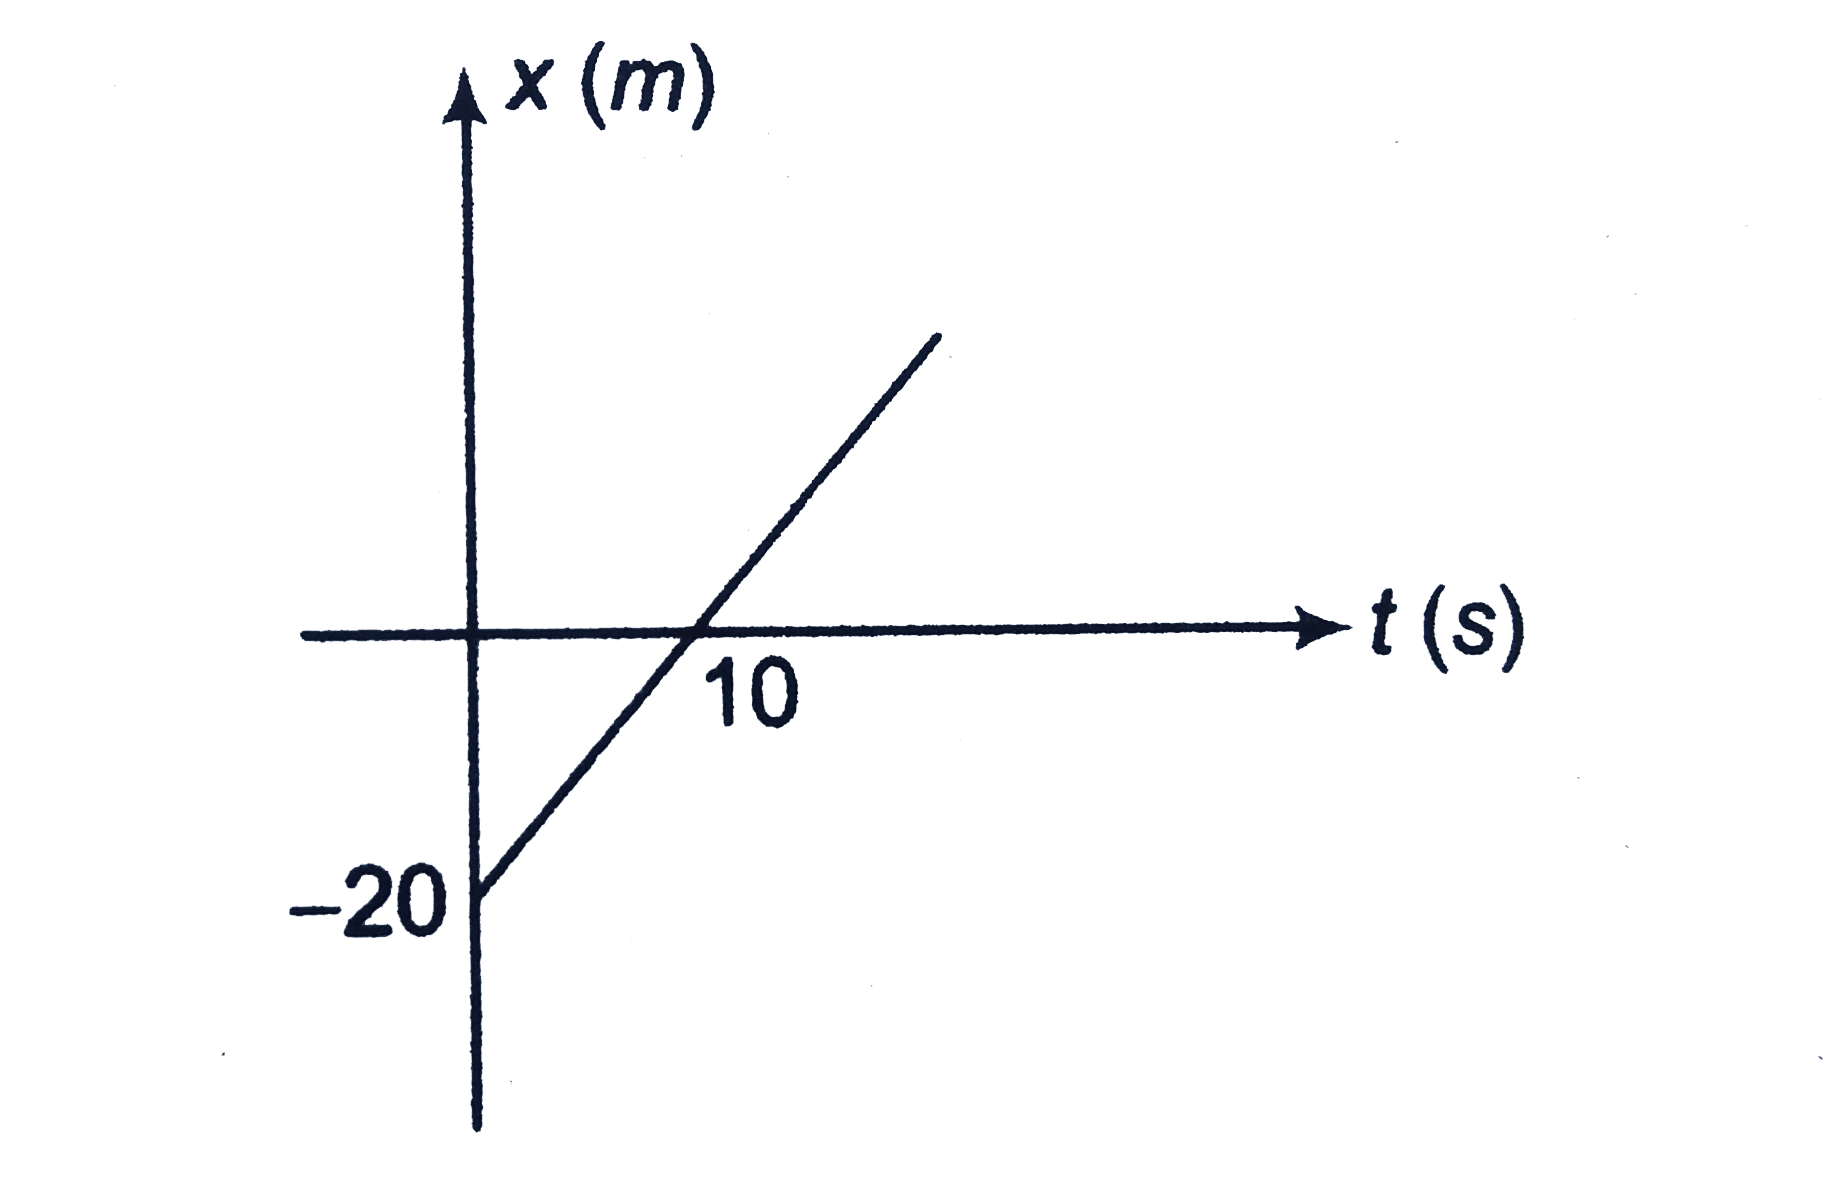 Draw some conclusion from the given graph. View Solution
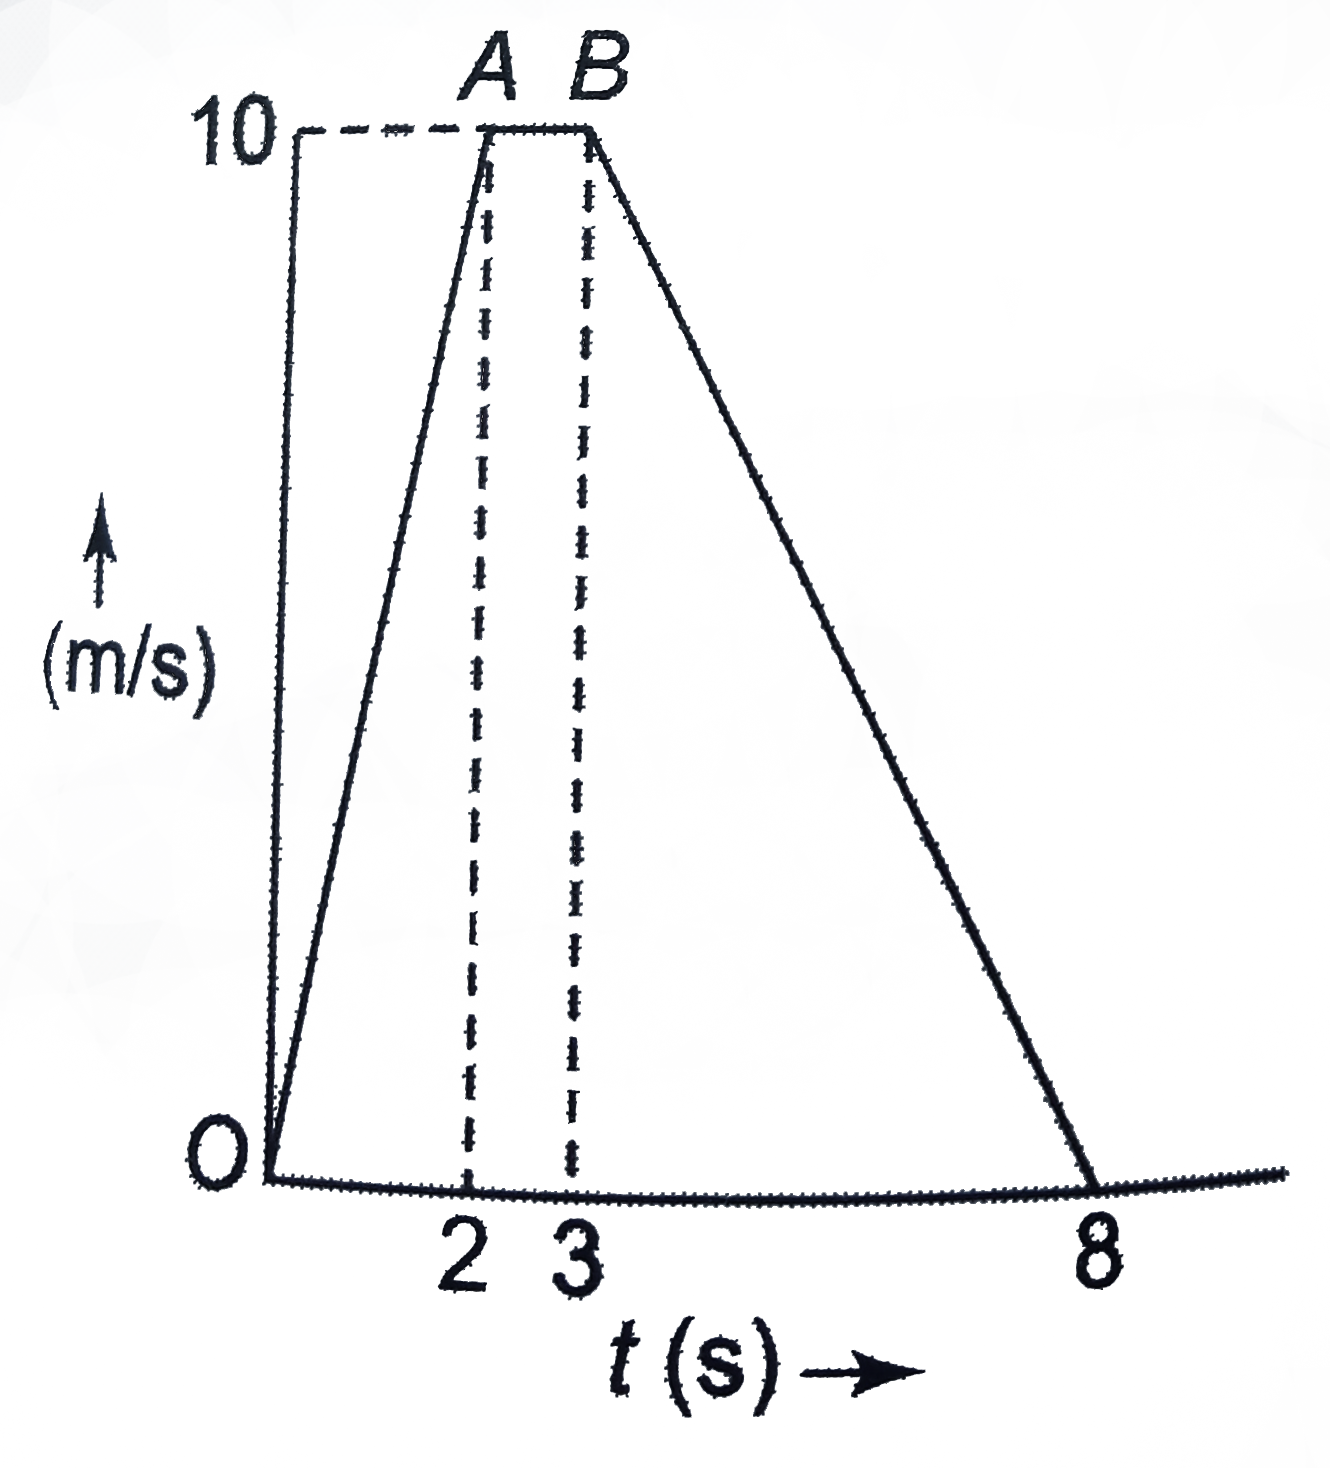
For a particle moving in a straight line, the velocity-time graph is as shown in the figure. Find the acceleration at time t=1s2.5s and 5s. Sketch the acceleration time graph.
 View Solution
A particle is moving along X-axis under a force such that its position -time graph is as shown in figure.
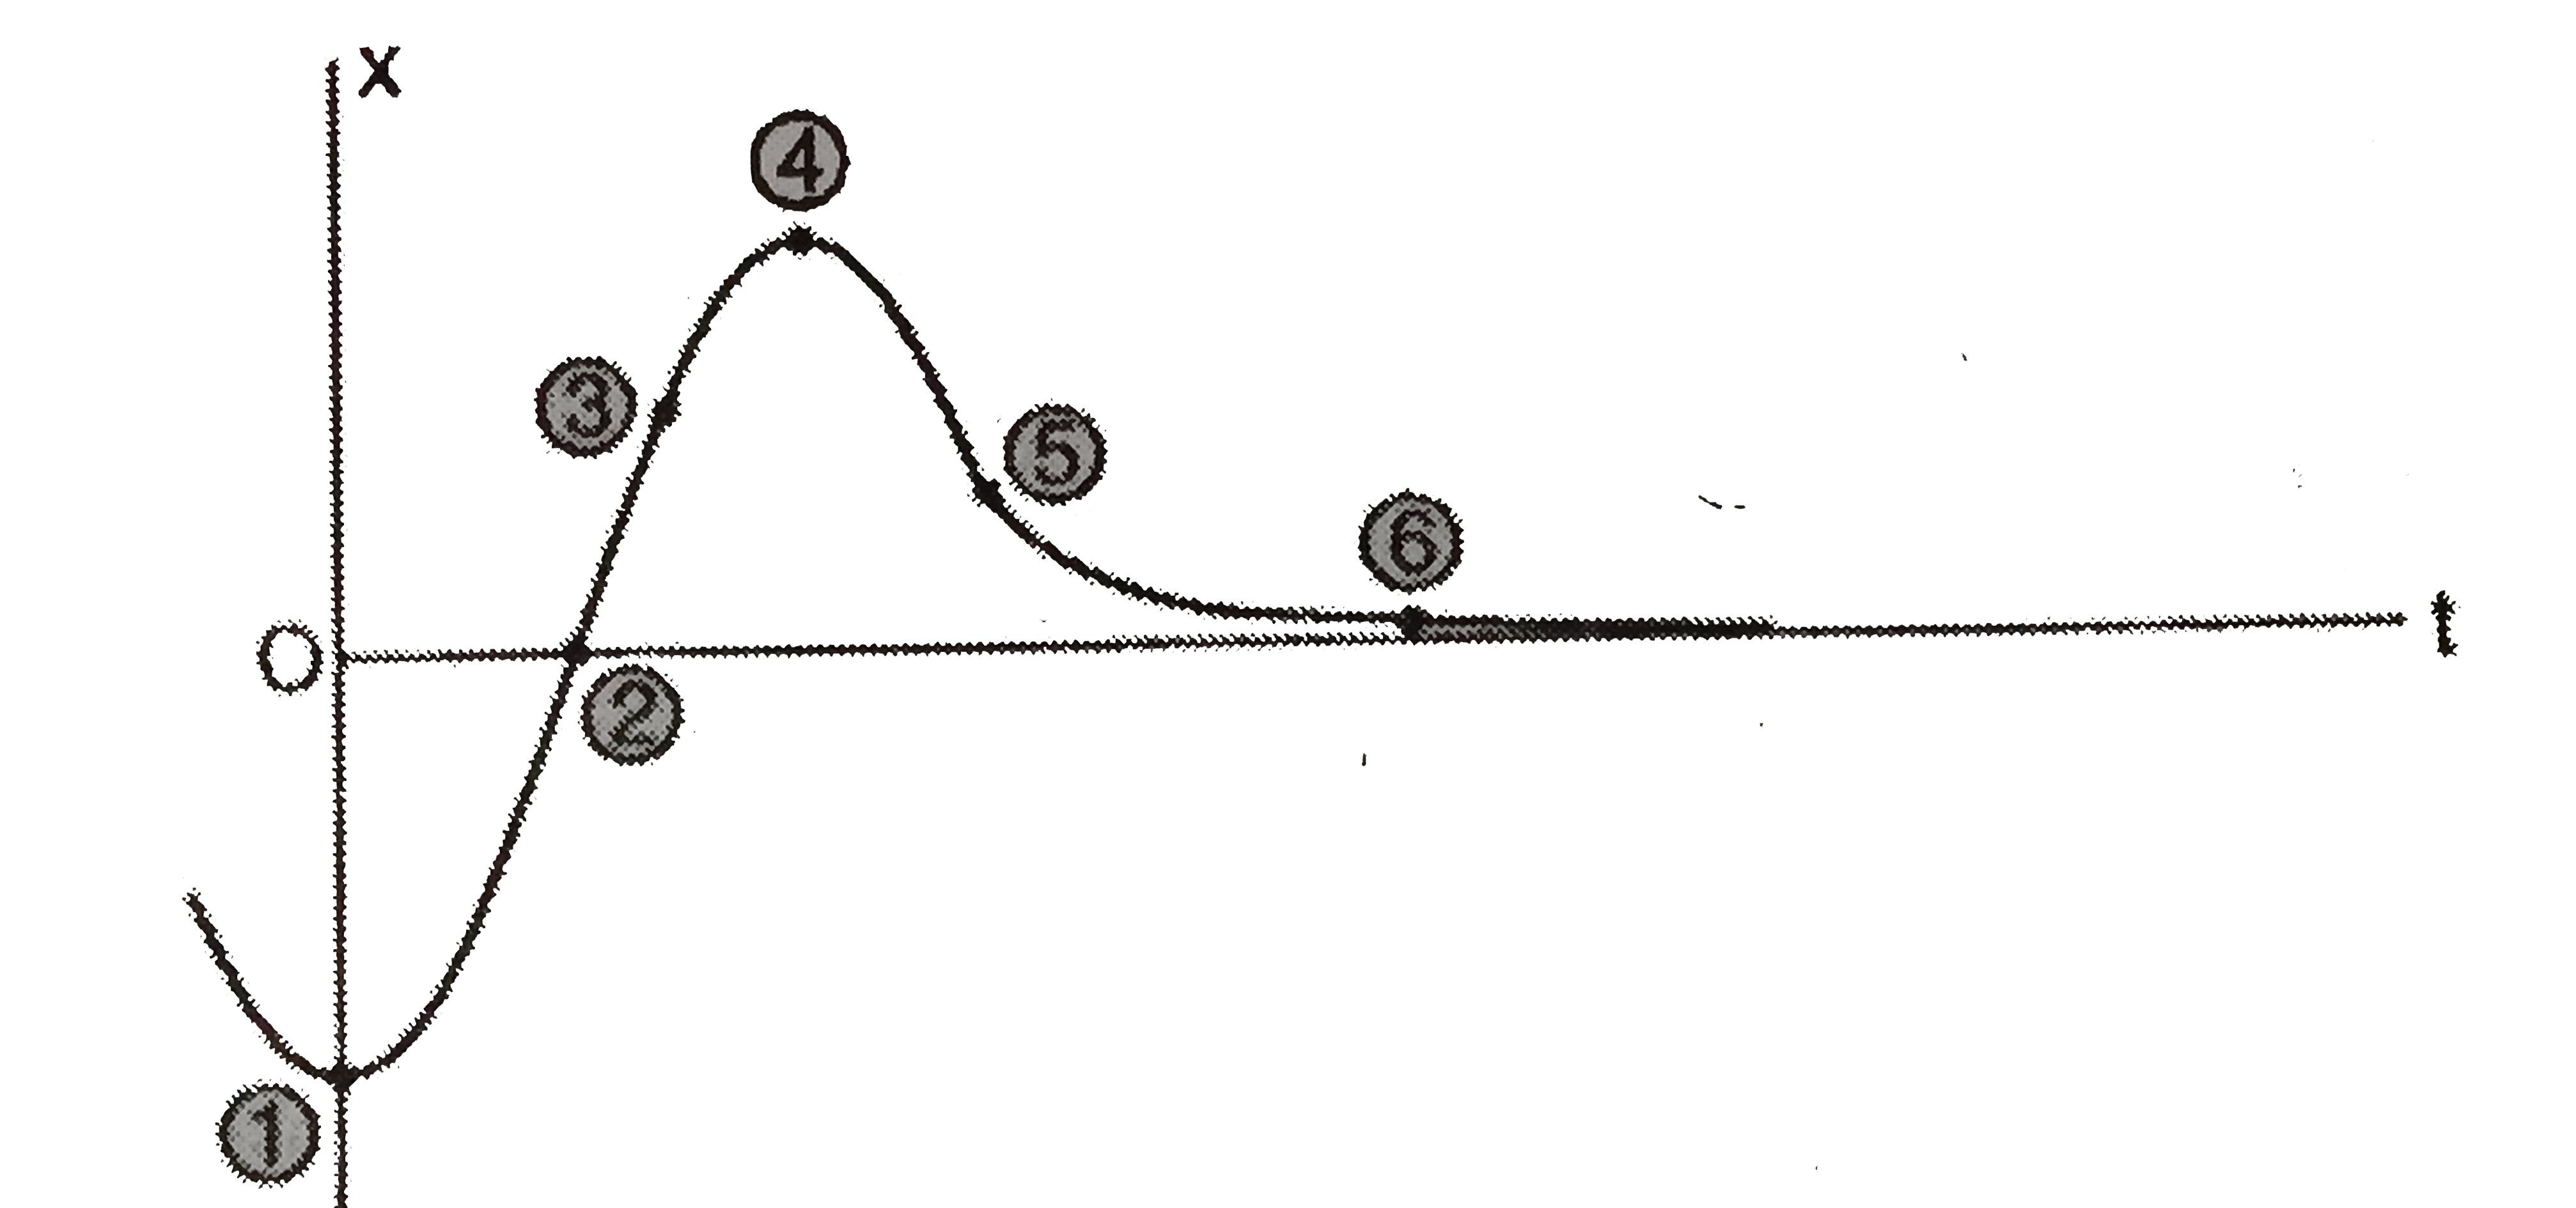
As the particle passes position (3) :View Solution

