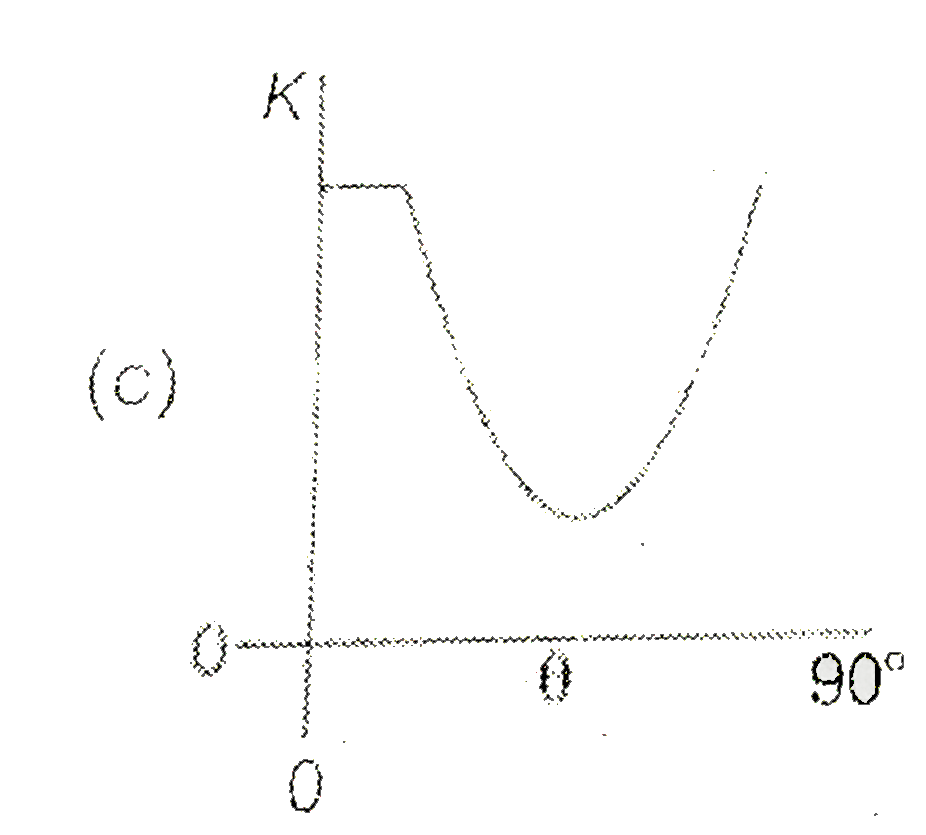
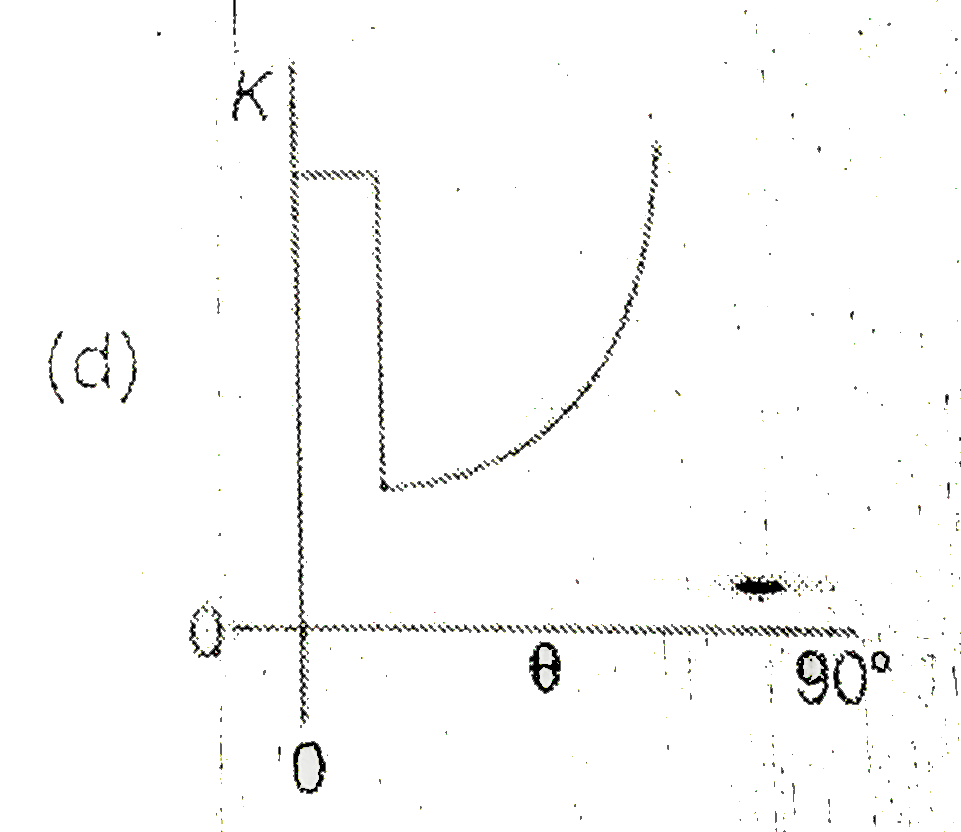
A solid ball is realeased from rest down inclines of various inclination angle θ but through a fixed vertical height h. The coefficient of static and kinetic friction are both equal to μ. Which of the following graph best represents the total kinetic energy K of the ball at the bottom of the incline as a function of the angle θ of the incline?


The correct Answer is:C
To solve the problem of how the total kinetic energy K of a solid ball at the bottom of an incline varies with the angle θ, we can follow these steps:
Step 1: Understand the Energy Conservation Principle
When the ball is released from a height h, it converts its potential energy into kinetic energy as it rolls down the incline. The potential energy at the top is given by:
PE=mgh
where m is the mass of the ball, g is the acceleration due to gravity, and h is the vertical height.
Step 2: Analyze the Forces Acting on the Ball
As the ball rolls down the incline, two forces act on it: gravitational force and frictional force. The gravitational force can be resolved into two components: one parallel to the incline (which causes the ball to accelerate) and one perpendicular to the incline (which affects the normal force).
Step 3: Determine the Acceleration of the Ball
The acceleration a of the ball down the incline can be expressed as:
a=gsin(θ)−μgcos(θ)
where μ is the coefficient of friction. This equation shows that the acceleration depends on the angle θ.
Step 4: Calculate the Kinetic Energy at the Bottom
The kinetic energy K at the bottom of the incline can be expressed using the work-energy principle. The work done by the gravitational force minus the work done against friction gives us the kinetic energy:
K=mgh−Work done against friction
The work done against friction can be calculated by considering the distance traveled along the incline and the frictional force.
Step 5: Analyze the Effect of Angle θ
- For small angles θ, sin(θ) is small, leading to a smaller acceleration and thus a lower kinetic energy.
- As θ increases, the component of gravitational force parallel to the incline increases, leading to higher acceleration and thus higher kinetic energy.
- However, at very steep angles, the frictional force becomes significant, which can reduce the effective kinetic energy.
Step 6: Graph the Kinetic Energy as a Function of θ
Based on the analysis, the kinetic energy will initially decrease with small angles, reach a minimum at some critical angle, and then increase again as the angle approaches 90 degrees (where the ball would be in free fall).
Conclusion
The graph that best represents the total kinetic energy K of the ball at the bottom of the incline as a function of the angle θ is one that shows a decrease at small angles, a minimum at a critical angle, and an increase as θ approaches 90 degrees. Therefore, the answer is Graph A.
---
When the ball is released from a height h, it converts its potential energy into kinetic energy as it rolls down the incline. The potential energy at the top is given by:
PE=mgh
where m is the mass of the ball, g is the acceleration due to gravity, and h is the vertical height.
As the ball rolls down the incline, two forces act on it: gravitational force and frictional force. The gravitational force can be resolved into two components: one parallel to the incline (which causes the ball to accelerate) and one perpendicular to the incline (which affects the normal force).
The acceleration a of the ball down the incline can be expressed as:
a=gsin(θ)−μgcos(θ)
where μ is the coefficient of friction. This equation shows that the acceleration depends on the angle θ.
The kinetic energy K at the bottom of the incline can be expressed using the work-energy principle. The work done by the gravitational force minus the work done against friction gives us the kinetic energy:
K=mgh−Work done against friction
The work done against friction can be calculated by considering the distance traveled along the incline and the frictional force.
- For small angles θ, sin(θ) is small, leading to a smaller acceleration and thus a lower kinetic energy.
- As θ increases, the component of gravitational force parallel to the incline increases, leading to higher acceleration and thus higher kinetic energy.
- However, at very steep angles, the frictional force becomes significant, which can reduce the effective kinetic energy.
Based on the analysis, the kinetic energy will initially decrease with small angles, reach a minimum at some critical angle, and then increase again as the angle approaches 90 degrees (where the ball would be in free fall).
The graph that best represents the total kinetic energy K of the ball at the bottom of the incline as a function of the angle θ is one that shows a decrease at small angles, a minimum at a critical angle, and an increase as θ approaches 90 degrees. Therefore, the answer is Graph A.
Topper's Solved these Questions
- ROTATIONAL MOTIONBOOK - DC PANDEY ENGLISHCHAPTER - ROTATIONAL MOTIONEXERCISE - More than one option is correct
36 Videos
- ROTATIONAL MOTIONBOOK - DC PANDEY ENGLISHCHAPTER - ROTATIONAL MOTIONEXERCISE - Comprehension Type Questions
40 Videos
- ROTATIONAL MOTIONBOOK - DC PANDEY ENGLISHCHAPTER - ROTATIONAL MOTIONEXERCISE - Integer Type Questions
17 Videos
- ROTATIONAL MECHANICSBOOK - DC PANDEY ENGLISHCHAPTER - ROTATIONAL MECHANICSEXERCISE - Subjective Questions
2 Videos
- SEMICONDUCTORS AND ELECTRONIC DEVICESBOOK - DC PANDEY ENGLISHCHAPTER - SEMICONDUCTORS AND ELECTRONIC DEVICESEXERCISE - More than One Option is Correct
3 Videos
Similar Questions
A solid spherical ball is released from rest on an incline of inclination angle θ (which can be varied ) but through a fixed vertical height h. The coefficient of static and kinetic friction are both equal to μ. If E represents the total kinetic energy of the ball at the bottom of the incline as a function of the angle of inclination θ. W represents the work done by friction for the whole time of motion as a function of the angle of inclination θ. Choose of correct graph (s)
View SolutionA block has been placed on an inclined plane with the slope angle θ. Block slide down the plane at constant speed. The cofficient of Kinetic friction is equal to
View SolutionA block slides down an inclined plane that makes an angle θ with the horizontal. If the coefficient of kinetic friction is μ, find the acceleration of the block.
View SolutionA ball collides with an inclined plane of inclination θ after falling through a distance h. if it moves horizontal just after the impact, the coefficient of restitution is
View SolutionA uniform disc of mass m and radius R is rolling up a rough inclined plane which makes an angle of 30∘ with the horizontal. If the coefficients of static and kinetic friction are each equal to μ and the only force acting are gravitational and frictional, then the magnitude of the frictional force acting on the disc is and its direction is .(write up or down) the inclined plane.
View SolutionA uniform disc is released from the top of a rough inclined plane of angle θ and height h. The coefficient of friction between the disc and the plane is μ=tanθ4. The speed of centre of mass of disc on reaching the bottom of the plane is
View SolutionA block of mass m moves with constant speed down the inclined plane of inclination θ. Find the coefficient of kinetic friction.

View SolutionA block has been placed on an inclined plane . The slope angle of θ of the plane is such that the block slides down the plane at a constant speed . The coefficient of kinetic friction is equal to :
View SolutionA block has been placed on an inclined plane . The slope angle of θ of the plane is such that the block slides down the plane at a constant speed . The coefficient of kinetic friction is equal to :
View SolutionA particle is released from the top of an incline of height h. Does the kinetic energy of the particle at the bottom of the incline depend on the angle of incline? Do you ned any more information to anwer this question in Yes or No?
View Solution
