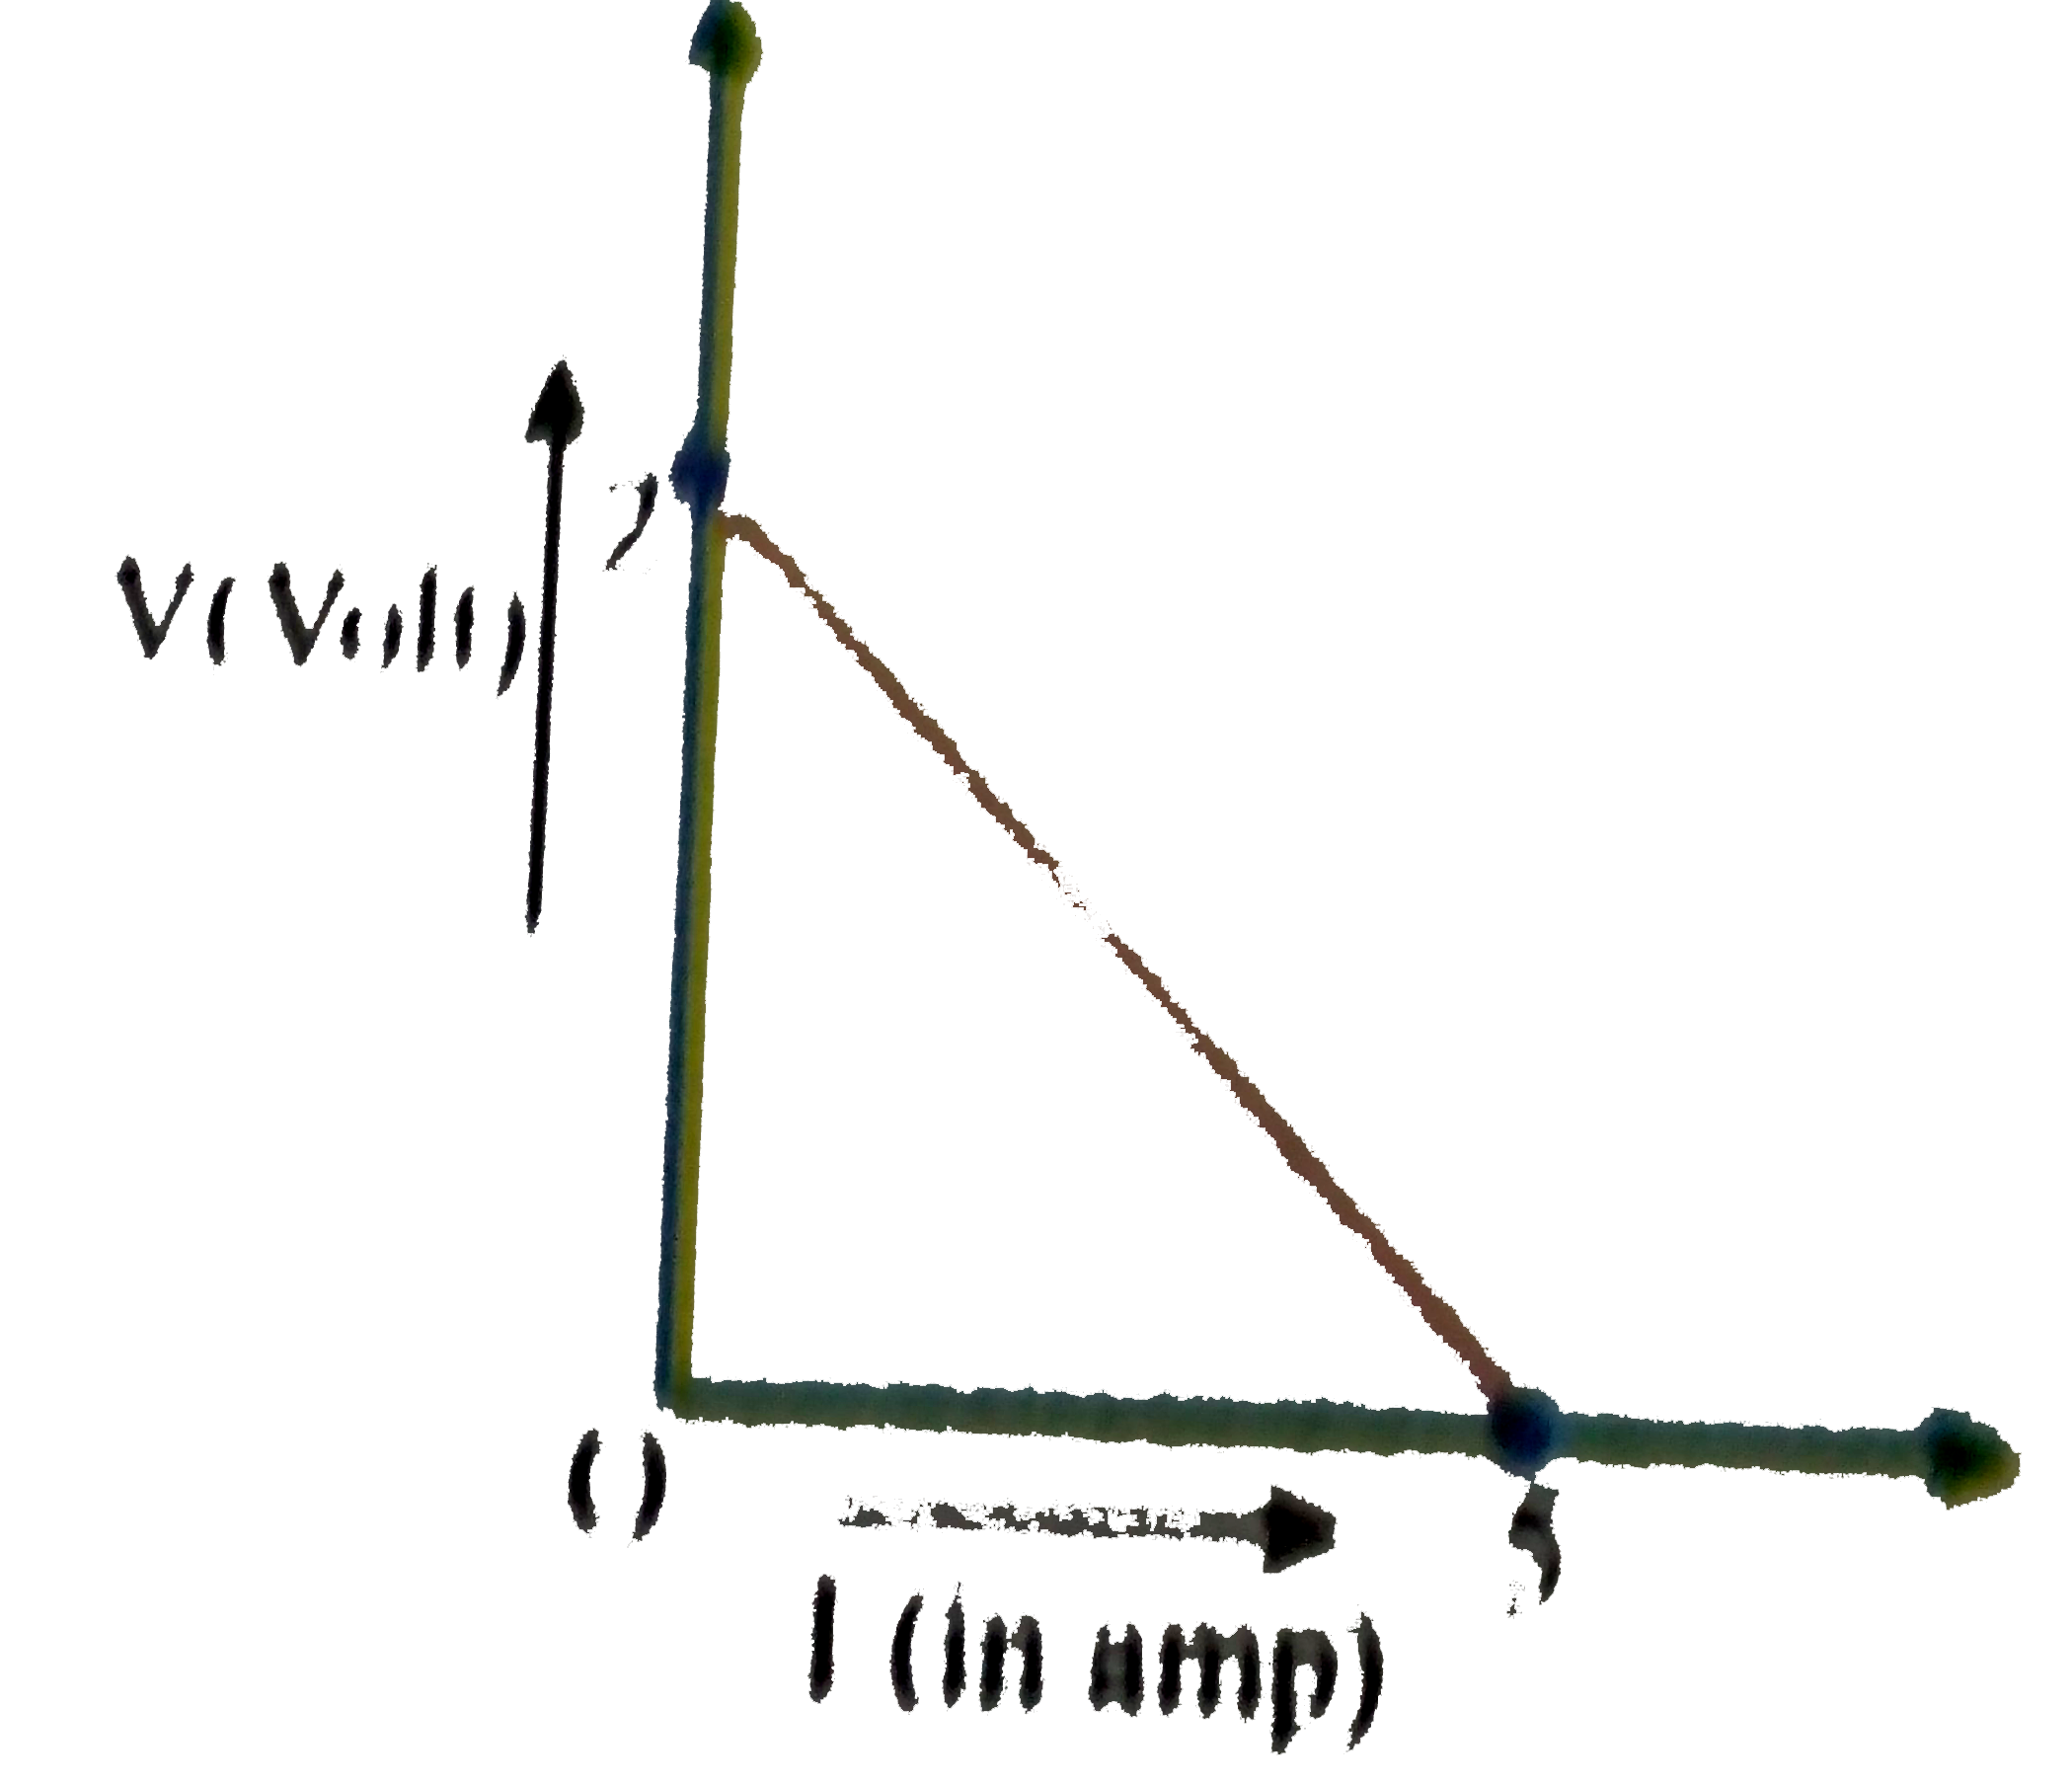
A straight line plot showing the terminal potential difference (V) of a cell as a function of current (I) drawn from it, is shown in the figure. The nternal resistance of the cell would be then-
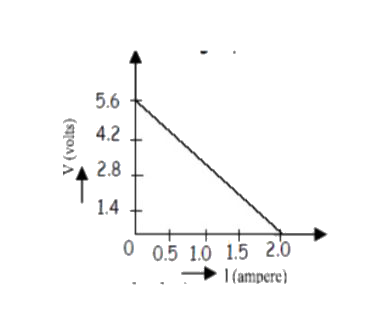
2.8 ohms
1.4 ohms
1.2 ohms
zero
Step by step video & image solution for A straight line plot showing the terminal potential difference (V) of a cell as a function of current (I) drawn from it, is shown in the figure. The nternal resistance of the cell would be then- by Physics experts to help you in doubts & scoring excellent marks in Class 12 exams.
Updated on:21/07/2023Topper's Solved these Questions
- SAMPLE PAPER 2022BOOK - CBSE MODEL PAPERCHAPTER - SAMPLE PAPER 2022EXERCISE - SECTION C
6 Videos
- SAMPLE PAPER 2022BOOK - CBSE MODEL PAPERCHAPTER - SAMPLE PAPER 2022EXERCISE - SECTION C
6 Videos
- Additional Practice QuestionsBOOK - CBSE MODEL PAPERCHAPTER - Additional Practice QuestionsEXERCISE - Question
1 Videos
- SAMPLE PAPER 2022 TERM IIBOOK - CBSE MODEL PAPERCHAPTER - SAMPLE PAPER 2022 TERM IIEXERCISE - SECTION B
16 Videos
Similar Questions
Knowledge Check
A straight line plot showing the terminal potential difference (V) of a cell as a function of current (1) drawn from it, is shown in the figure. The internal resistance of the cell would be then:
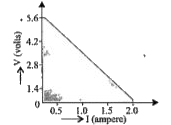 A2.8 ohmsB1.4 ohmsC1.2 ohmsDZero
The terminal potential difference for a cell is 8.5 V when current is 2A and 9 V when current is 1.5A. What is the internal resistance of cell ?
A4ΩB2ΩC3ΩD1ΩFor a cell, the graph between the potential difference (V) across the terminals of the cells and the current I drawn from the cell is as shown in figure. Calculate the e.m.f. and the internal resistance of the cell.
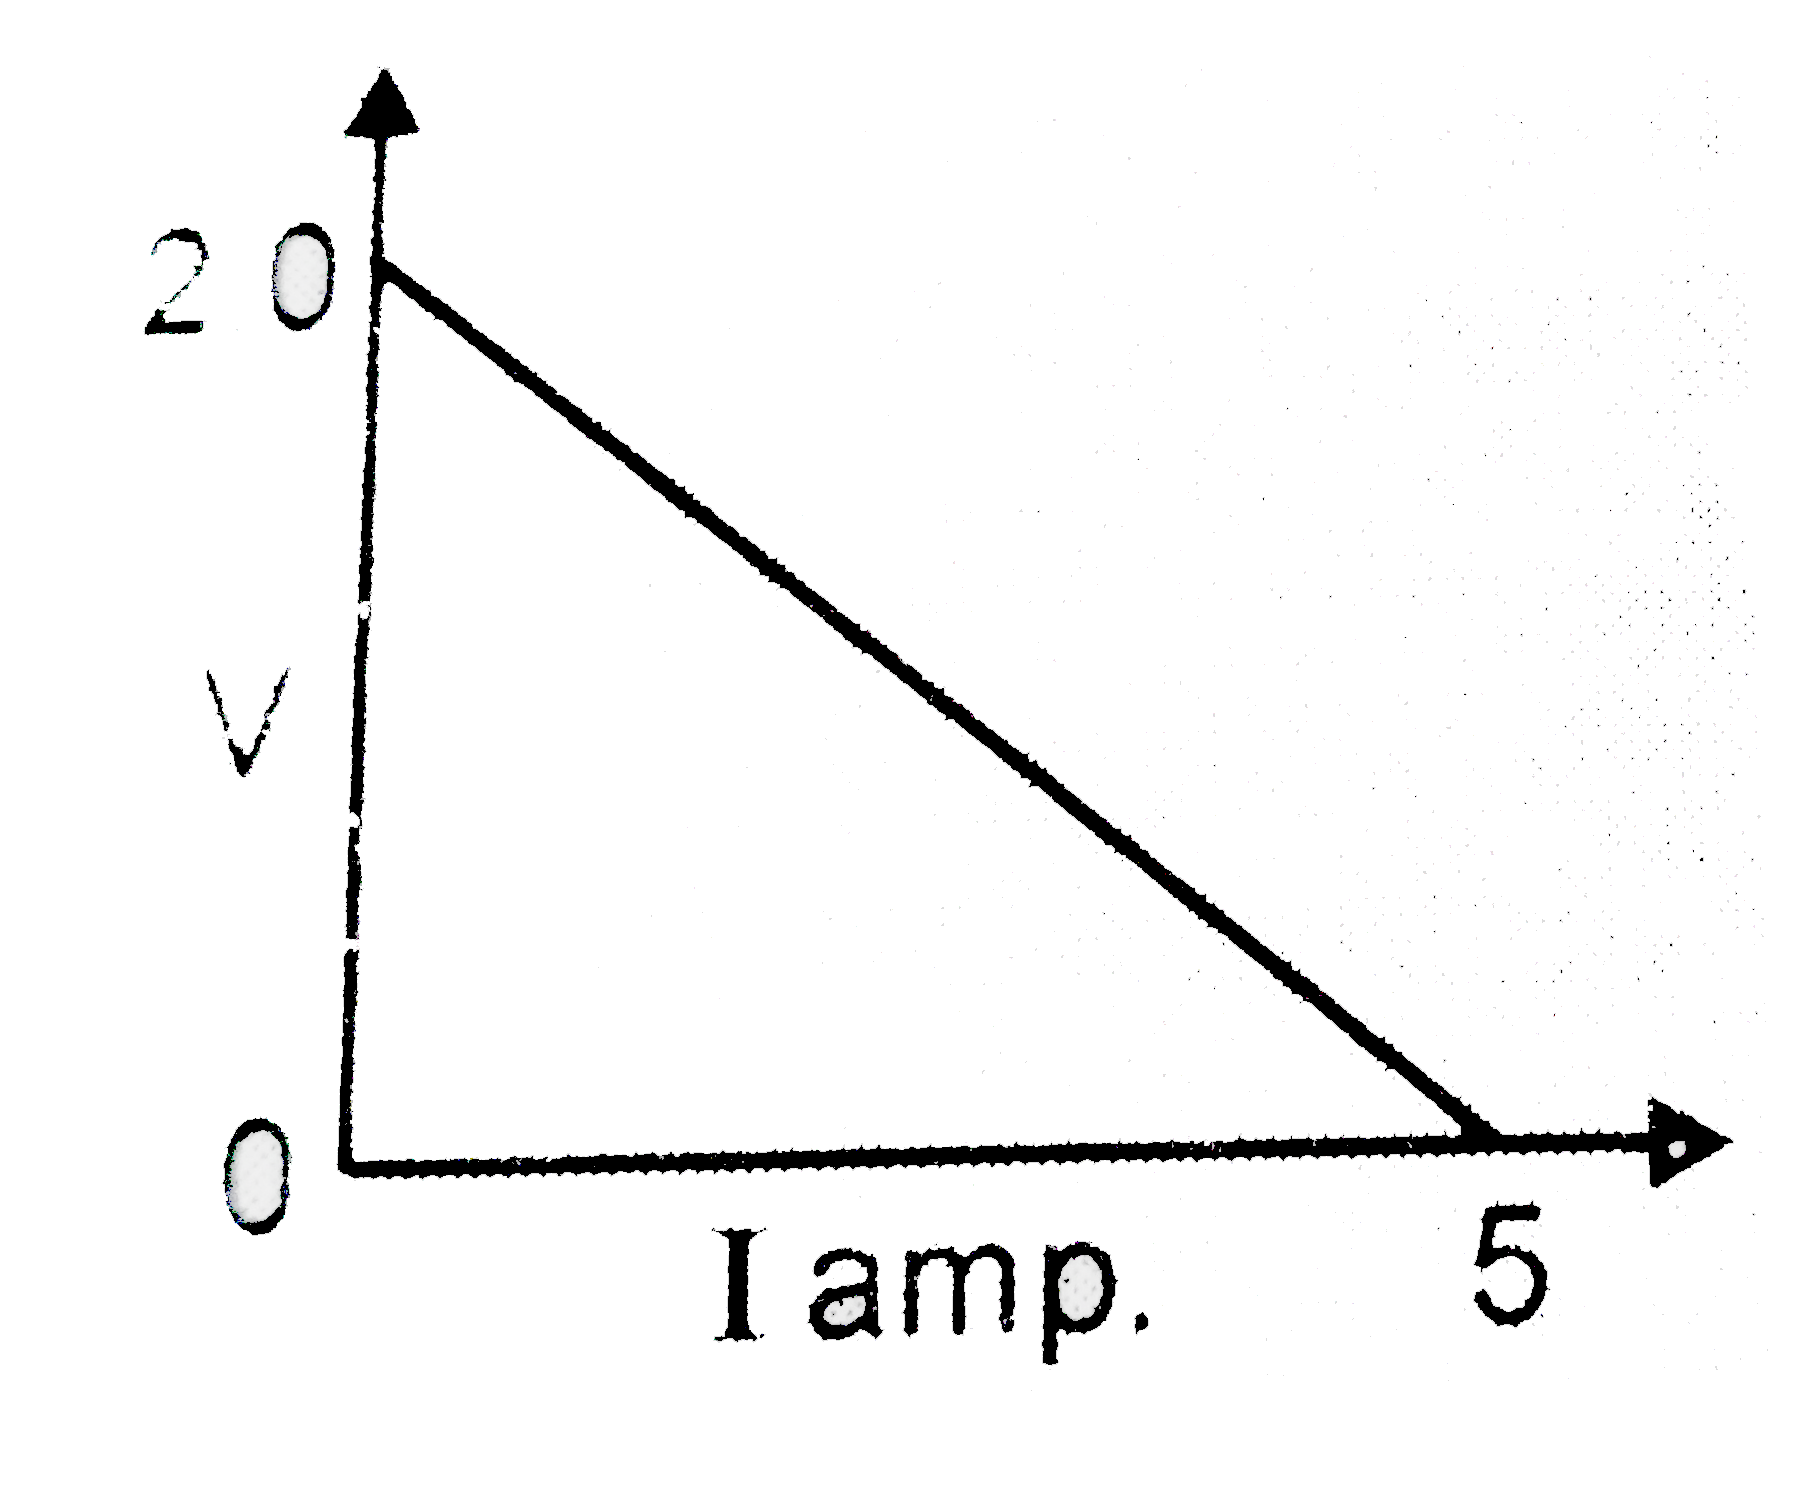 A4F3KB3F4KC4FKD2FK
for a cell, the graph between the p.d. (V) across the terminals of the cell ad te current I drawn from the cell is shown in the fig. the emf and the internal resistance of the cell is E and r respectively.
View SolutionFor a cell, a graph is plotted between the potential difference V across the terminals of the cell and the current I drawn the cell. The emf and the internal resistance of the cell are E and r, respectively. Then
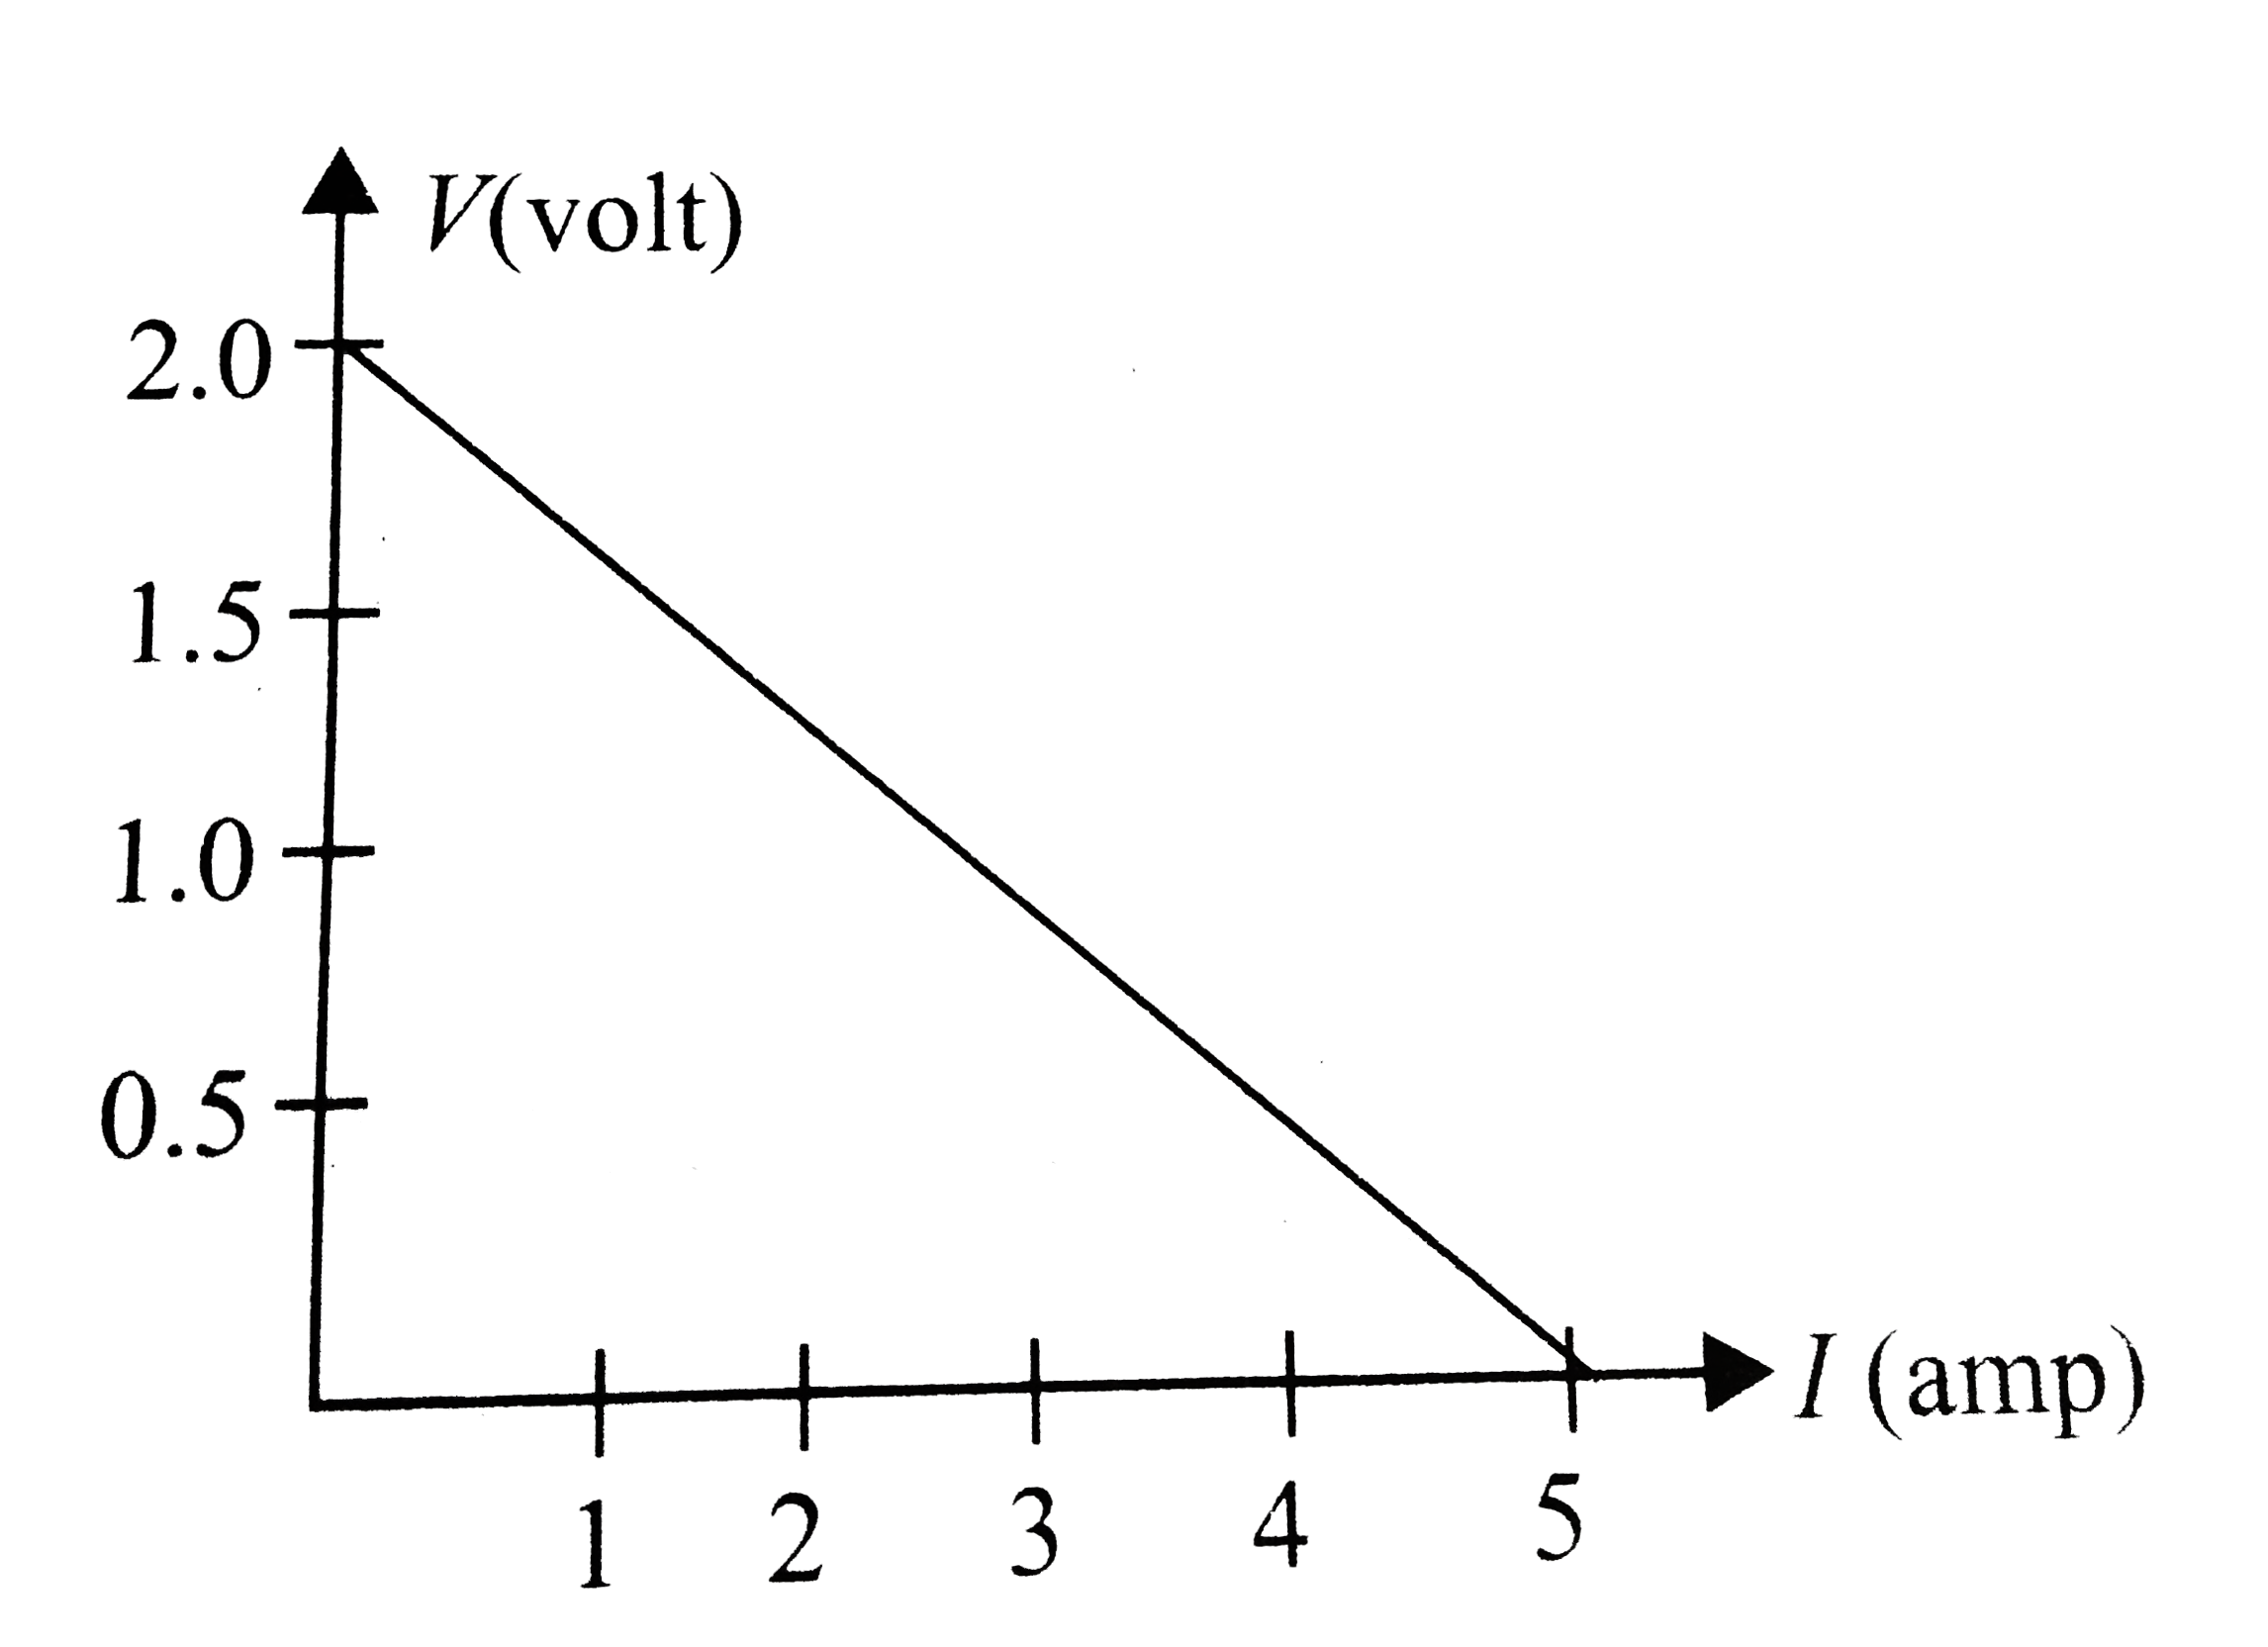
View SolutionTwo cells X and Y are connected to a resistance of 10Ω shown in the figure. The terminal voltage of cell Y is:-
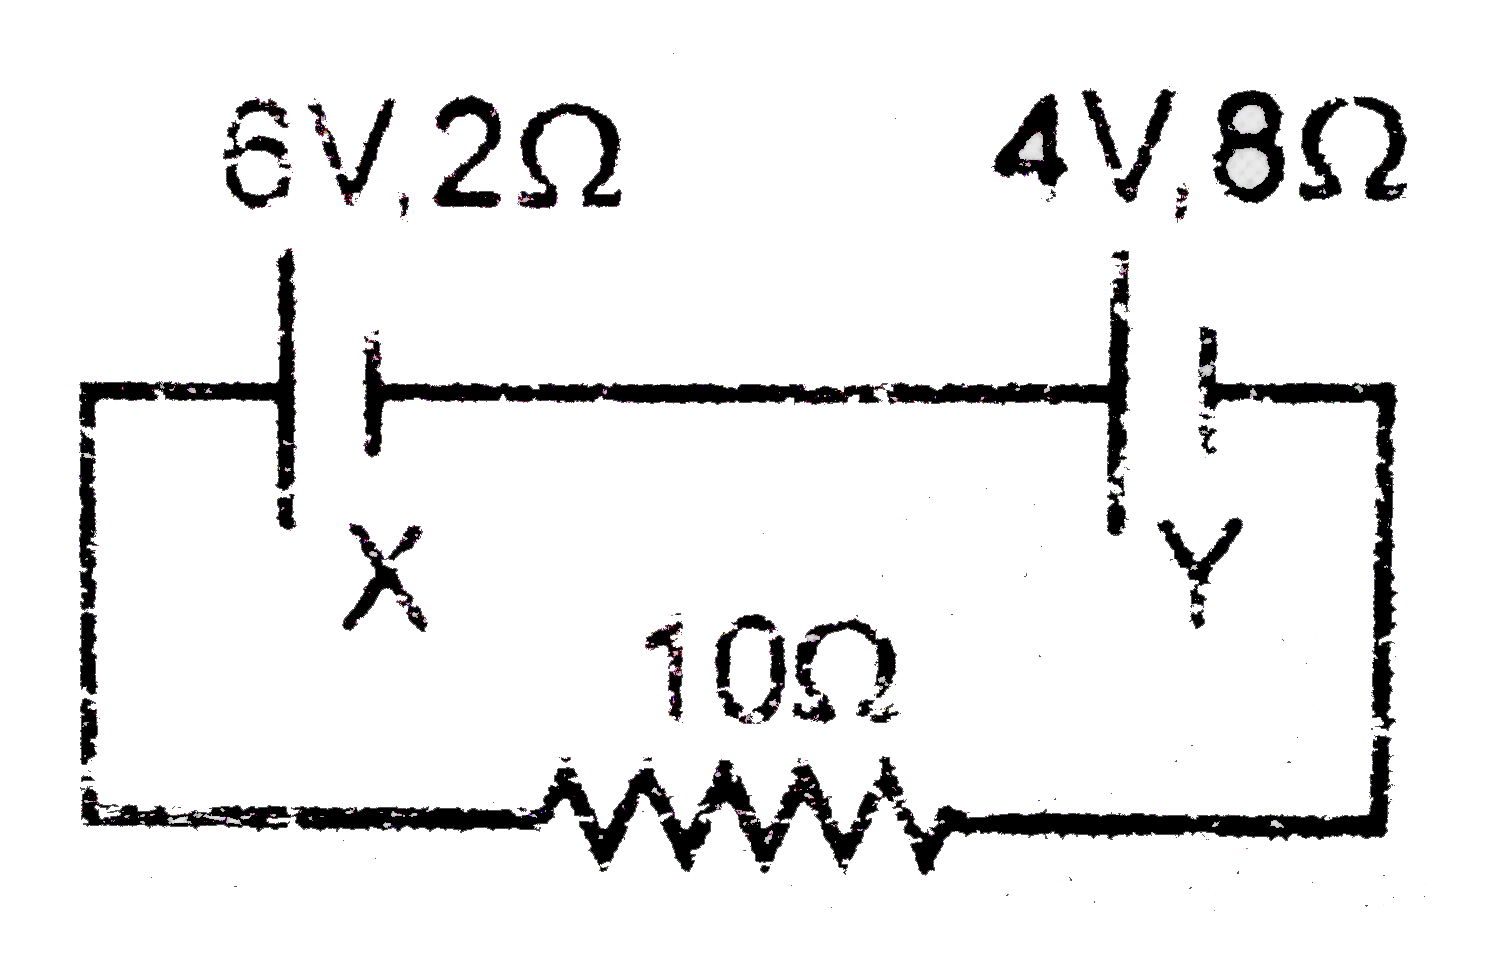
View SolutionA student measures the terminal potential difference (V) of a cell (of emf ε and internal resistance r) as a function of the current (I) flowing through it. The slope and intercept of the graph between V and I, then respectively, equal
View Solution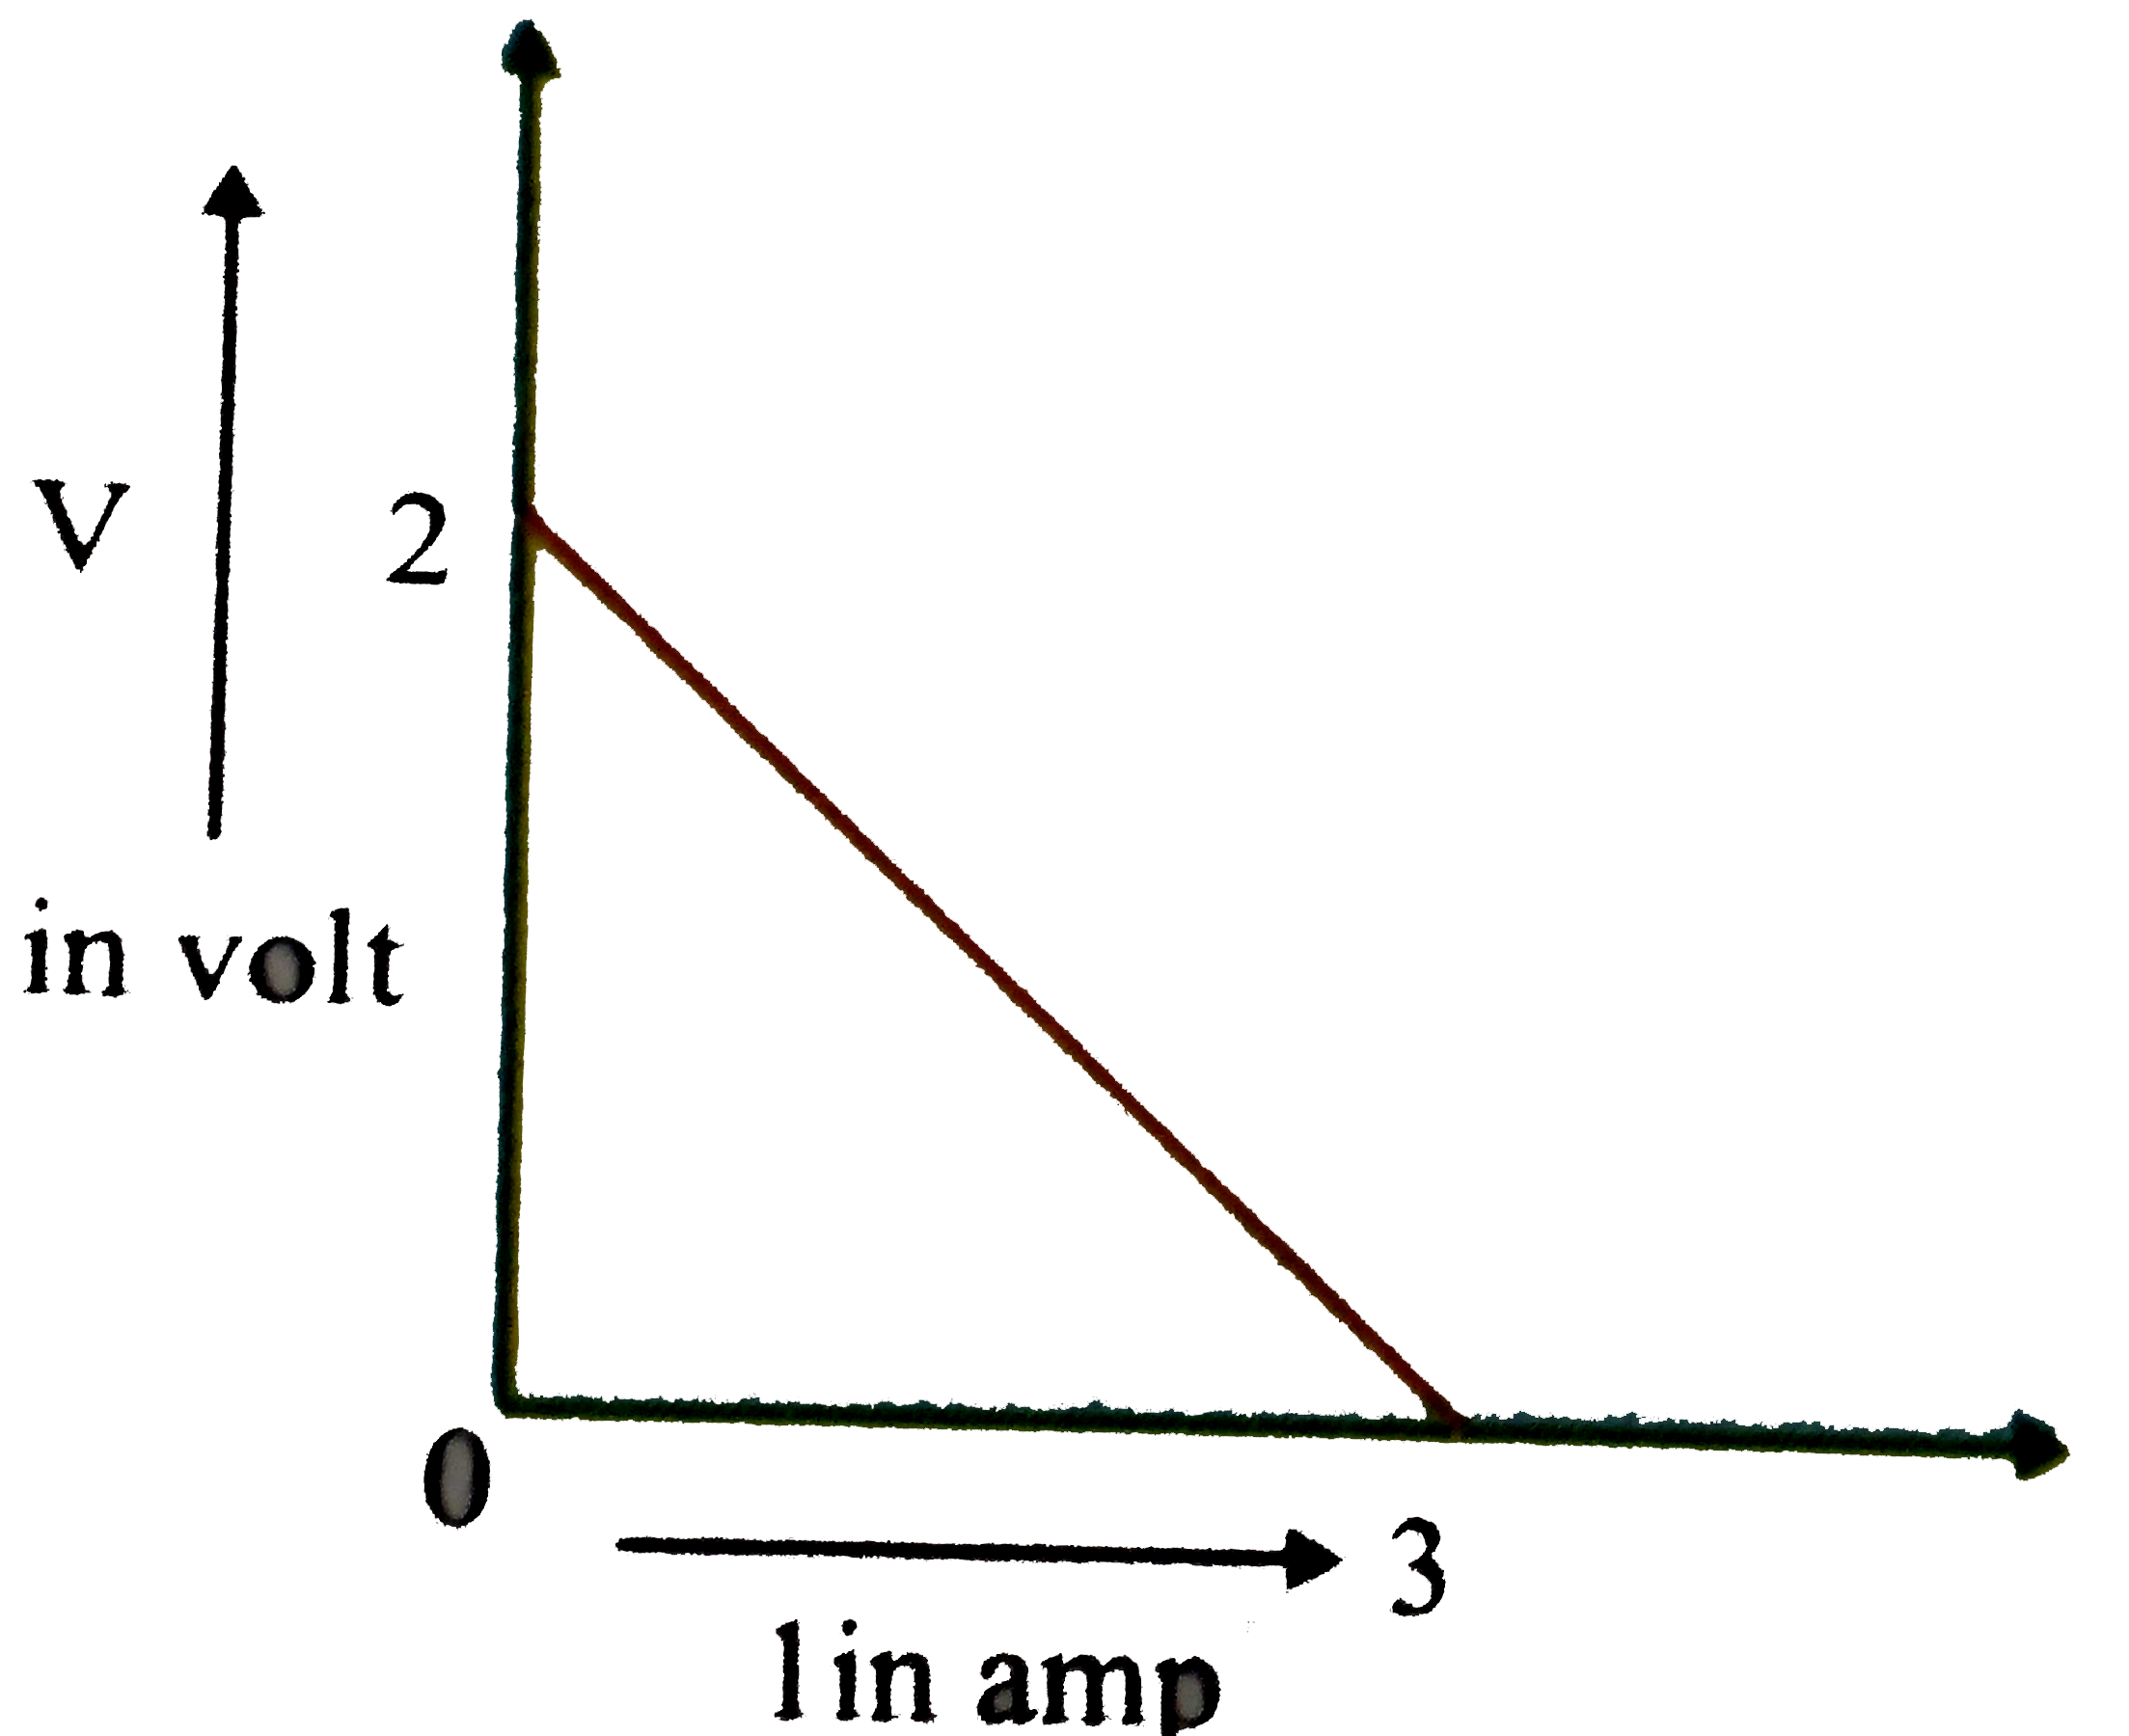
For a cell the graph between the p.d. (v) across the terminals of the cells and the current (I) drawn from the cell as shown. The emf and internal resistance is
View Solution

