A train moves from one station to another in two hours' time. Its speed-time graph during the motion is shown in figure. Identify the correct statement(s) regarding this graph.
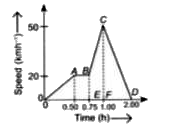
The maximum acceleration during the journey is 120 km/h2.
The distance covered during the time interval from 0.75 hr to 1 hr is 8.75 km.
(iii) During the time interval from 0 to 0.5 hrs, the train moves with constant velocity
Only (i) is correct.
Only (ii) is correct.
Both (i) and (ii) are correct
All (i), (ii) and (iii) are correct.
The correct Answer is:C
(i) As the part BC of the speed -time graph has maximum slope, so acceleration is maximum during this interval.
Maximum acceleration = Slope of BC
=(50−20)kmh−1(1.00−0.75)h=300.25=120kmh−2
(ii) Distance covered from 0.75 h to 1.00 h
= Area of trapezium BEFC
=12[BE+CF]×EF
=12[20+50]×(1.00−0.75)km=8.75km
Topper's Solved these Questions
- MOTION BOOK - SCIENCE OLYMPIAD FOUNDATION CHAPTER - MOTION EXERCISE - ACHIEVERS SECTION (HOTS)
5 Videos
- GRAVITATION BOOK - SCIENCE OLYMPIAD FOUNDATION CHAPTER - GRAVITATION EXERCISE - ACHIEVERS SECTION (HOTS)
5 Videos
- NSO QUESTION PAPER 2016 SET A BOOK - SCIENCE OLYMPIAD FOUNDATION CHAPTER - NSO QUESTION PAPER 2016 SET A EXERCISE - ACHIEVERS SECTION
2 Videos
Similar Questions
A train moves from one station to another in 2 hours time. Its speed-time graph during this motion is shown in the figure. The maximum acceleration during the journey is
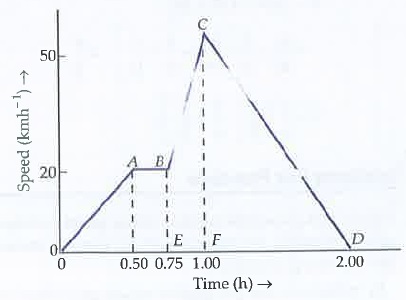
View SolutionA train moves from one station to another in two hours' time. Its speed-time graph during the motionis shown in Fig. 3.59 : calculate the distance covered during the time interval from 0.75 hour to 1 hour.
View Solution
Knowledge Check
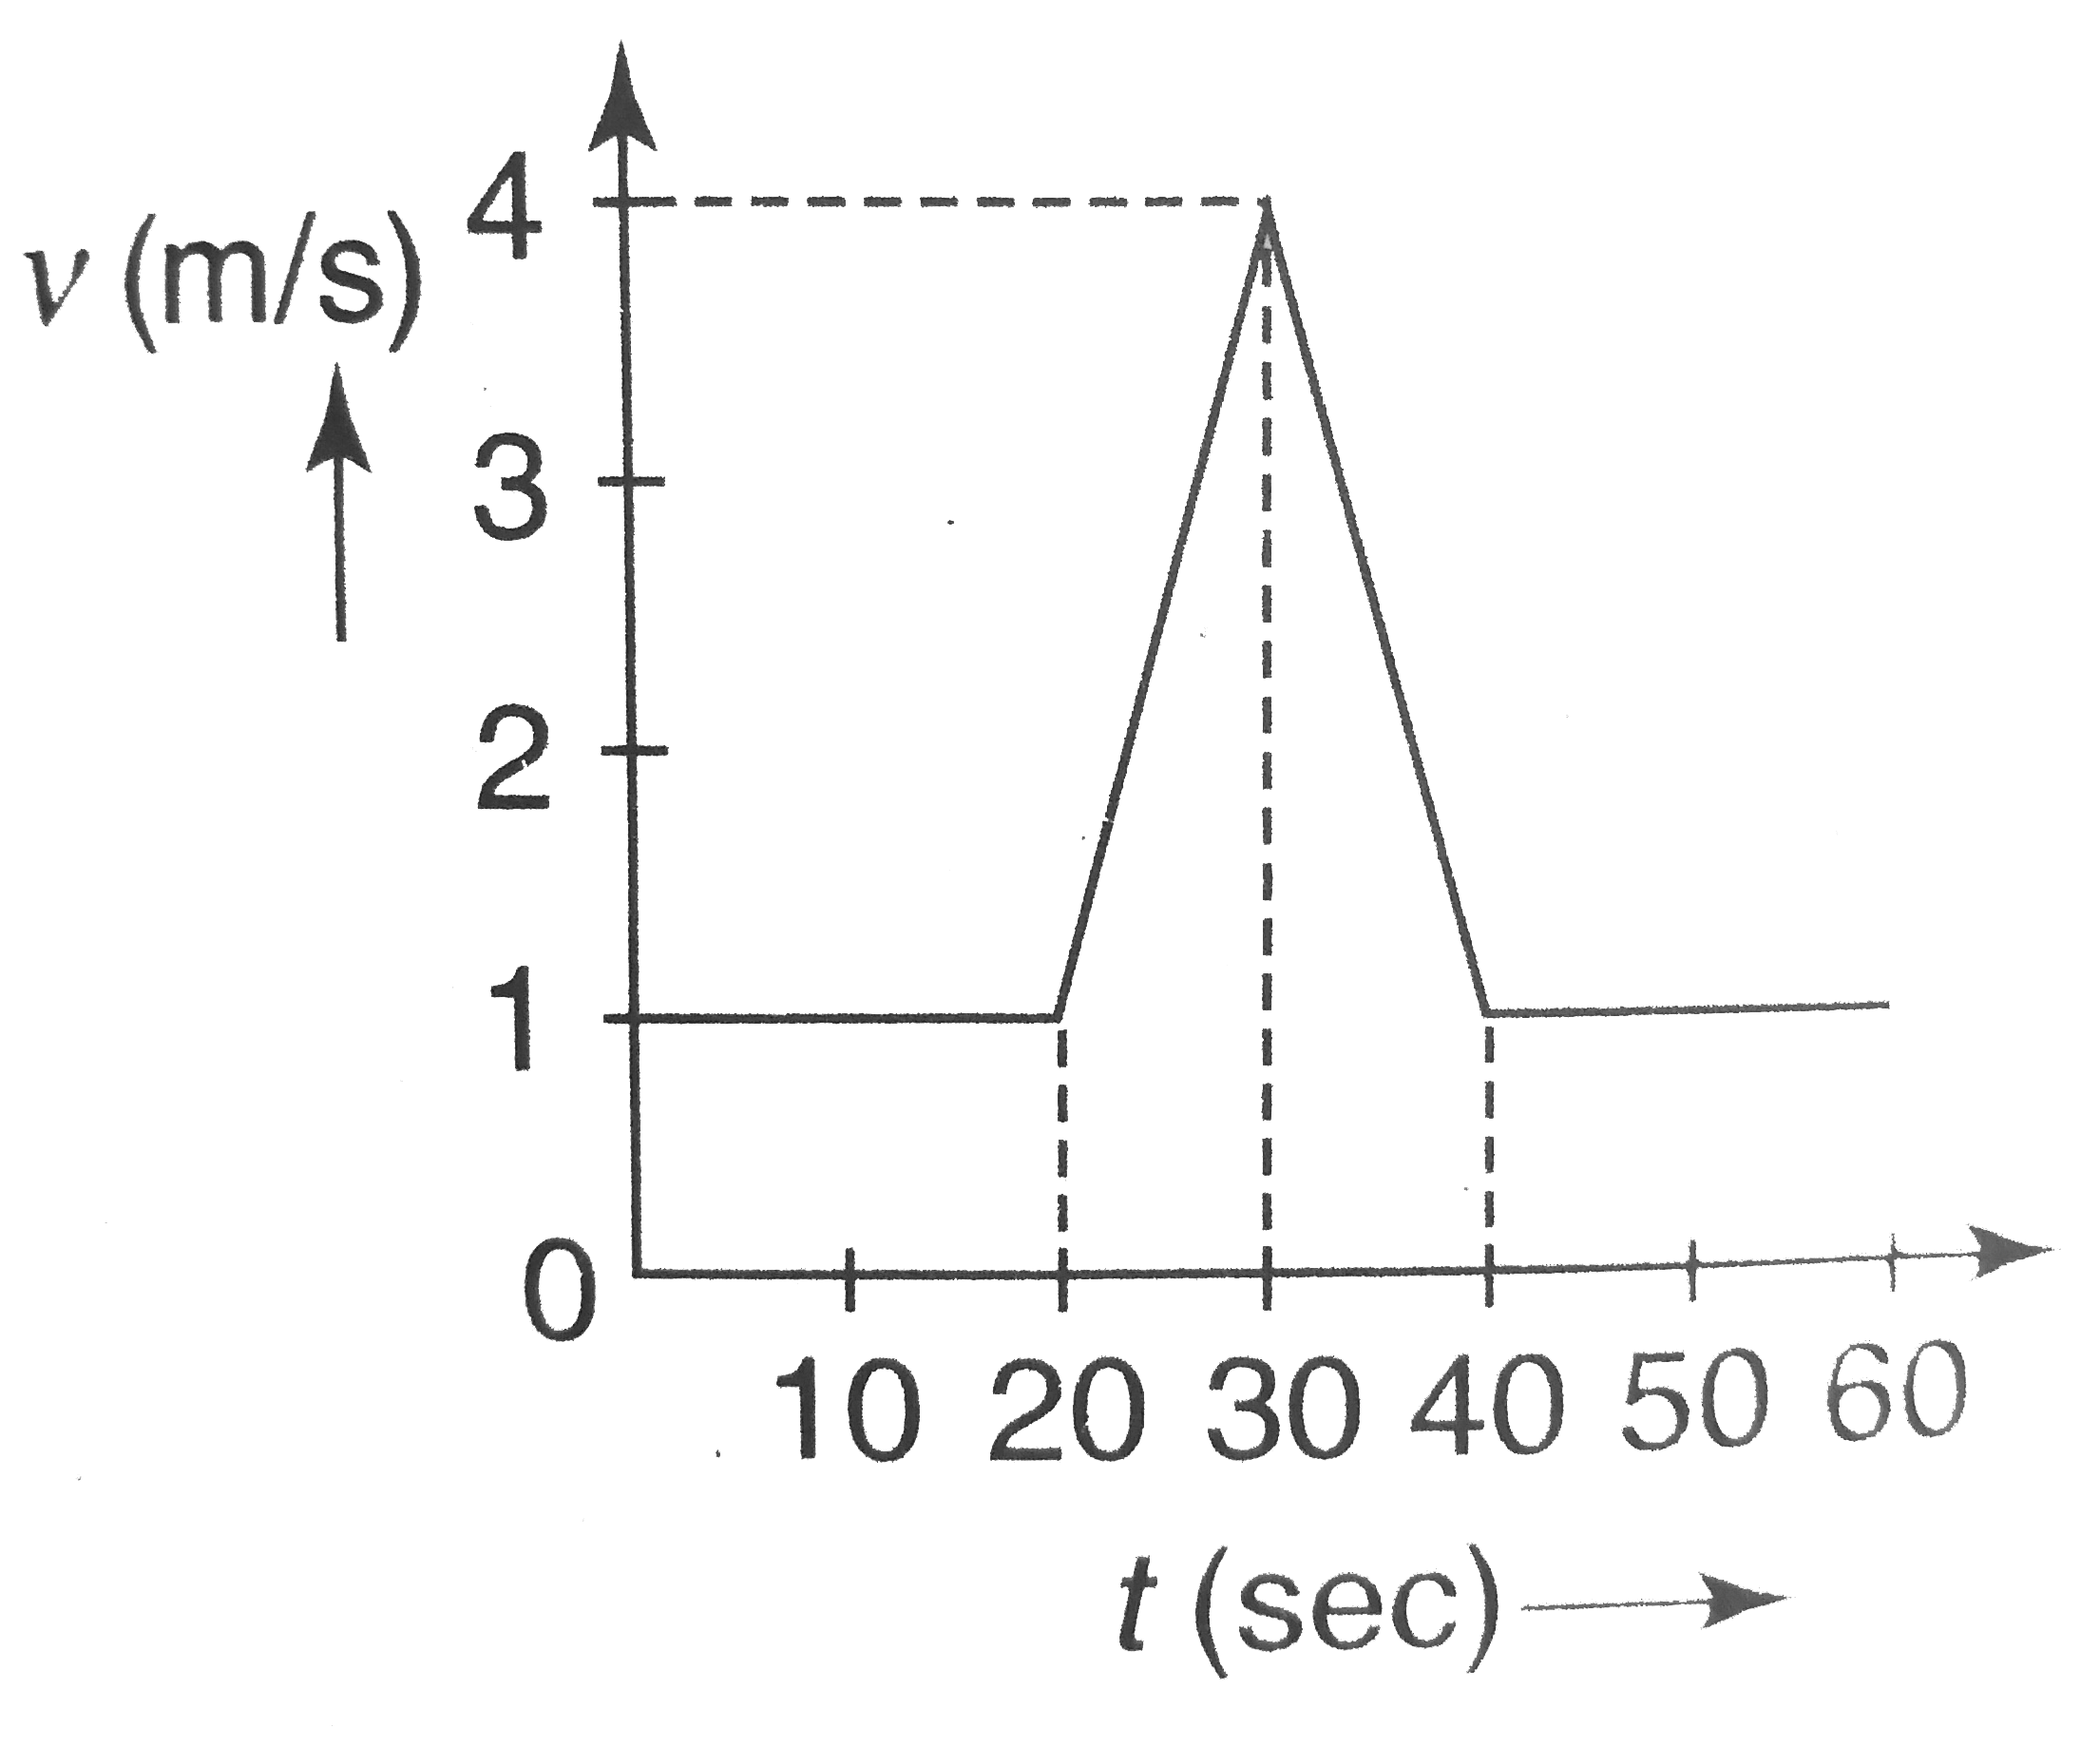
Velocity-time graph for a moving object is shown in the figure. Total displacement of the object during the time interval when there is non-zero acceleration and retardation is.
 A60 mB50 mC30 mD40 m
A train moves from one station to another in two hours time. Its speed during the motion is shown in the graph Calculate (i) Maximum acceleration during the journey.
(ii) Distance covered during the time interval from 0.75 hour to 1 hour
View SolutionA train moves from one station to another in two hours time. Its speed during the motion is shown in the graph Calculate
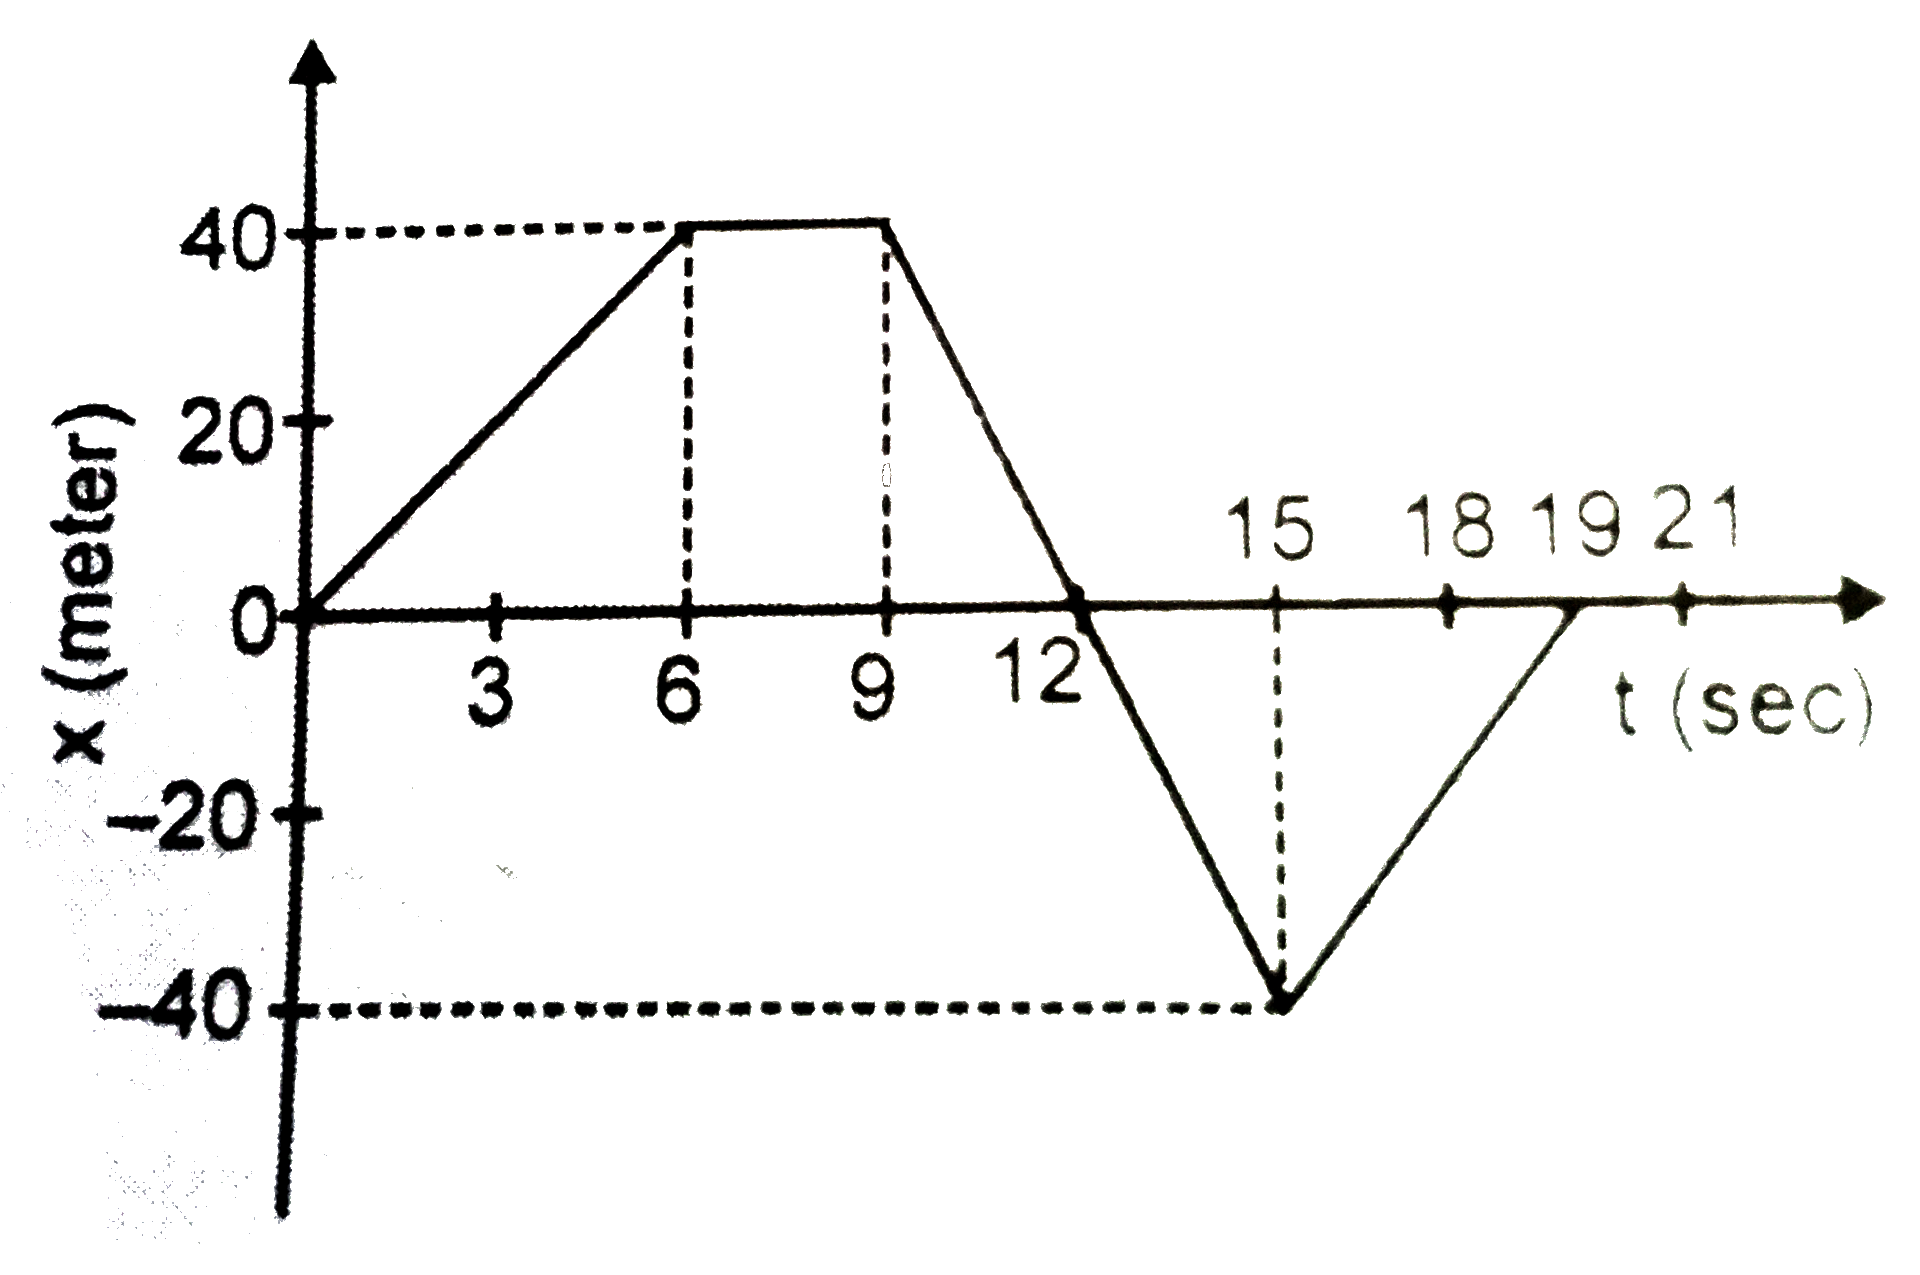
(i) Maximum acceleration during the journey.
(ii) Distance covered during the time interval from 0.75 hour to 1 hour
View SolutionA train accelerates from 20 km/h to 80km/h in 4 minutes.The distance covered by train during this period is
View SolutionThe plot of speed for the journey of a bus from one bus stop to another is shown below.
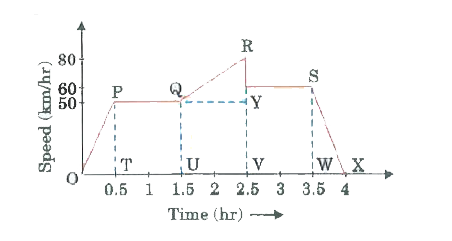
(i) Find the maximum acceleration for deceleration of the bus during the journey
(ii) Calculate the distance covered by the bus from 0.5 hr to 2.5 hr.
View SolutionVelocity-time graph for a moving object is shown in the figure. Total displacement of the object during the time interval when there is non-zero acceleration and retardation is.

View SolutionThe speed verses time graph for a particle is shown in the figure. The distance travelled (in m) by the particle during the time interval t = 0 to t = 5 s will be __________
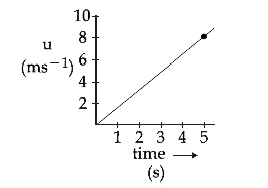
View SolutionThe speed verses time graph for a particle is shown in the figure. The distance travelled (in m) by the particle during the time interval t = 0 to t = 5 s will be __________

View Solution
