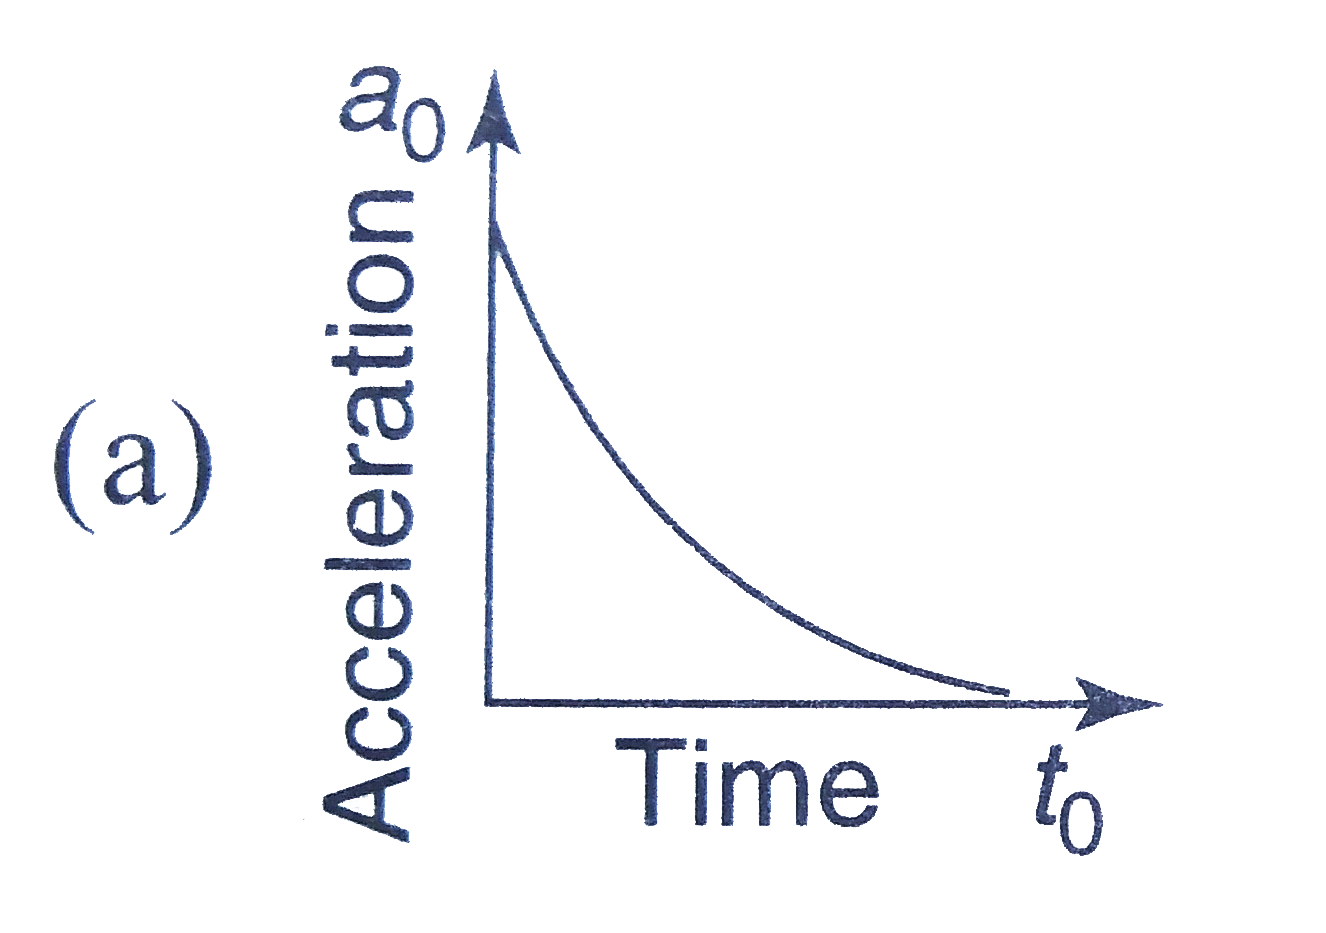
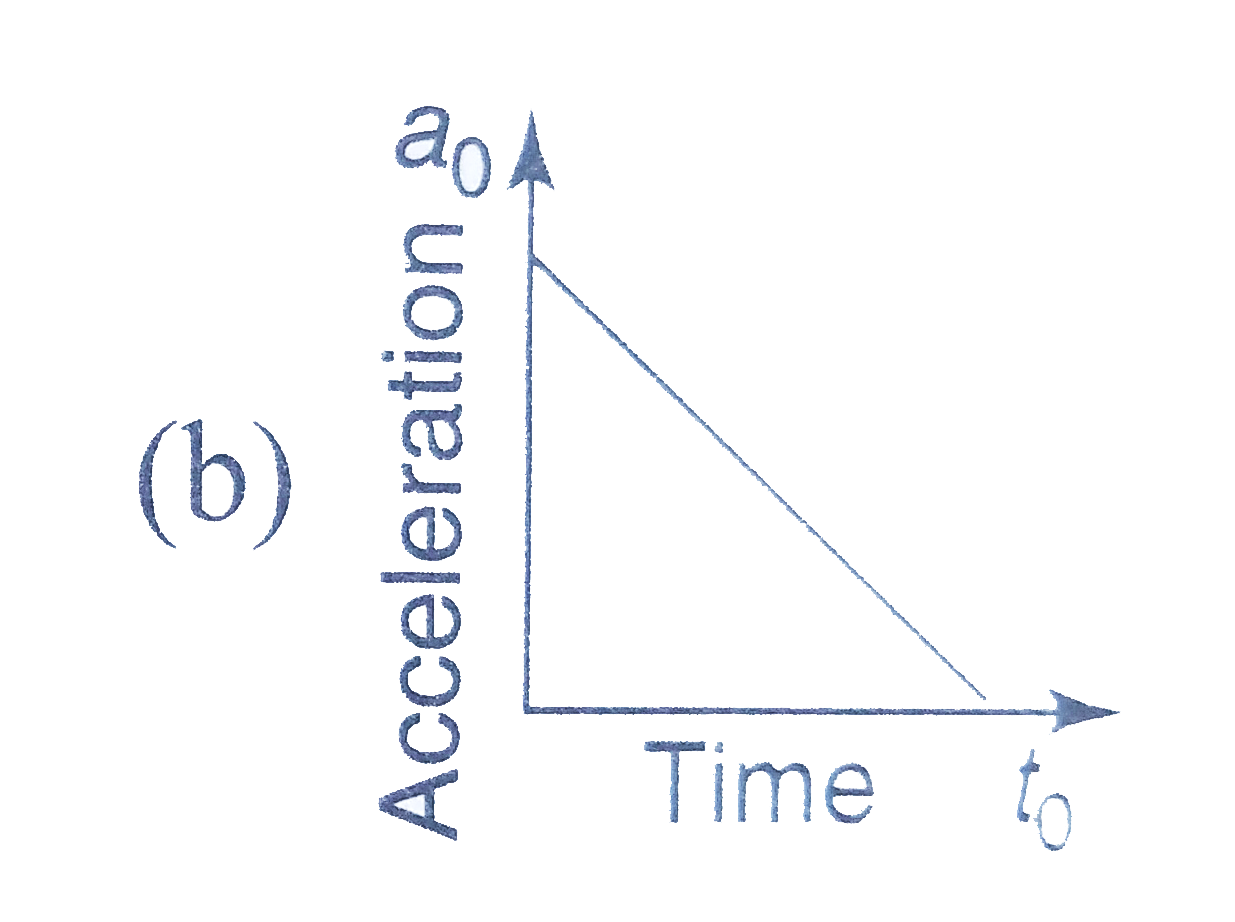
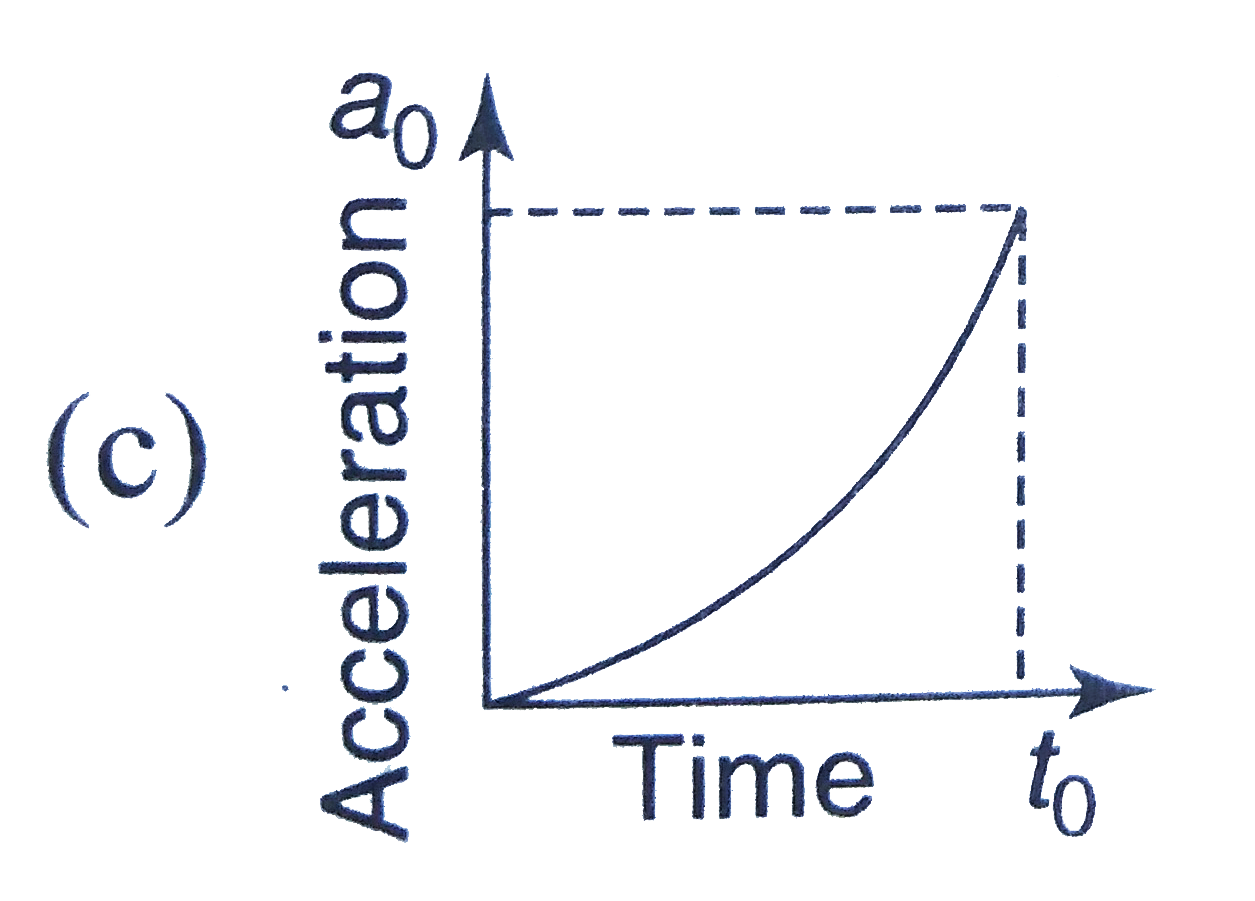
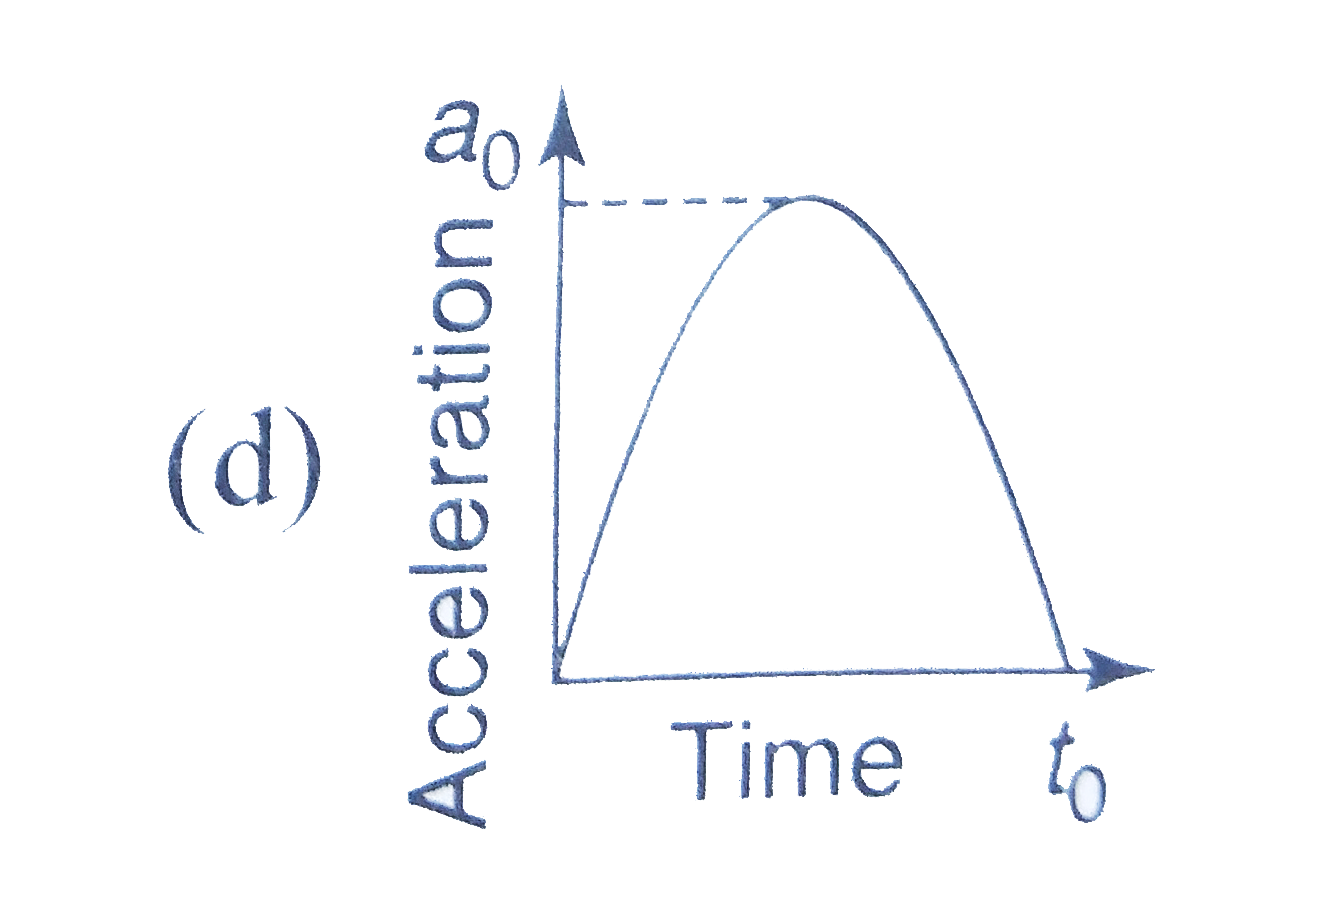
Acceleration versus time graph for four objects are shown below. All axes have the same scale. Which object had the greatest change in velocity during the interval ?
 .
.
 .
.
 .
.
 .
.
The correct Answer is:D
To determine which object had the greatest change in velocity during the interval from the acceleration versus time graphs, we can follow these steps:
Step 1: Understand the relationship between acceleration and change in velocity
The change in velocity (Δv) can be calculated using the formula:
Δv=∫adt
This means that the change in velocity is equal to the area under the acceleration versus time graph.
Step 2: Identify the area under each graph
To find the change in velocity for each object, we need to calculate the area under the acceleration-time graph for each object. The area can be calculated by identifying the shapes formed under the curve (rectangles, triangles, etc.) and applying the appropriate area formulas.
Step 3: Calculate the area for each object
1. Object A: Calculate the area under the curve for Object A. If it forms a triangle or rectangle, use the respective area formula.
2. Object B: Calculate the area under the curve for Object B.
3. Object C: Calculate the area under the curve for Object C.
4. Object D: Calculate the area under the curve for Object D.
Step 4: Compare the areas
Once you have calculated the areas for all four objects, compare them to determine which one is the largest. The object with the largest area under the curve will have the greatest change in velocity.
Step 5: Conclusion
The object with the greatest area under the acceleration versus time graph corresponds to the greatest change in velocity. Based on the analysis, conclude which object had the greatest change in velocity.
The change in velocity (Δv) can be calculated using the formula:
Δv=∫adt
This means that the change in velocity is equal to the area under the acceleration versus time graph.
To find the change in velocity for each object, we need to calculate the area under the acceleration-time graph for each object. The area can be calculated by identifying the shapes formed under the curve (rectangles, triangles, etc.) and applying the appropriate area formulas.
1. Object A: Calculate the area under the curve for Object A. If it forms a triangle or rectangle, use the respective area formula.
2. Object B: Calculate the area under the curve for Object B.
3. Object C: Calculate the area under the curve for Object C.
4. Object D: Calculate the area under the curve for Object D.
Once you have calculated the areas for all four objects, compare them to determine which one is the largest. The object with the largest area under the curve will have the greatest change in velocity.
The object with the greatest area under the acceleration versus time graph corresponds to the greatest change in velocity. Based on the analysis, conclude which object had the greatest change in velocity.
Topper's Solved these Questions
- BOOK - A2ZCHAPTER - GENERAL KINEMATICS AND MOTION IN ONE DIMENSIONEXERCISE - Problem Based On Mixed Concepts30videos
GENERAL KINEMATICS AND MOTION IN ONE DIMENSION
- BOOK - A2ZCHAPTER - GENERAL KINEMATICS AND MOTION IN ONE DIMENSIONEXERCISE - Assertion Reasoning20videos
GENERAL KINEMATICS AND MOTION IN ONE DIMENSION
- BOOK - A2ZCHAPTER - GENERAL KINEMATICS AND MOTION IN ONE DIMENSIONEXERCISE - Relative Motion In One Dimension20videos
GENERAL KINEMATICS AND MOTION IN ONE DIMENSION
- BOOK - A2ZCHAPTER - FLUID MECHANICSEXERCISE - Chapter Test29videos
FLUID MECHANICS
- BOOK - A2ZCHAPTER - GRAVITATIONEXERCISE - Chapter Test29videos
GRAVITATION
Similar Questions
Knowledge Check
- Question 1 - Select One
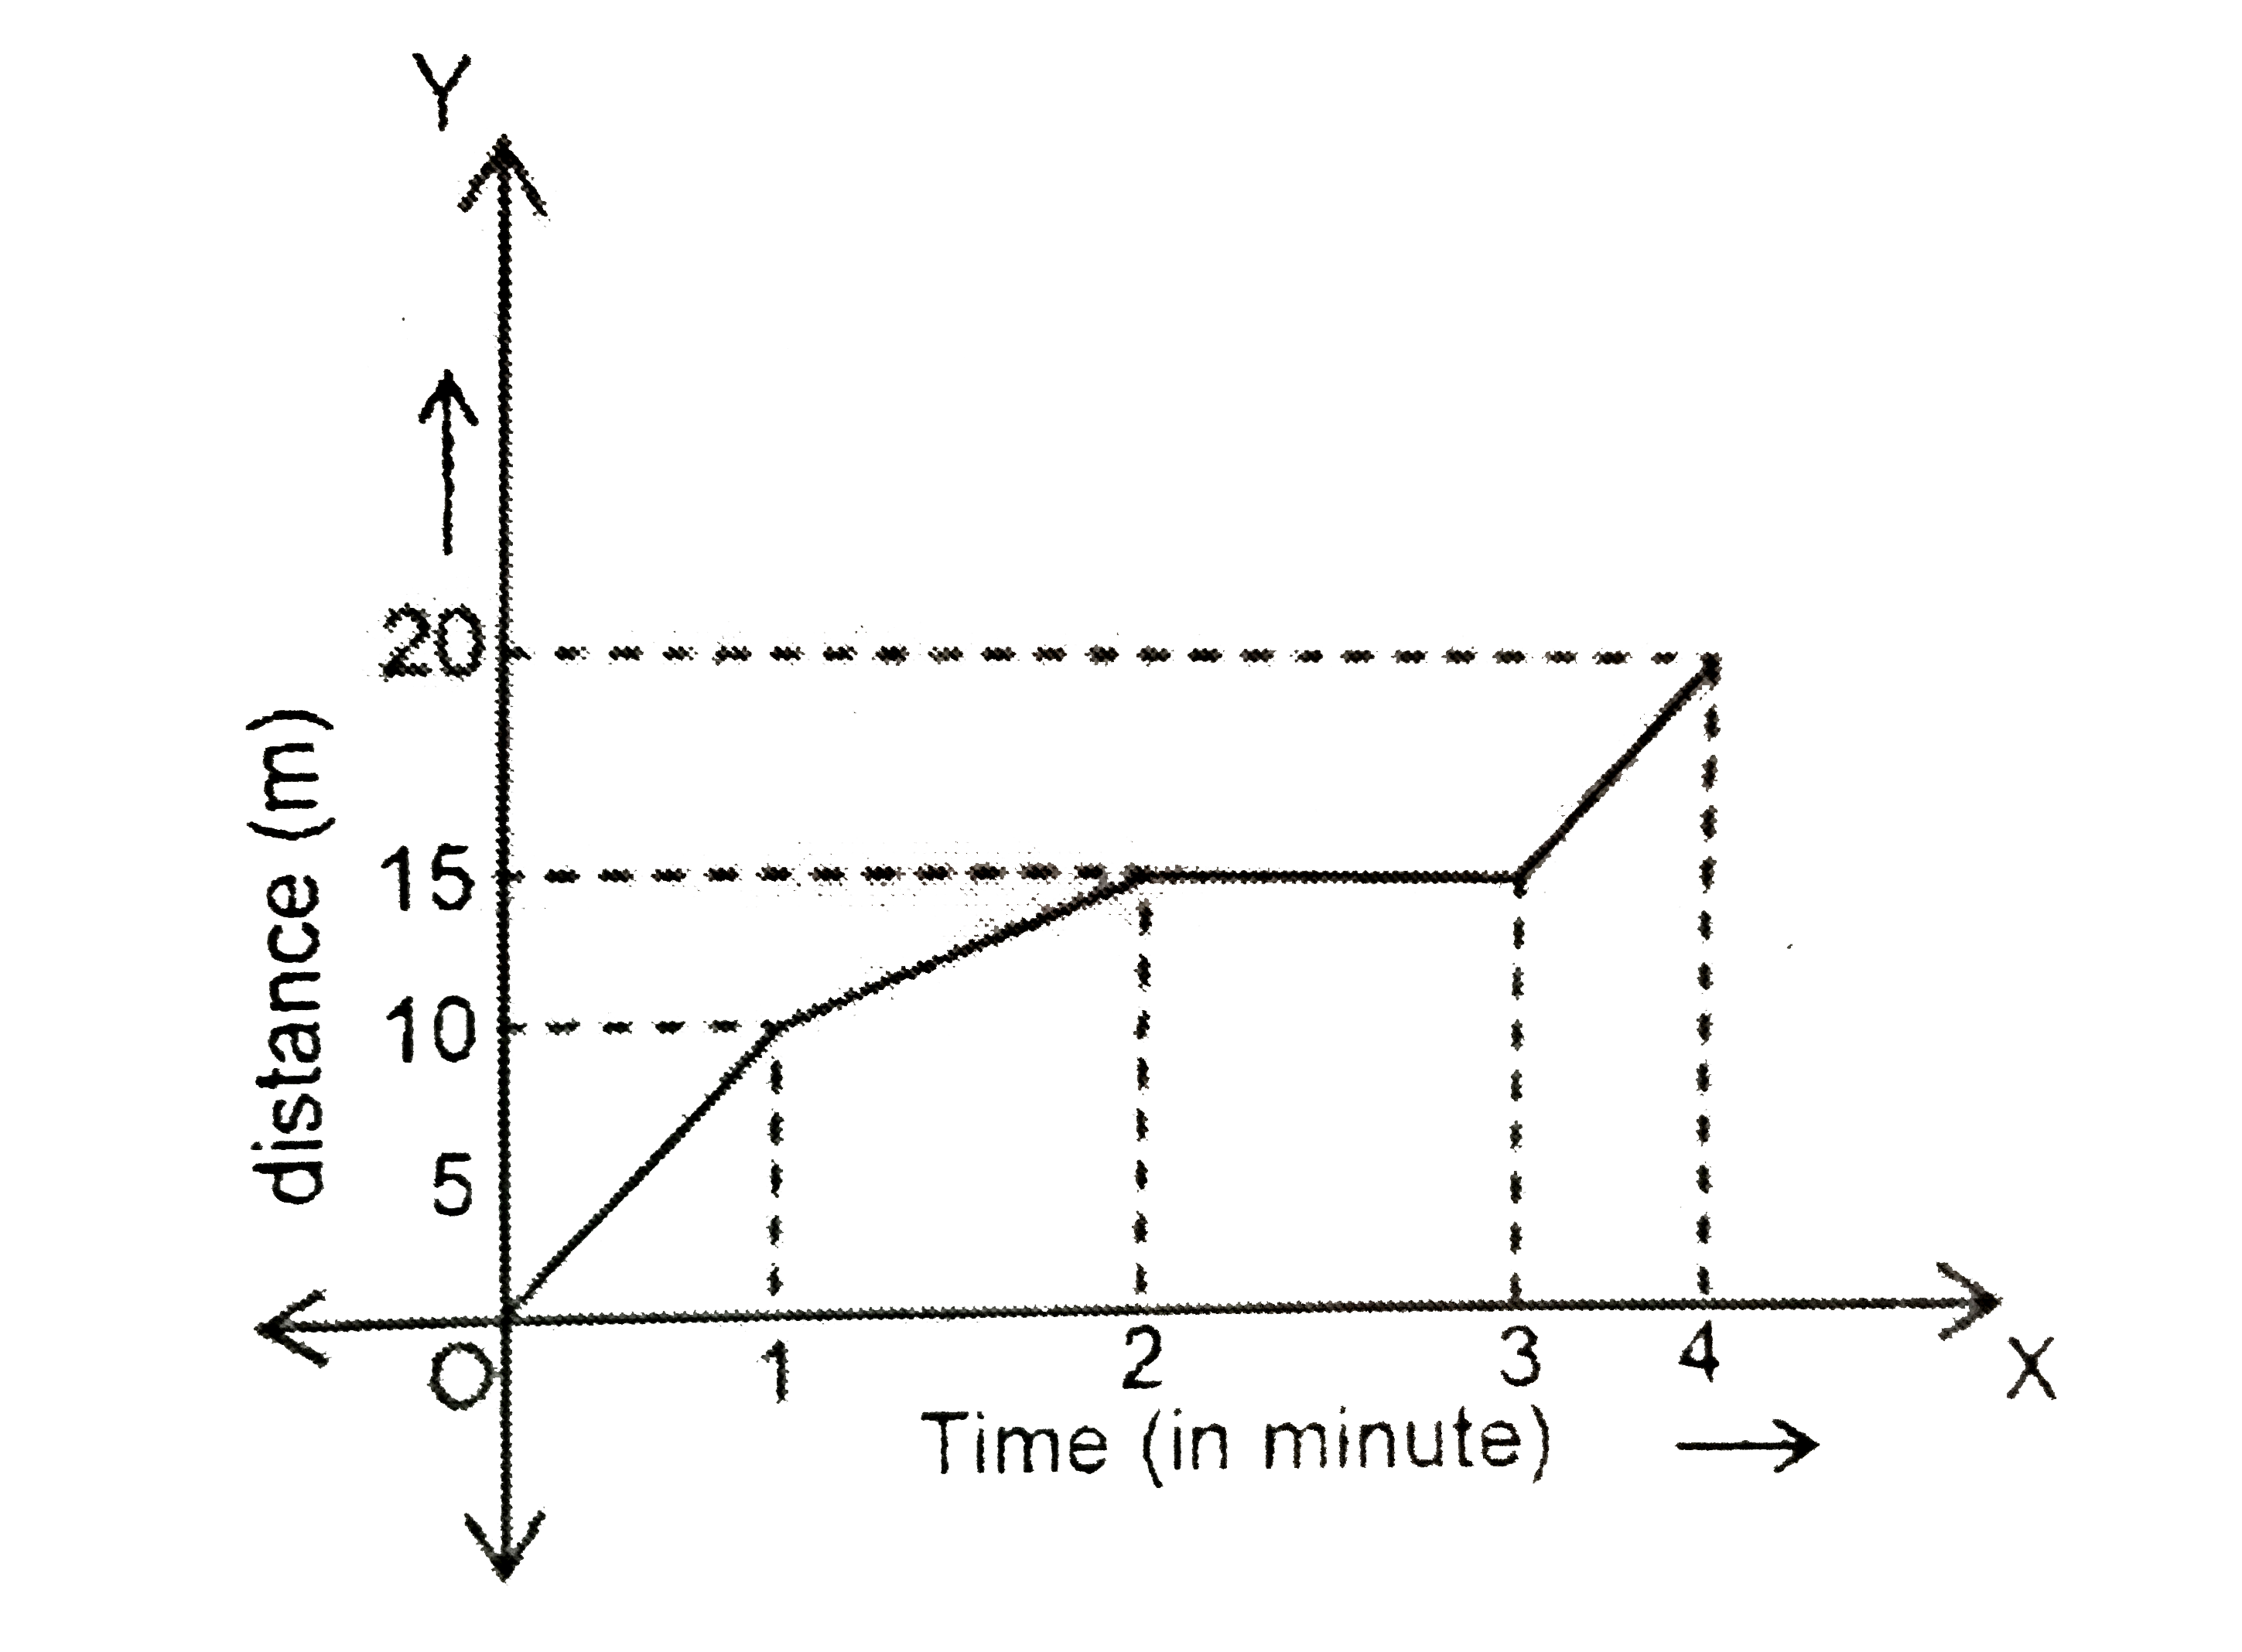
Distance versus time graph of an object is as shown in the figure. The average speed of the object is _____ ms−1
 A0.08B0.5C1D2
 - Question 2 - Select One
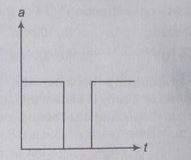
Acceleration time graph of a body is shown below the corresponding velocity time graph of the same body is
 A
A B
B C
C D
D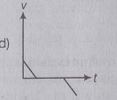
- Question 3 - Select One
Acceleration time graph of a body is shown below the corresponding velocity time graph of the same body is
 A
A B
B C
C D
D
The position - time graph of an object is given below. What is the velocity of the object?
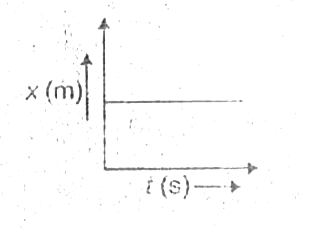 View Solution
The position - time graph of an object is given below. What is the velocity of the object?
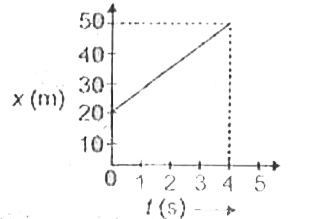 View Solution
The position-time graph of an object is given below. What is the velocity of the object?
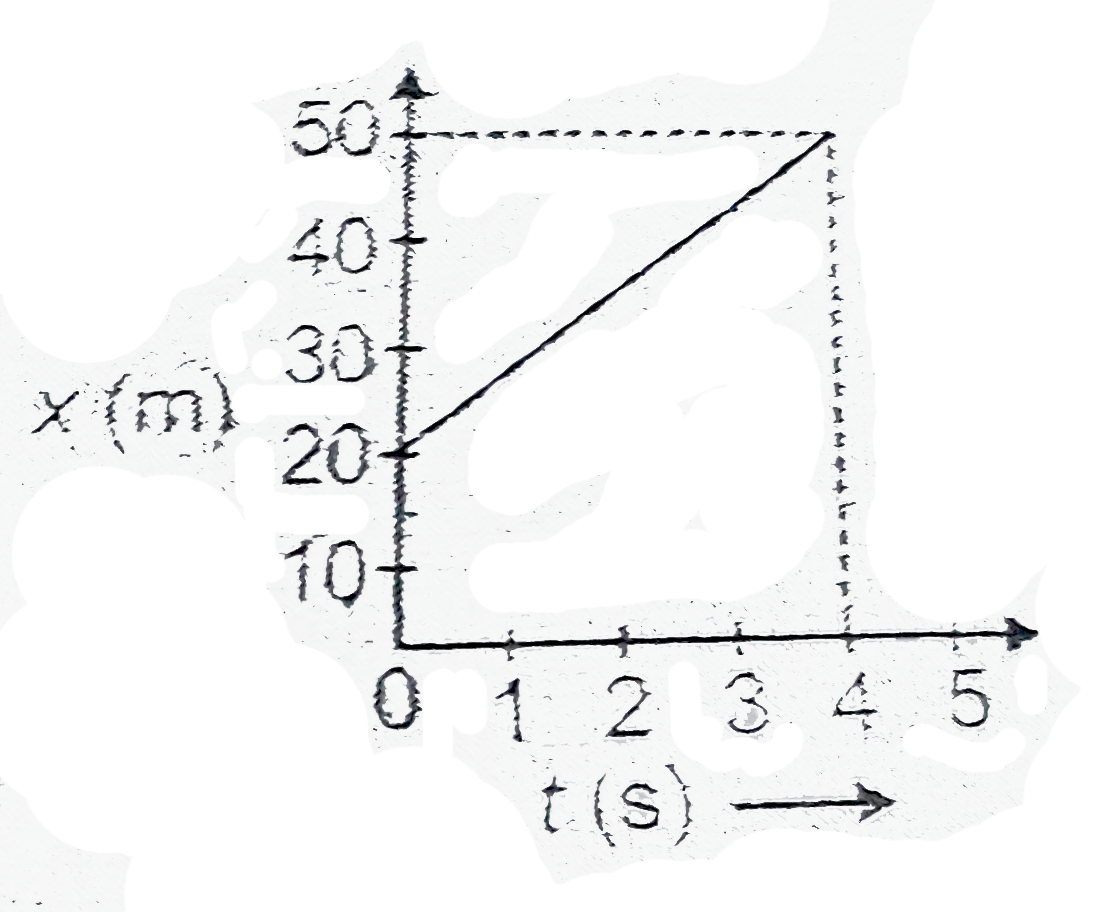 View Solution
The position-time graph of an object is given below. What is the velocity of the object?
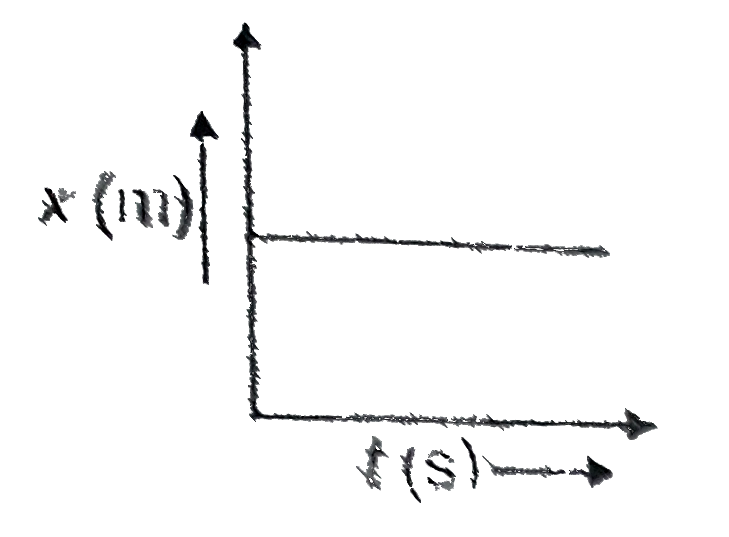 View Solution
Distance versus time graph of an object is as shown in the figure. The average speed of the object is _____ ms−1
 View Solution


