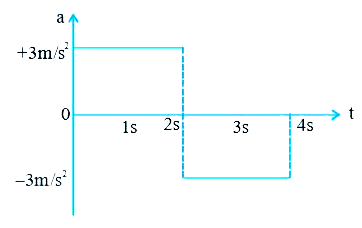
Considering that a particle starts its motion from rest draw the displacement- velocity graph from the given acceleration-time graph.

The displacement -velocity graph of the given acceleration-time graph is drawn below.

Topper's Solved these Questions
- BOOK - CHHAYA PUBLICATIONCHAPTER - ONE - DIMENSIONAL MOTION EXERCISE - EXERCISE (Multiple Choice Questions)31videos
ONE - DIMENSIONAL MOTION
- BOOK - CHHAYA PUBLICATIONCHAPTER - ONE - DIMENSIONAL MOTION EXERCISE - EXERCISE ( Graphical Analysis )1videos
ONE - DIMENSIONAL MOTION
- BOOK - CHHAYA PUBLICATIONCHAPTER - ONE - DIMENSIONAL MOTION EXERCISE - Section Related Questions17videos
ONE - DIMENSIONAL MOTION
- BOOK - CHHAYA PUBLICATIONCHAPTER - NEWTONIAN GRAVITATION AND PLANETARY MOTIONEXERCISE - CBSE SCANNER19videos
NEWTONIAN GRAVITATION AND PLANETARY MOTION
- BOOK - CHHAYA PUBLICATIONCHAPTER - QUESTION PAPERS OF NEET -2017EXERCISE - QUESTION32videos
QUESTION PAPERS OF NEET -2017
Similar Questions
Knowledge Check
- Question 1 - Select One
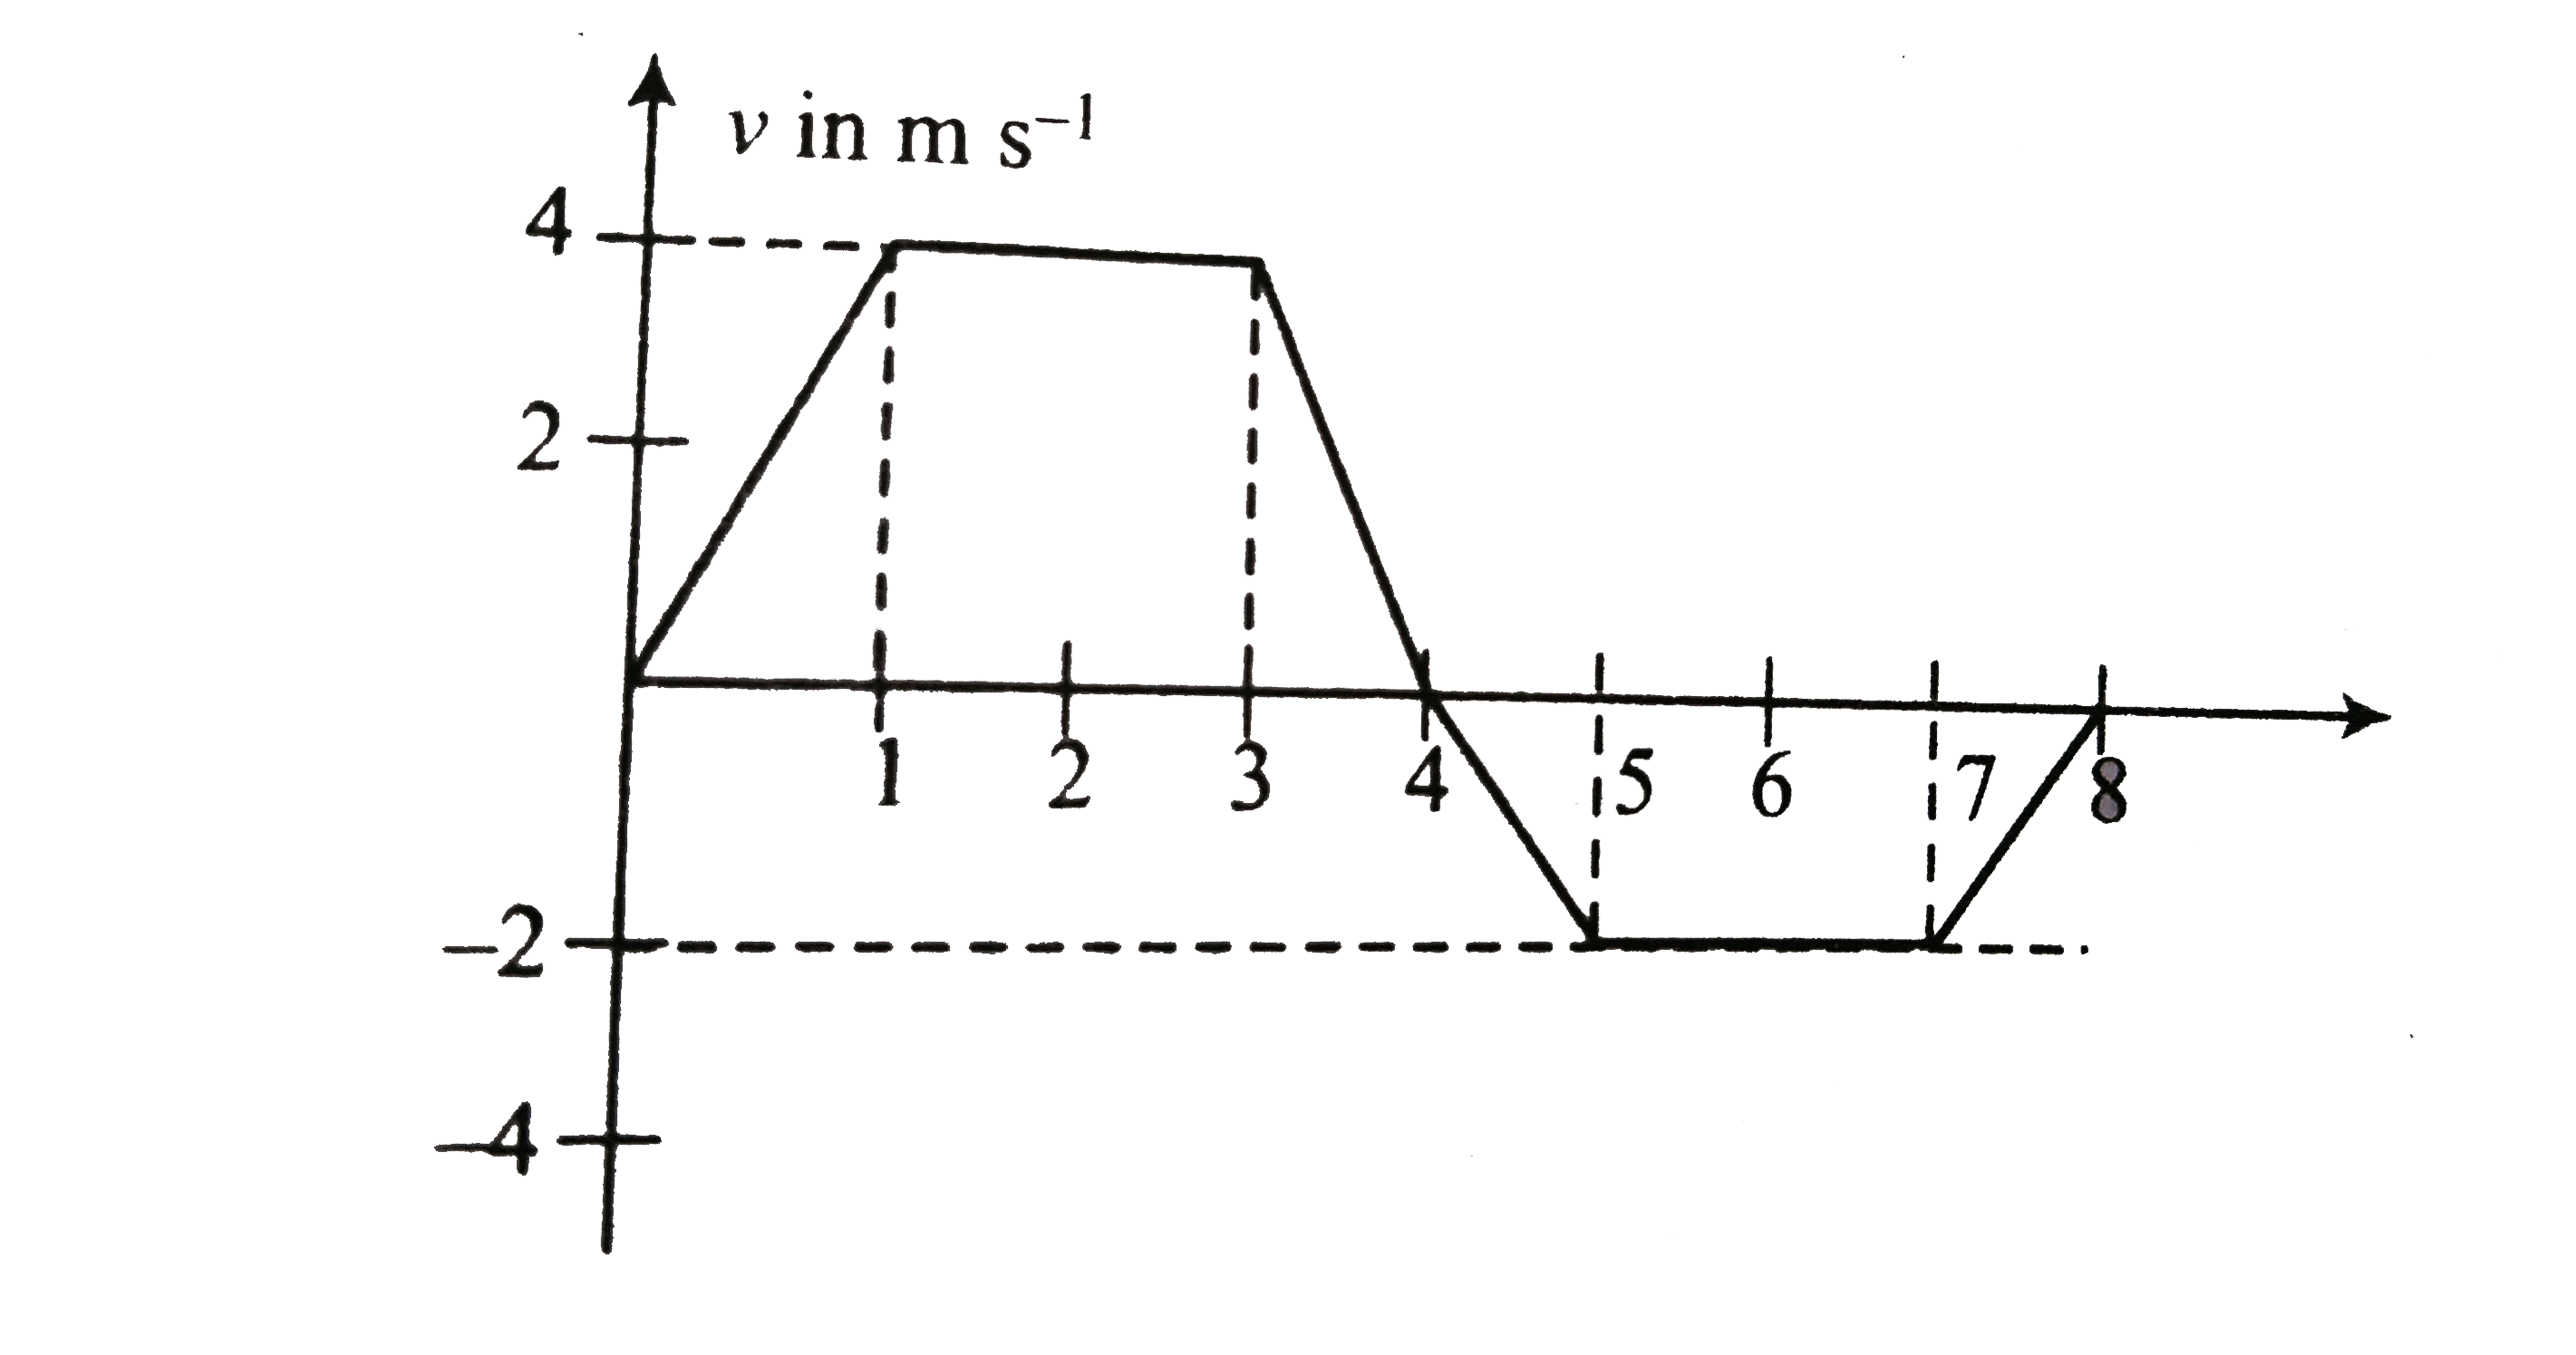
The velocity-time graph of a particle in straight line motion is veloity-time graph of a particle in straight line motion is shown in. The particle starts its motion from origin.
 .
.
The distance of the particle from the origin after 8s is .A18mB16mC8mD6m - Question 2 - Select One
Accleration vs time graph of a particle starting from rest is given. Find the displacement of particle in first 2 seconds.
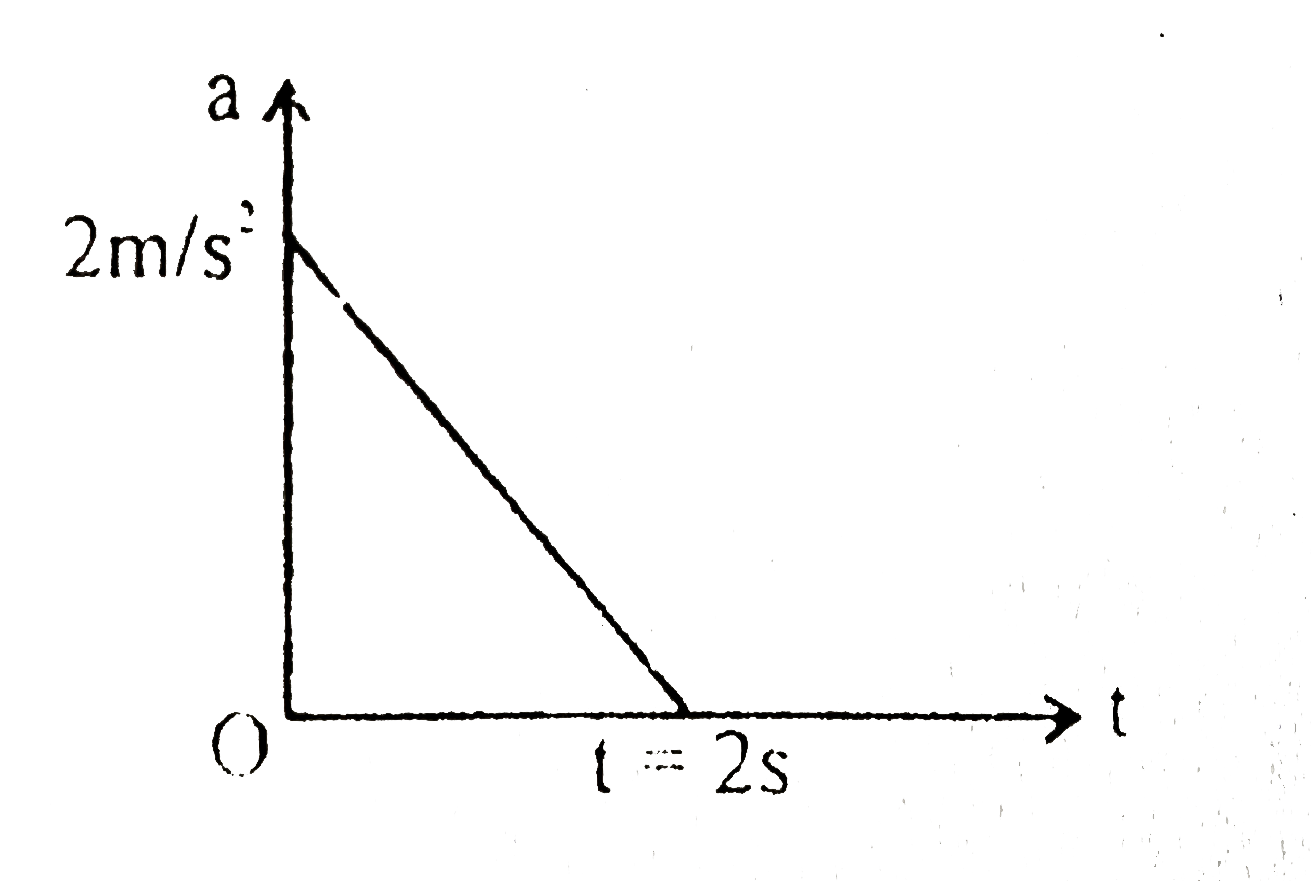 A38B83C43D316
The velocity-time graph of a particle in straight line motion is velocity-time graph of a particle in straight line motion is shown in. The particle starts its motion from origin.
 .
.
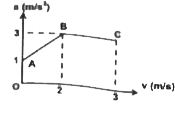
The distance of the particle from the origin after 8s is .View SolutionA particle starts its motion from the origin in positive x-direction. The given graph shows the variation of acceleration (a) with velocity (v). Plot the corresponding graph between velocity and time.
 View Solution
A particle starts its motion from the origin in positive x-direction. The given graph shows the variation of acceleration (a) with velocity (v). Plot the corresponding graph between velocity and time.
 View Solution
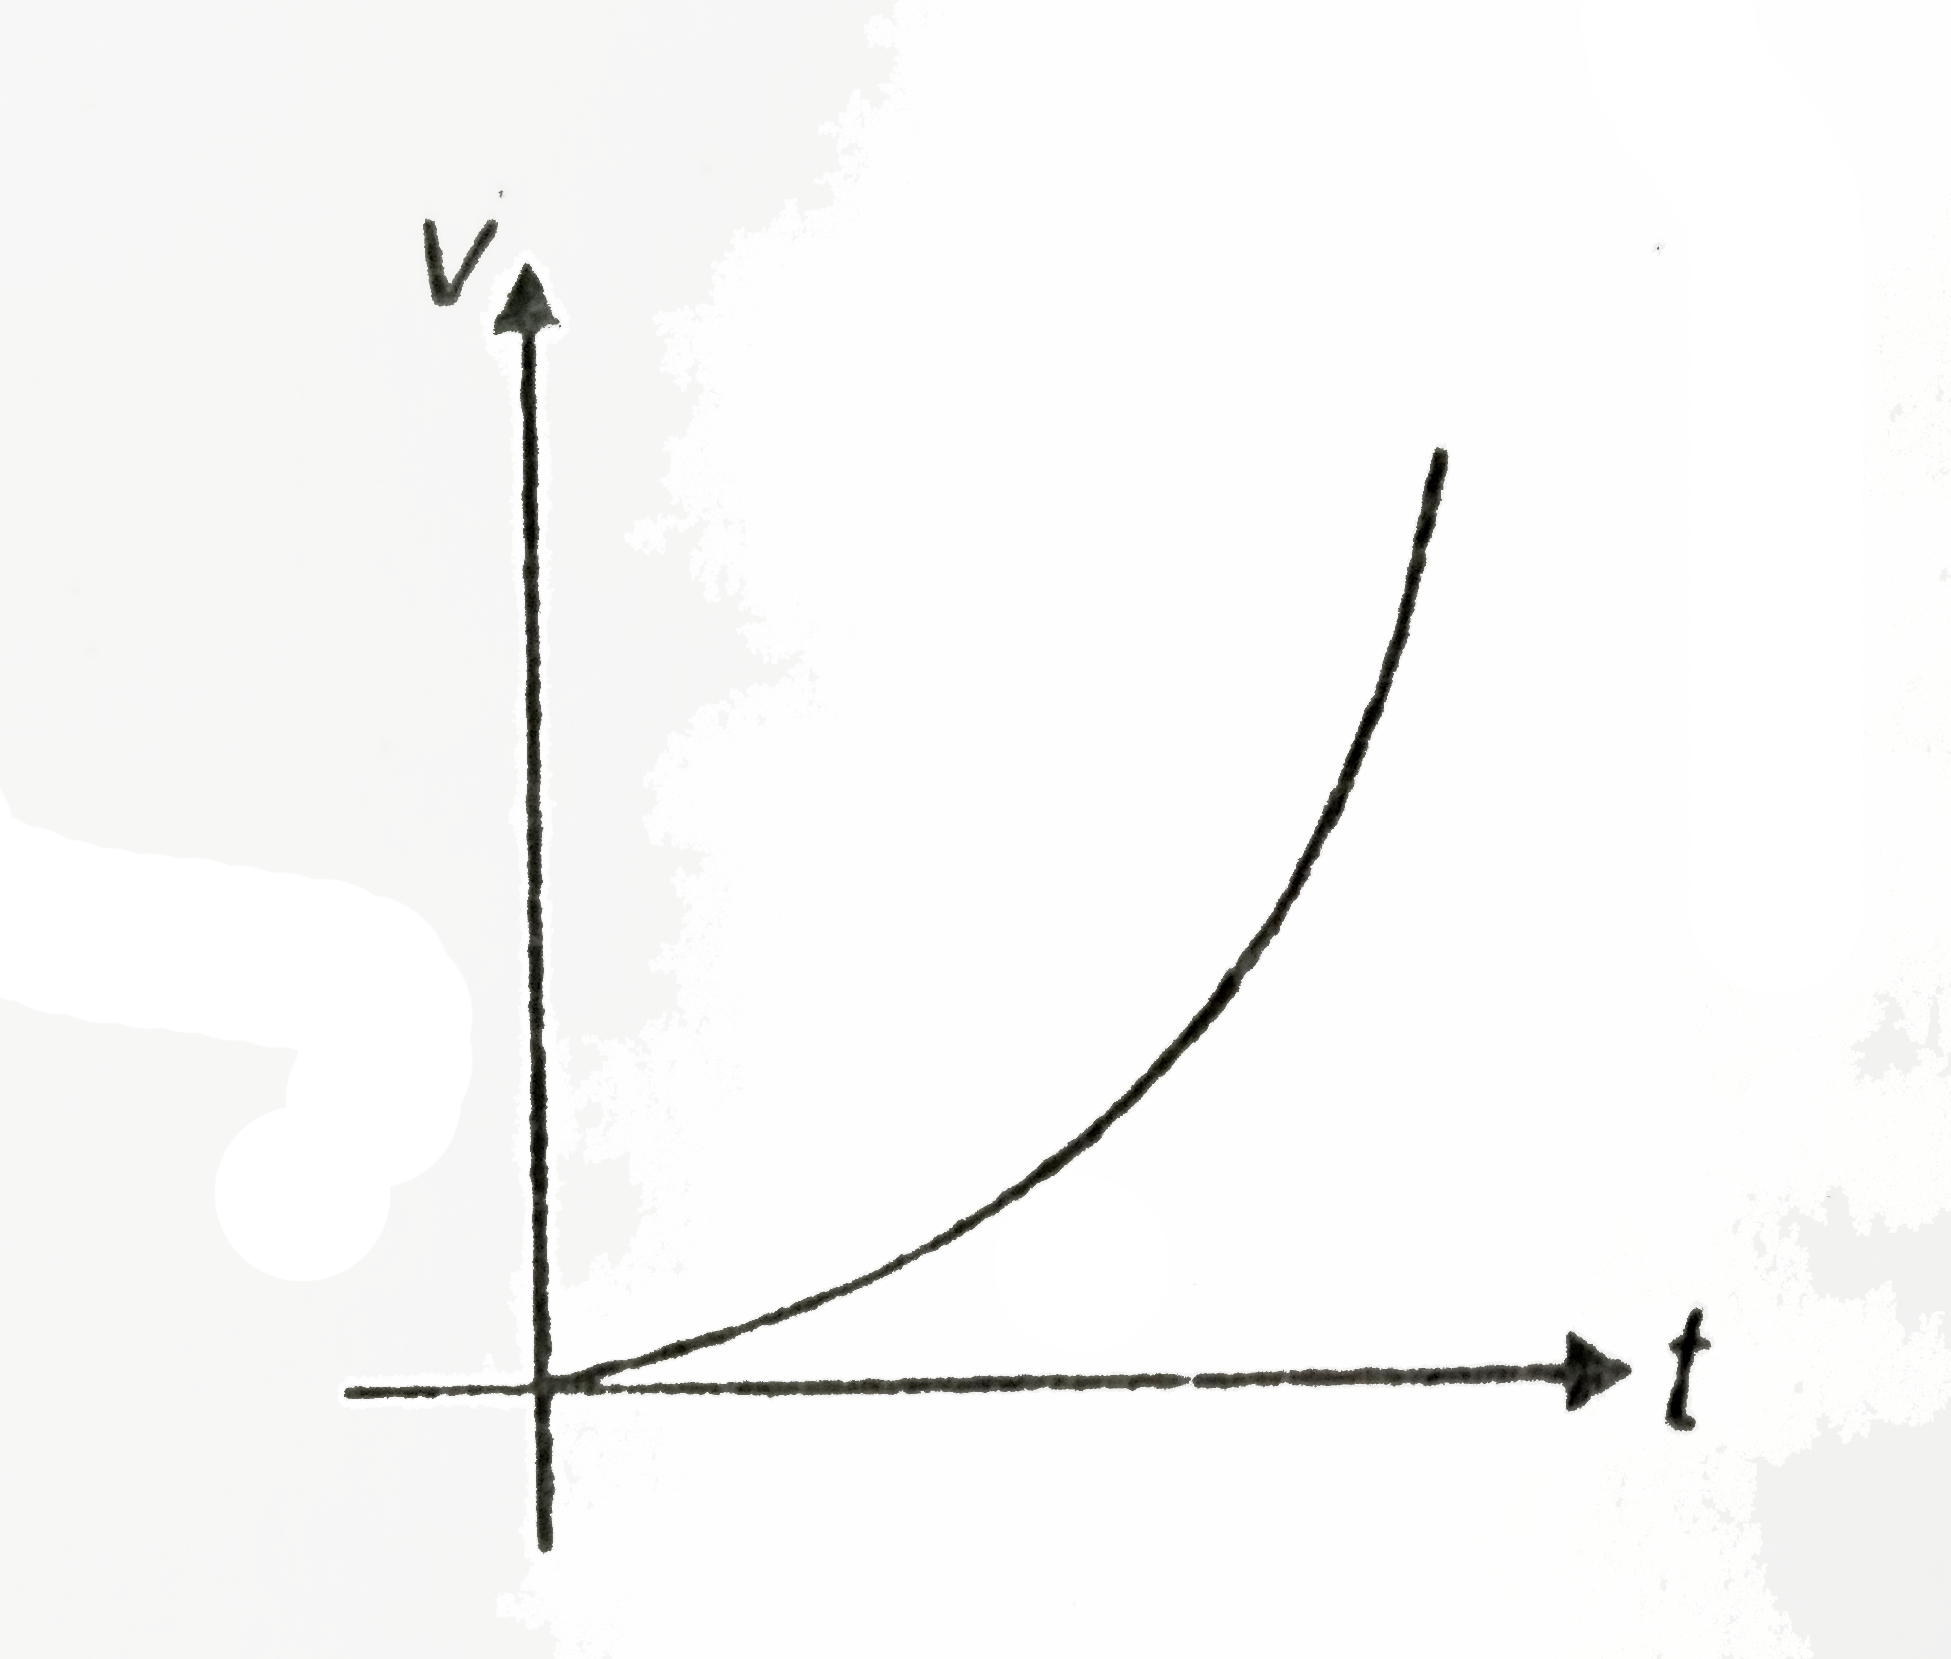
Graphs are very useful to represent a physical situation. Various quantities can be easily represented on graphs and other quantites can be determined from the graph. For example the slope of velocity-time graph represents instantaneous acceleration. For a motion with constant acceleration slope of velocity-time graph is constant. If acceleration is changing with time, slope will change and thus velocity-time graph will be a non-linear curve. Further the area of velocity-time graph gives displacement.
For the given velocity-time graph the possibly correct acceleration-time relationship is
 View Solution
Graphs are very useful to represent a physical situation. Various quantities can be easily represented on graphs and other quantites can be determined from the graph. For example the slope of velocity-time graph represents instantaneous acceleration. For a motion with constant acceleration slope of velocity-time graph is constant. If acceleration is changing with time, slope with change and thus velocity-time graph will be a non-linear curve. Further the area of velocity-time graph gives displacement.
For the given velocity-time graph the possibly correct acceleration-time relationship is
 View Solution
A particle starts from rest at t=0 and undergoes an acceleration as shown in figure.
Draw the displacement-time graph of the motion of the particle during the same time interval. In both the above cases, explain the various steps.
 View Solution


