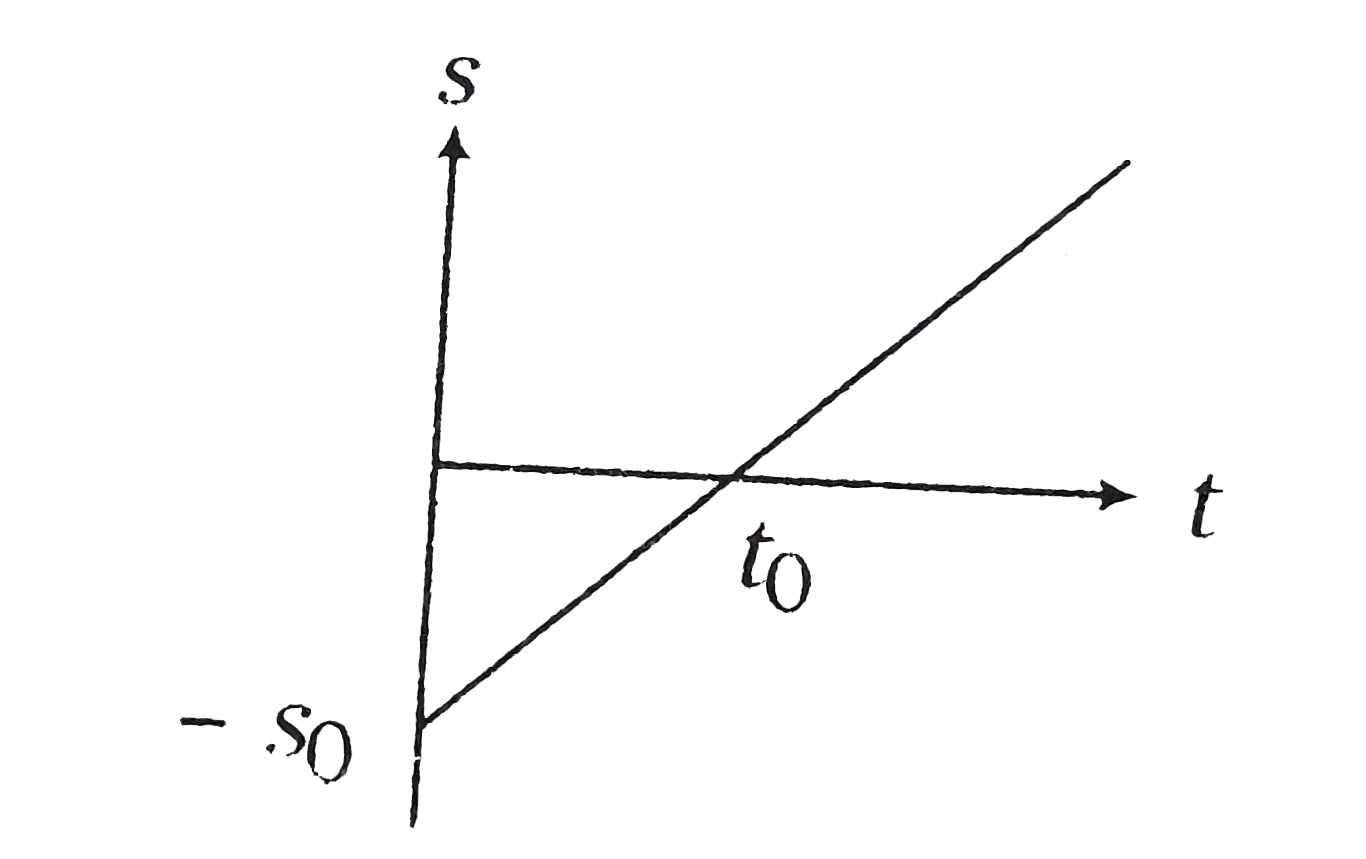
Displacement - time graph of particle moving in a straight line is as shown in figure. State whether the motion is accelerated or not. Describe the motion in detail. Given,
s0=20m and t0=4s.
Video Solution
Text Solution
Slope of s-t graph is constant. Hence, velocity of particle is constant. Further at time t = 0, displacement of the particle from the mean position is s0 or −20m . Velocity of particle,
v = slope
=s0t0=204=5ms−1

Motion of the particle is as shown in figure. At t = 0, particle is at −20m and constant velocity of 5ms−1. At t0=4s, particle will pass through its mean position.
|
Topper's Solved these Questions
- MOTION IN A PLANEBOOK - DC PANDEYCHAPTER - MOTION IN A PLANEEXERCISE - Check point 3.1
10 Videos
- MOTION IN A PLANEBOOK - DC PANDEYCHAPTER - MOTION IN A PLANEEXERCISE - Check point 3.2
10 Videos
- MOTIONBOOK - DC PANDEYCHAPTER - MOTIONEXERCISE - Medical entrances gallery
19 Videos
- PROJECTILE MOTIONBOOK - DC PANDEYCHAPTER - PROJECTILE MOTIONEXERCISE - Level - 2 Subjective
10 Videos
Similar Questions
Knowledge Check
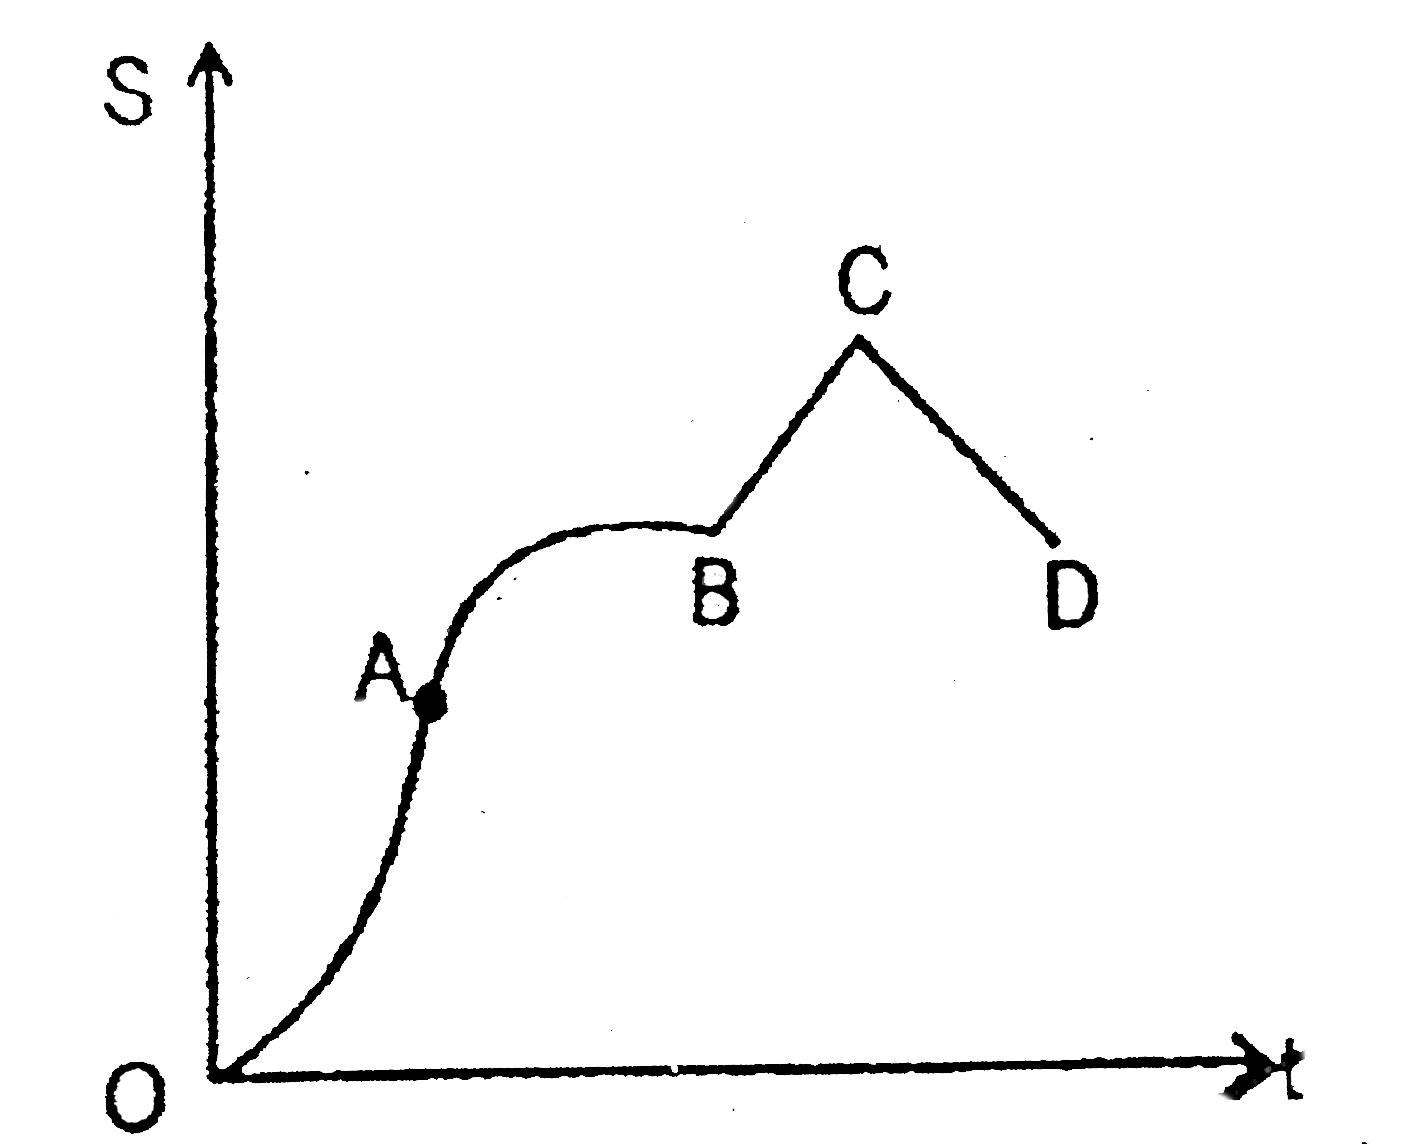
Displacement time graph of a particle moving in a straight line is a shown in figure.
 Ain region A acceleration is positiveBin region B acceleration is negativeCin region C acceleration is positiveDin region D acceleration is negative
Velocity displacement graph of a particle moving in a straight line is as shown in figure.
 Amagnitude of acceleration of particle is decreasingBmagnitude of acceleration of particlre is increasingCacceleration versus displacement graph straight lineDacceleration versus displacement graph is parabola
Displacement time graph of a particle moving in a straight line is as shown in figure. Select the correct alternative (s) :
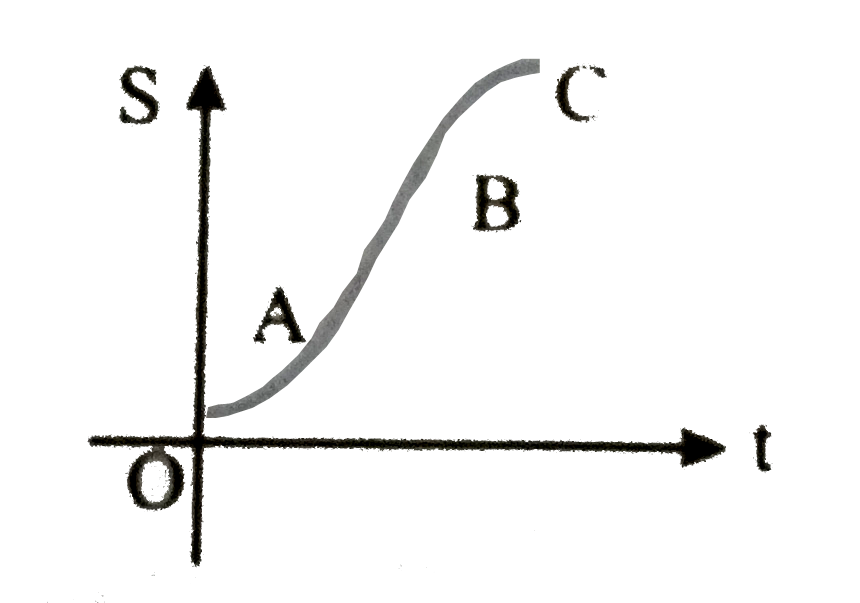 .AWork done by all the forces in region OA and BC is positiveBWork done by all the forces in region AB is zeroCWork done by the forces in region BC is negativeDWork done by all the forces in region OA is negative.
Displacement-time graph of a particle moving in a straight line is as shown in figure.
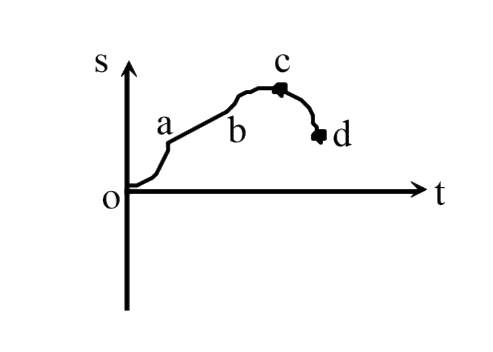
Q. Find the sign of acceleration in the above region
View Solution
The velocity displacement graph of a particle moving along a straight line is shown in figure.
Then the acceleration displacement graph is.
View SolutionVelocity versus displacement graph of a particle moving in a straight line as shown in figure.
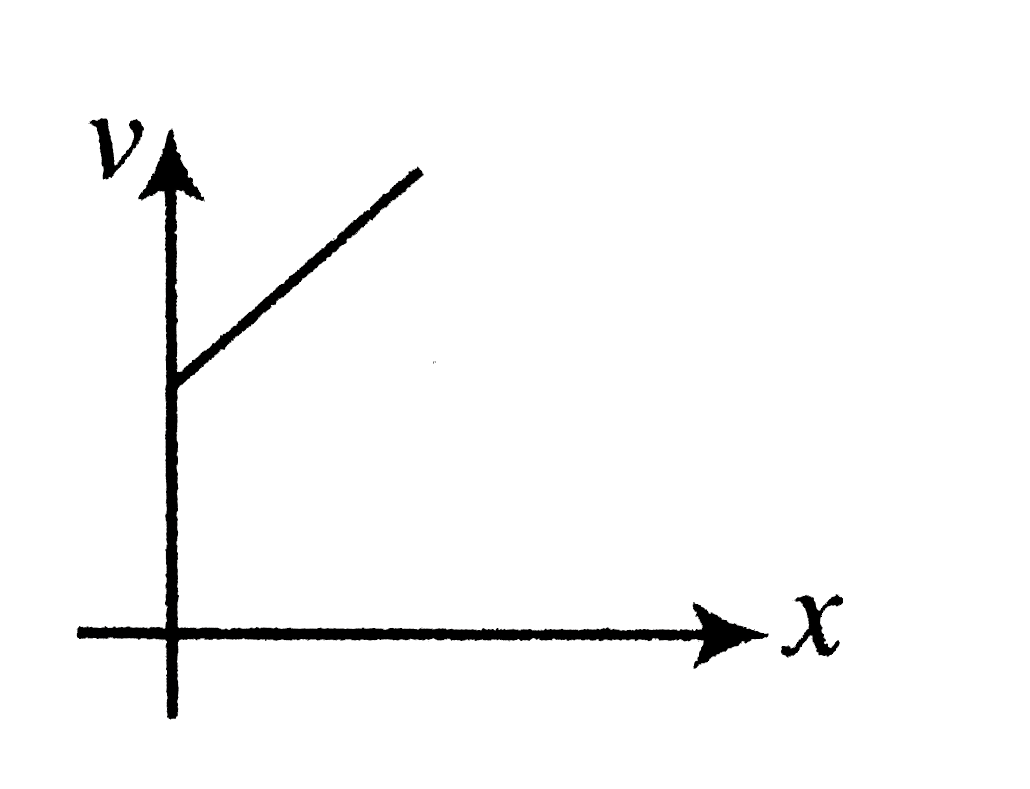
The acceleration of the particle.
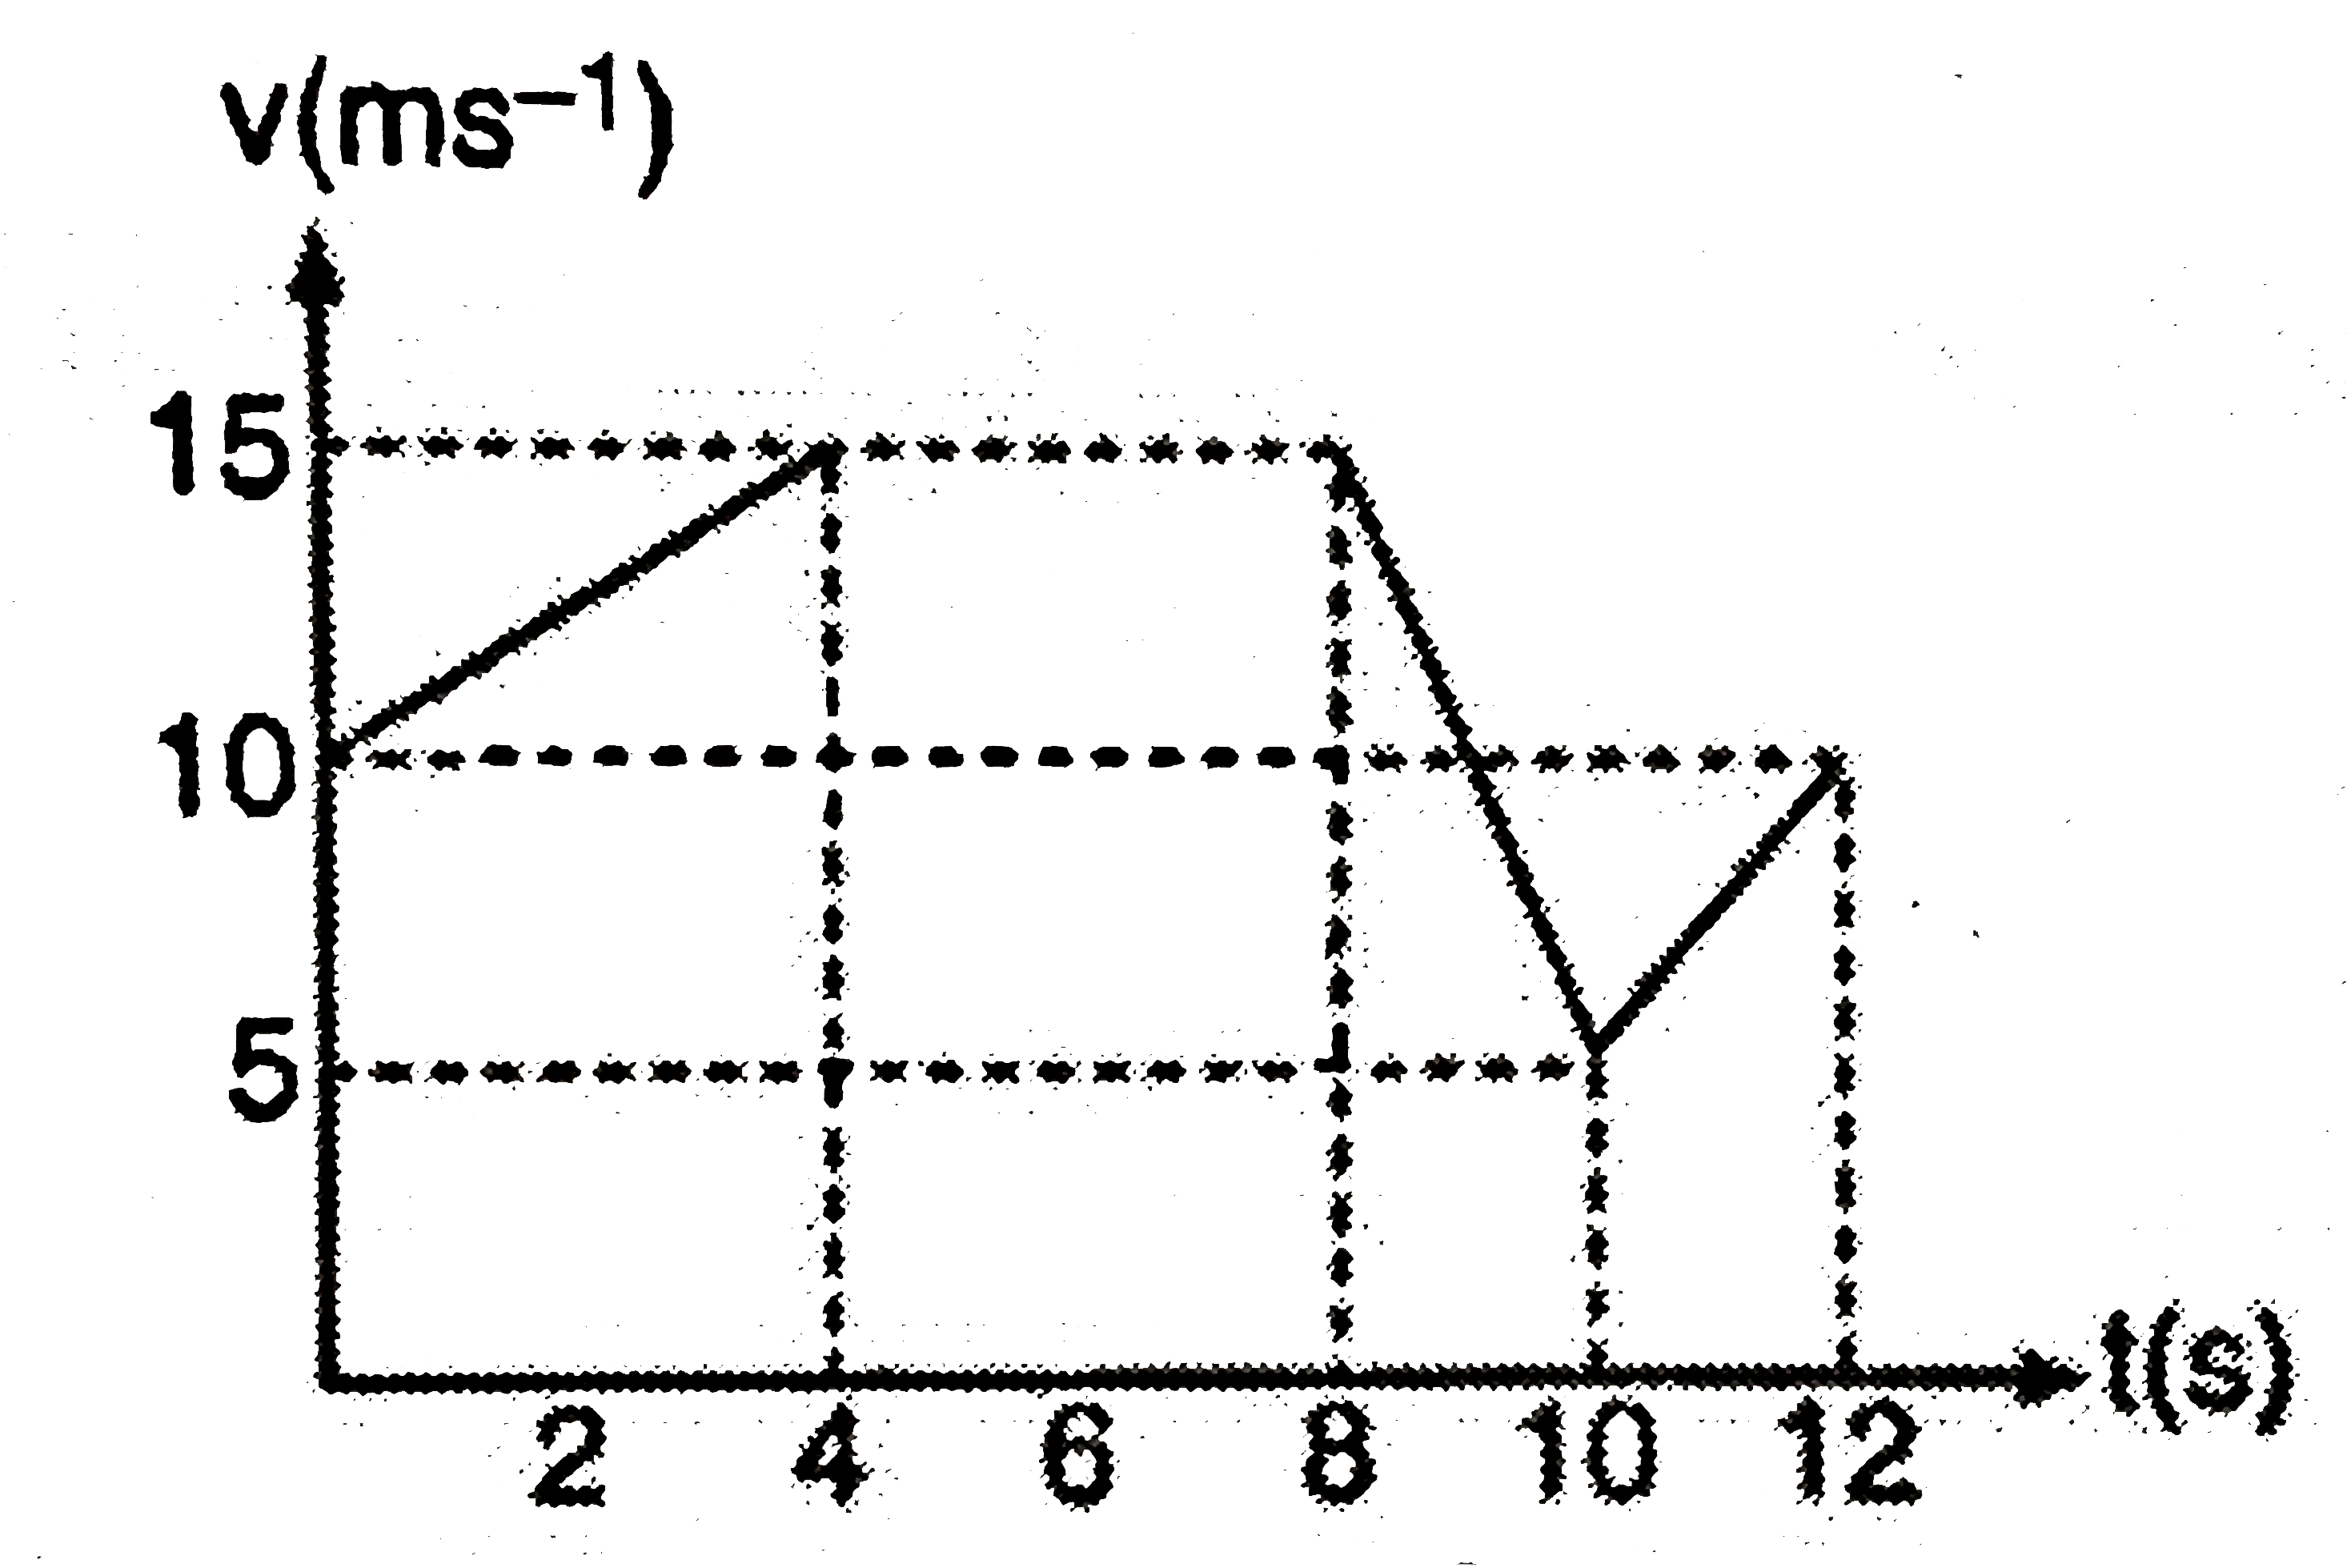
View SolutionThe velocity -time (v−t) graph of a particle moving in a straight line is shown in figure. The acceleration of the particle at t=9 is:
View SolutionThe x-t graph of a particle moving along a straight line is shown in figure
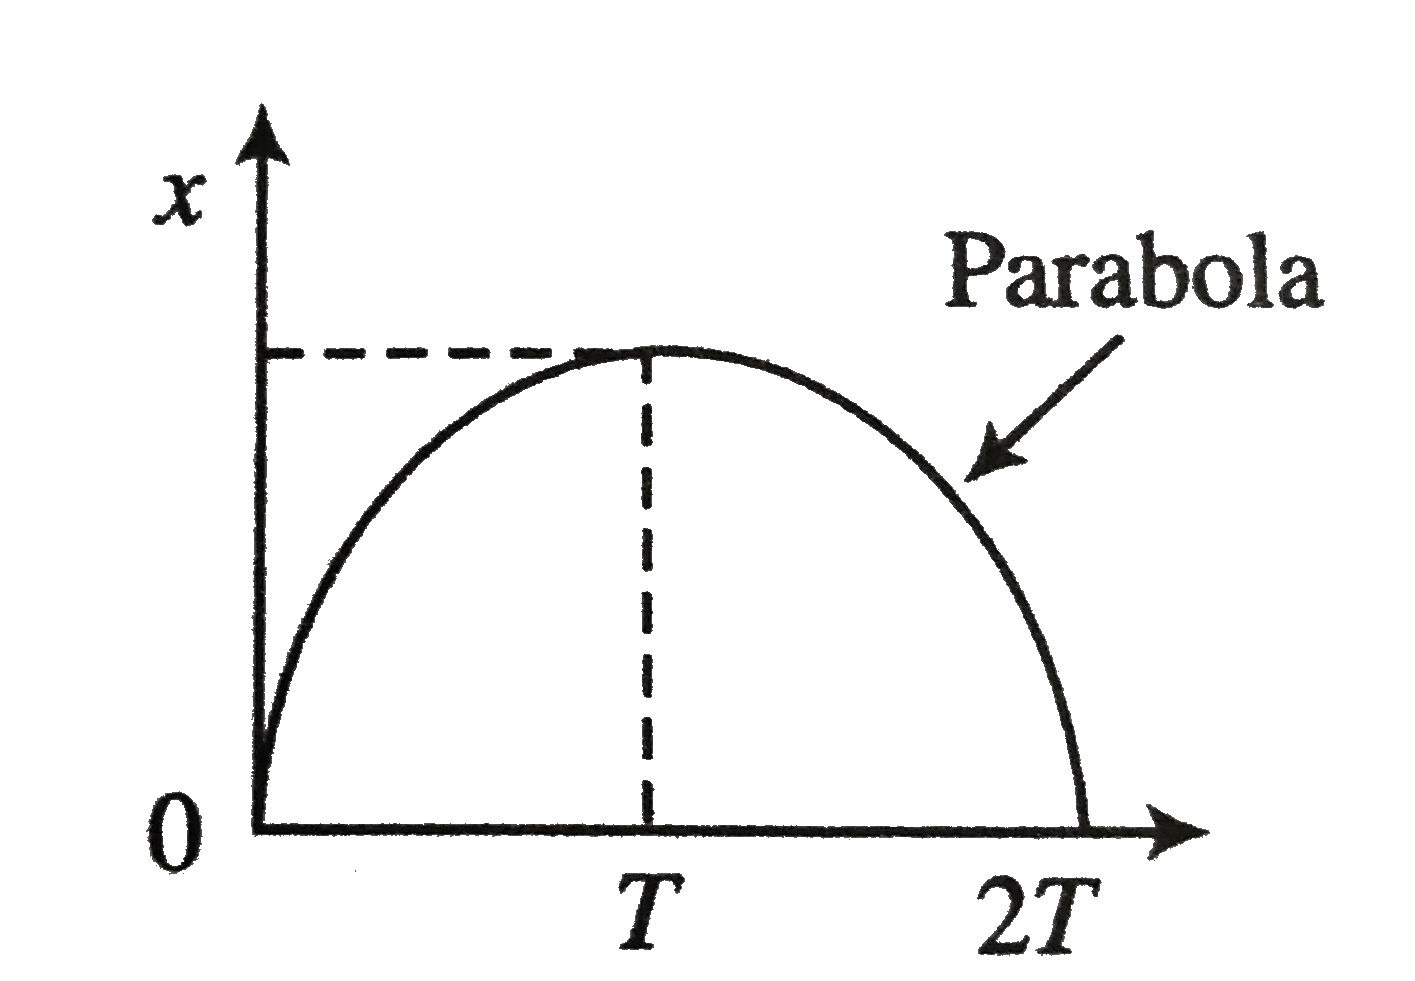
The speed-time graph of the particle is correctly shown by
View Solution

