Draw diagrams to show the loop formation in a vibrating tuning fork.
To illustrate the loop formation in a vibrating tuning fork, we will follow a systematic approach to draw the necessary diagrams. Here’s a step-by-step solution:
Step 1: Draw the Tuning Fork
1. Start by sketching the basic shape of the tuning fork. Draw two prongs (the vibrating arms) extending from a handle.
2. Label the handle and the two prongs as Fork A and Fork B.
Step 2: Indicate the Vibrating Positions
1. Draw three positions of the tuning fork to represent its vibration:
- Position 1 (Maximum Compression): Draw the prongs pushed outward to show maximum displacement. This represents the point where the prongs are at their outermost position, compressing the air around them.
- Position 2 (Equilibrium Position): Draw the prongs parallel to each other, indicating that they are at rest and not compressing or rarefying the air.
- Position 3 (Maximum Rarefaction): Draw the prongs pulled inward, showing that they are at their innermost position, creating a low-pressure region as they suck in air.
Step 3: Label the Pressure Regions
1. For each position, label the pressure regions:
- In Position 1, label it as "High Pressure Region" (indicating compression).
- In Position 2, label it as "Normal Pressure" (indicating equilibrium).
- In Position 3, label it as "Low Pressure Region" (indicating rarefaction).
Step 4: Combine the Diagrams
1. Arrange the three positions in a sequence to show the continuous motion of the tuning fork. You can use arrows to indicate the direction of movement from one position to the next.
Step 5: Draw the Sinusoidal Wave Representation
1. Below the tuning fork diagrams, draw a sinusoidal wave to represent the sound wave produced by the vibrating fork.
2. Label the crest of the wave as "High Pressure" and the trough as "Low Pressure." The midpoint of the wave should be labeled as "Normal Pressure."
Final Diagram
1. Combine all the elements into a single diagram, showing the tuning fork in three positions and the corresponding sinusoidal wave below it.
Summary
The final diagram will illustrate how the tuning fork's vibrations create alternating high and low-pressure regions in the air, resulting in sound waves.
---
1. Start by sketching the basic shape of the tuning fork. Draw two prongs (the vibrating arms) extending from a handle.
2. Label the handle and the two prongs as Fork A and Fork B.
1. Draw three positions of the tuning fork to represent its vibration:
- Position 1 (Maximum Compression): Draw the prongs pushed outward to show maximum displacement. This represents the point where the prongs are at their outermost position, compressing the air around them.
- Position 2 (Equilibrium Position): Draw the prongs parallel to each other, indicating that they are at rest and not compressing or rarefying the air.
- Position 3 (Maximum Rarefaction): Draw the prongs pulled inward, showing that they are at their innermost position, creating a low-pressure region as they suck in air.
1. For each position, label the pressure regions:
- In Position 1, label it as "High Pressure Region" (indicating compression).
- In Position 2, label it as "Normal Pressure" (indicating equilibrium).
- In Position 3, label it as "Low Pressure Region" (indicating rarefaction).
1. Arrange the three positions in a sequence to show the continuous motion of the tuning fork. You can use arrows to indicate the direction of movement from one position to the next.
1. Below the tuning fork diagrams, draw a sinusoidal wave to represent the sound wave produced by the vibrating fork.
2. Label the crest of the wave as "High Pressure" and the trough as "Low Pressure." The midpoint of the wave should be labeled as "Normal Pressure."
1. Combine all the elements into a single diagram, showing the tuning fork in three positions and the corresponding sinusoidal wave below it.
The final diagram will illustrate how the tuning fork's vibrations create alternating high and low-pressure regions in the air, resulting in sound waves.
Topper's Solved these Questions
- WAVESBOOK - ICSECHAPTER - WAVESEXERCISE - Doppler Effect, Musical, Sound, Noise
26 Videos
- WAVESBOOK - ICSECHAPTER - WAVESEXERCISE - Very Short Answer Questions
14 Videos
- WAVESBOOK - ICSECHAPTER - WAVESEXERCISE - Short Answer Questions.
32 Videos
- VECTORS SCALARS ELEMENTARY CALCULUS BOOK - ICSECHAPTER - VECTORS SCALARS ELEMENTARY CALCULUS EXERCISE - UNSOLVED PROBLEMS
79 Videos
Similar Questions
Draw diagrams to show the formation of beats?
View SolutionA vibrating toning fork is held at the mouth of (i) a closed pipe and (ii) an open pipe. Draw diagrams to show the formation of various modes. Obtain the frequency of the fundamental mode and
(ii) higher harmonics, in each case.
View SolutionWhat is a rainbow? Draw a labelled diagram to show the formation of a rainbow.
View Solution(a) Draw diagrams to show the longitudinal mode of vibration and transverse mode of vibration of an electrically maintained tuning fork in the Melde's experiment.
(b) Indicate with the help of a diagram the positions of nodes and antinodes on a vibrating tuning fork.
View SolutionDraw diagrams to show the various modes of vibration in (i) an open pipe and (ii) a closed pipe.
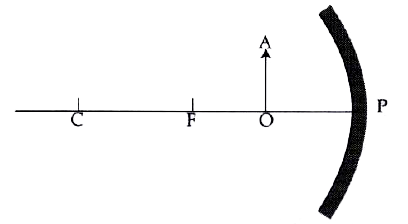
View SolutionFig. shows a concave mirror with its pole at P, focus F and centre of curvature C. Draw ray diagram to show the formation of image of an object OA.

View Solution
Draw a ray diagram to show the formation of the image as specified in the part a.
View SolutionDraw a labelled ray diagram showing the formation of an image by a refracting telescope when the final image lies at infinity..
View SolutionDraw a diagram to show the various modes of vibration of a stretched string.
View SolutionDraw a simple ray diagram showing the formation of a primary rainbow.
View Solution
