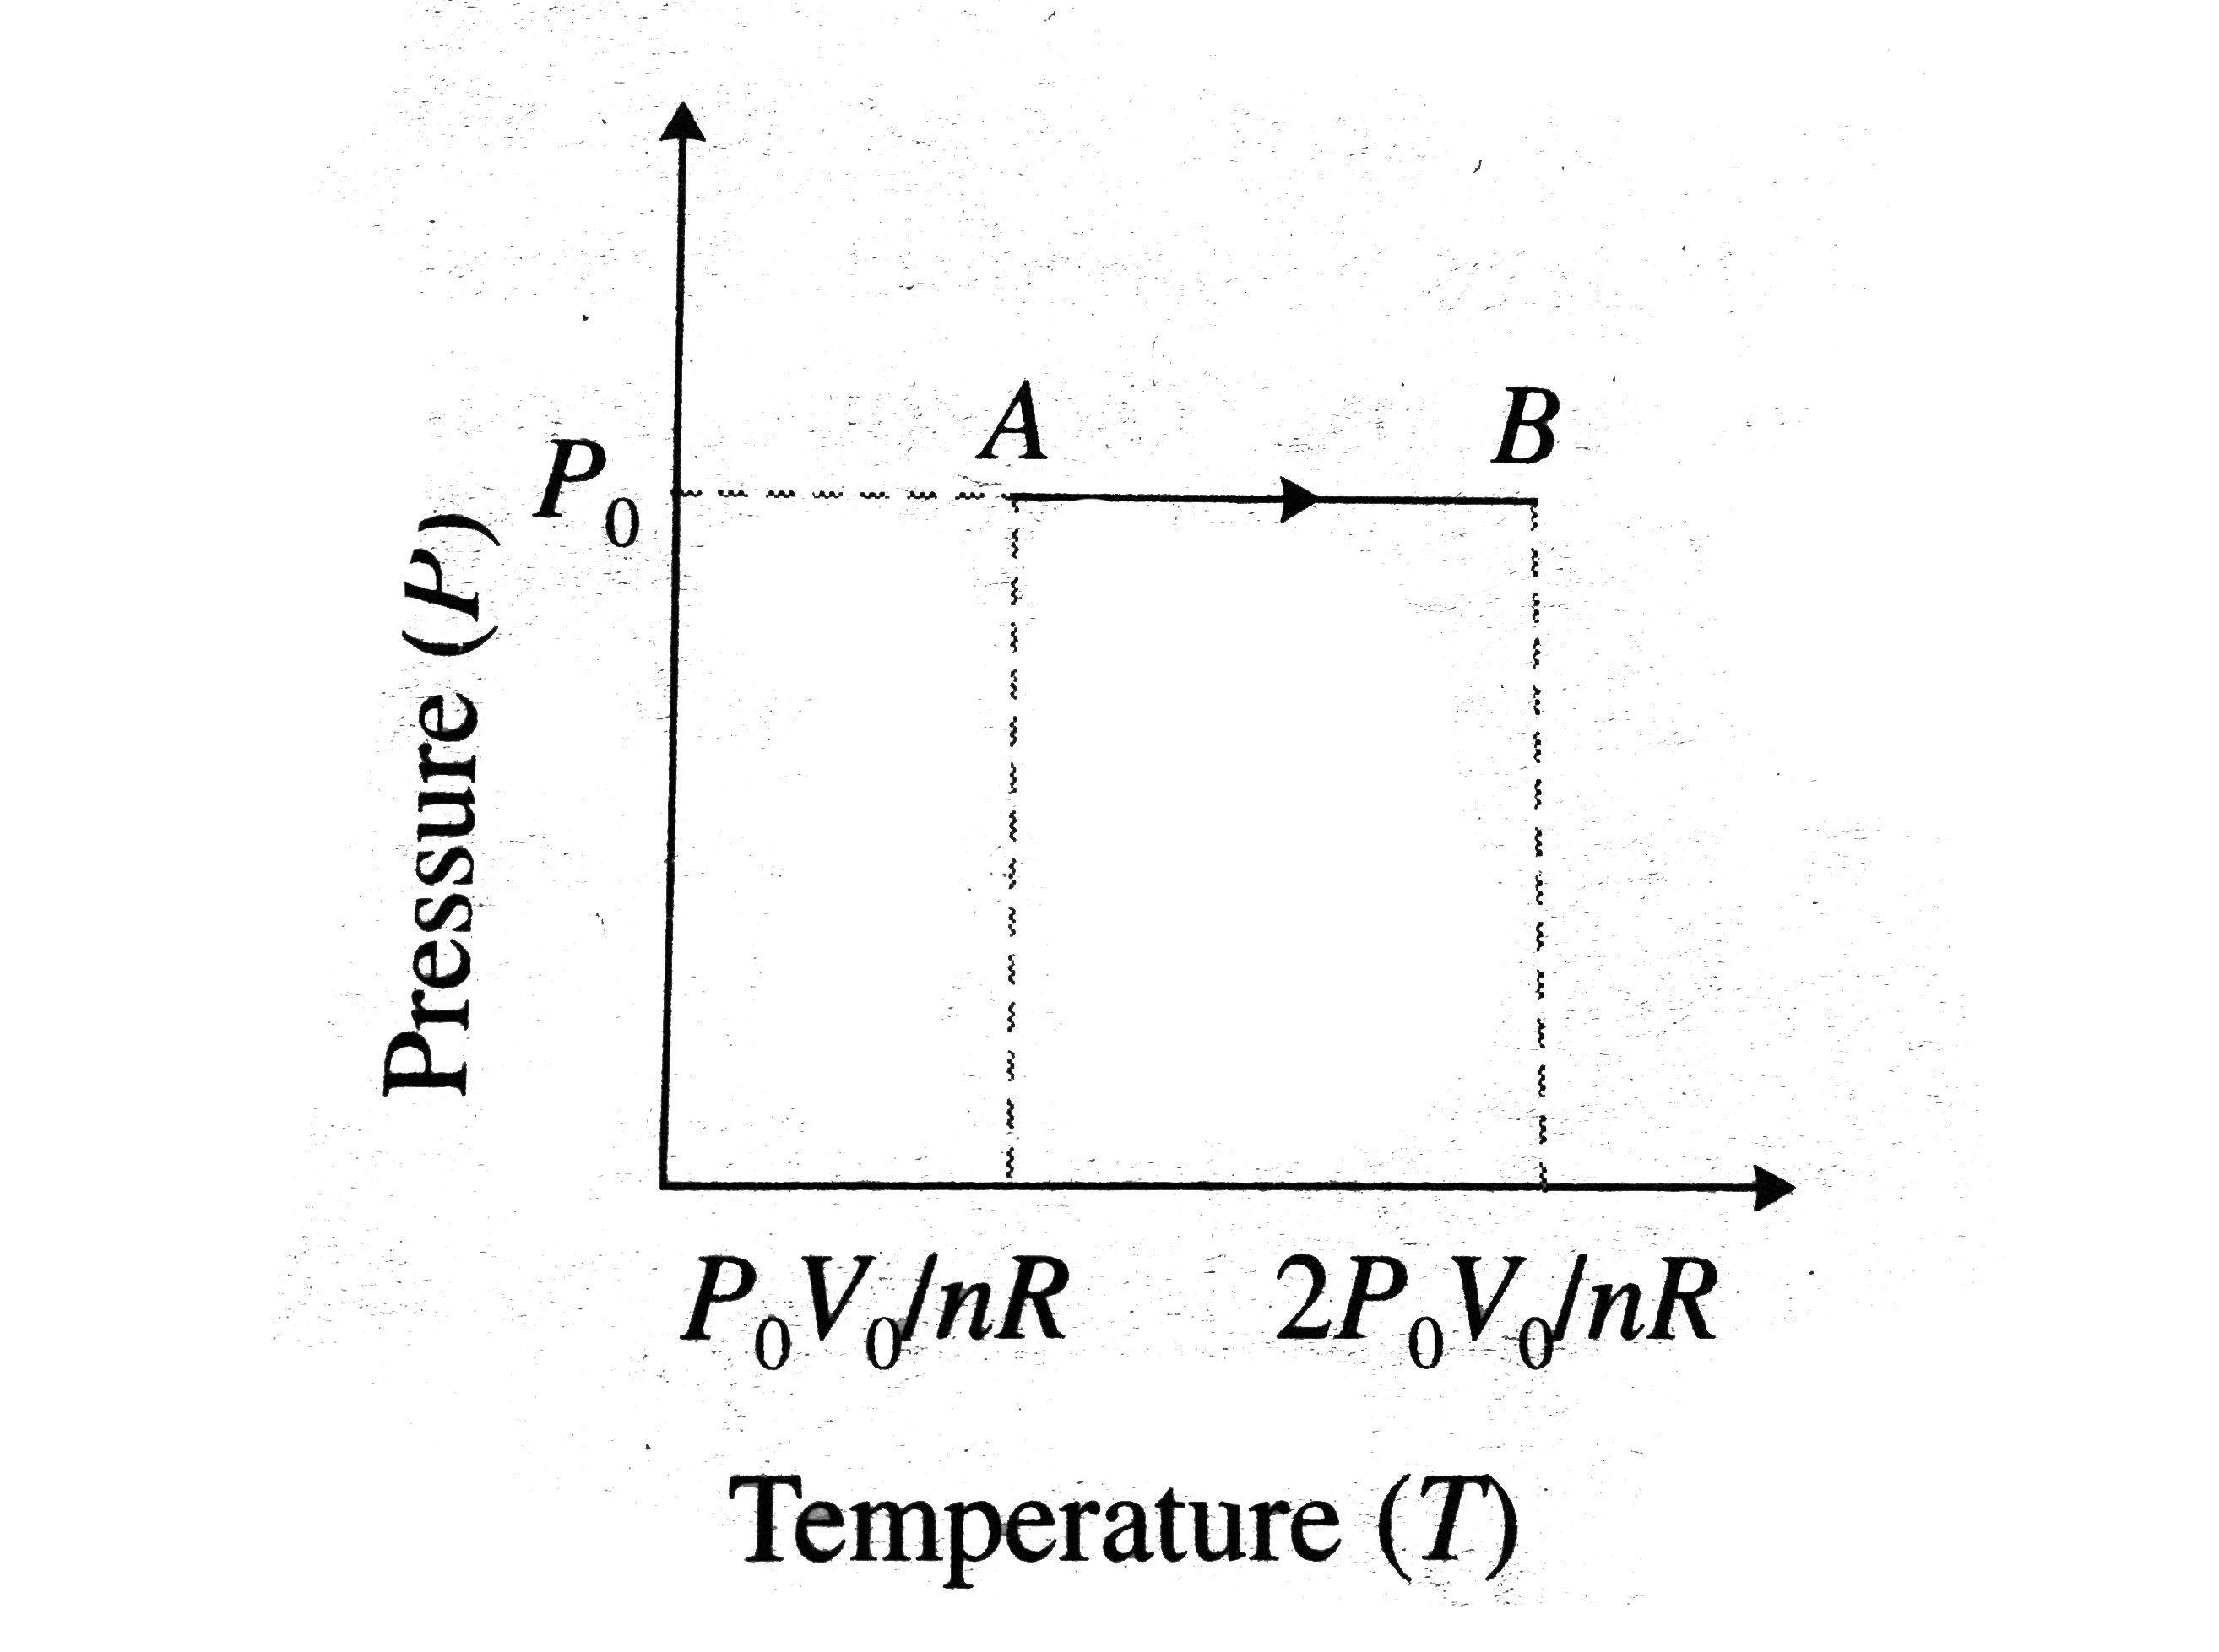
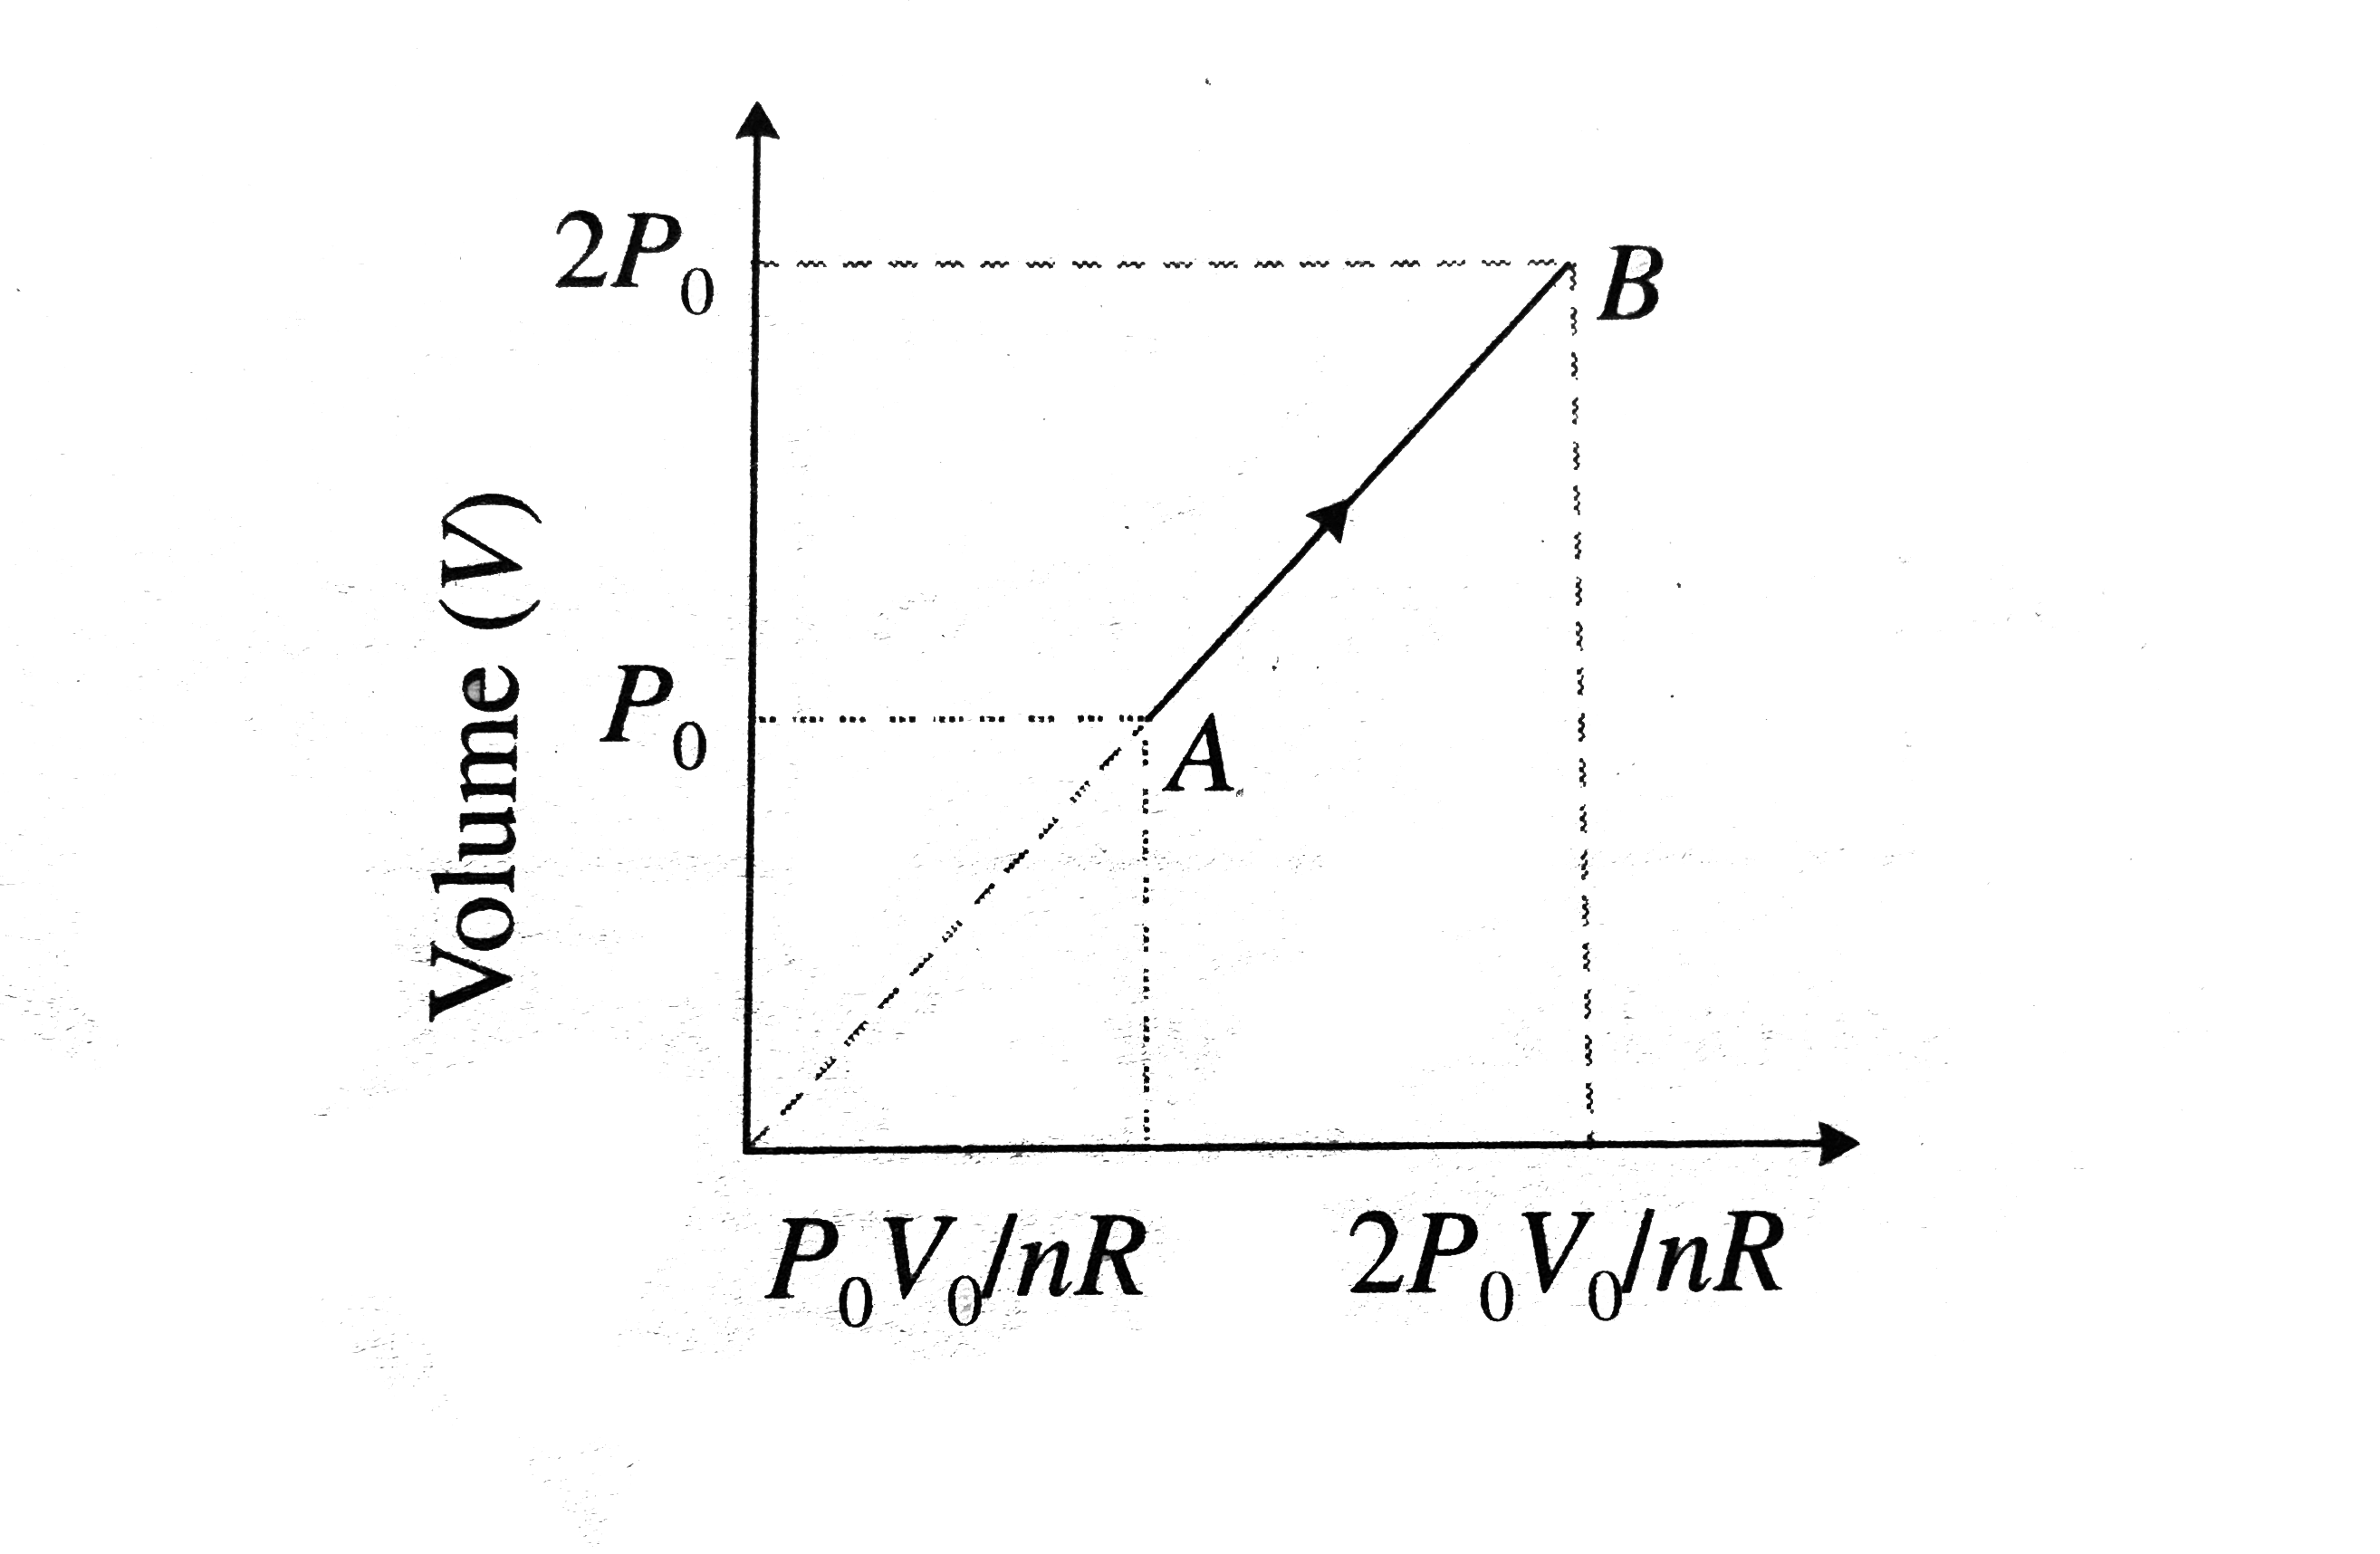
Draw the P-T and V-T diagrams for an isobaric process of expansion, corresponding to n moles of an ideal gas at pressure P0 from V0 to 2V0
From the equation state for an ideal gas PV = nRT,
We have V=(nR/P0)T or V∝T
At V=V0 we get T1=P0V0nR
And at V=2V0, we get
T2=2P0V0nR
For the graph of P versus T the variation is a straight line normal to the pressure axis, the temperatur varies from T1 to T2 as shown in the Fig.
For the graph of V versus T, the equation V=(nR/P0)T or V = kT shows that the volume varies directly with the temperature (Charlie's law). So, the graph is a straight line inclined to the (V - T) axes, and passes through the origin (when produced) as shown Fig.
Topper's Solved these Questions
- BOOK - CENGAGE PHYSICSCHAPTER - KINETIC THEORY OF GASES AND FIRST LAW OF THERMODYNAMICSEXERCISE - Solved Examples14videos
KINETIC THEORY OF GASES AND FIRST LAW OF THERMODYNAMICS
- BOOK - CENGAGE PHYSICSCHAPTER - KINETIC THEORY OF GASES AND FIRST LAW OF THERMODYNAMICSEXERCISE - Exercise 2.120videos
KINETIC THEORY OF GASES AND FIRST LAW OF THERMODYNAMICS
- BOOK - CENGAGE PHYSICSCHAPTER - KINETIC THEORY OF GASESEXERCISE - Compression2videos
KINETIC THEORY OF GASES
- BOOK - CENGAGE PHYSICSCHAPTER - LINEAR AND ANGULAR SIMPLE HARMONIC MOTIONEXERCISE - Multiple Correct Answer Type9videos
LINEAR AND ANGULAR SIMPLE HARMONIC MOTION
Similar Questions
Draw the P-T and V-T diagrams for an isobaric process of expansion, corresponding to n moles of an ideal gas at pressure P0 from V0 to 2V0
View SolutionDraw the P-T and V-T diagrams of an isochoric process of n moles an ideal gas from pressure P0 volume V0 to pressure 4P0, indicating the pressures and temperatures of the gas in the initial and the final states.
View Solution
Knowledge Check
- Question 1 - Select One
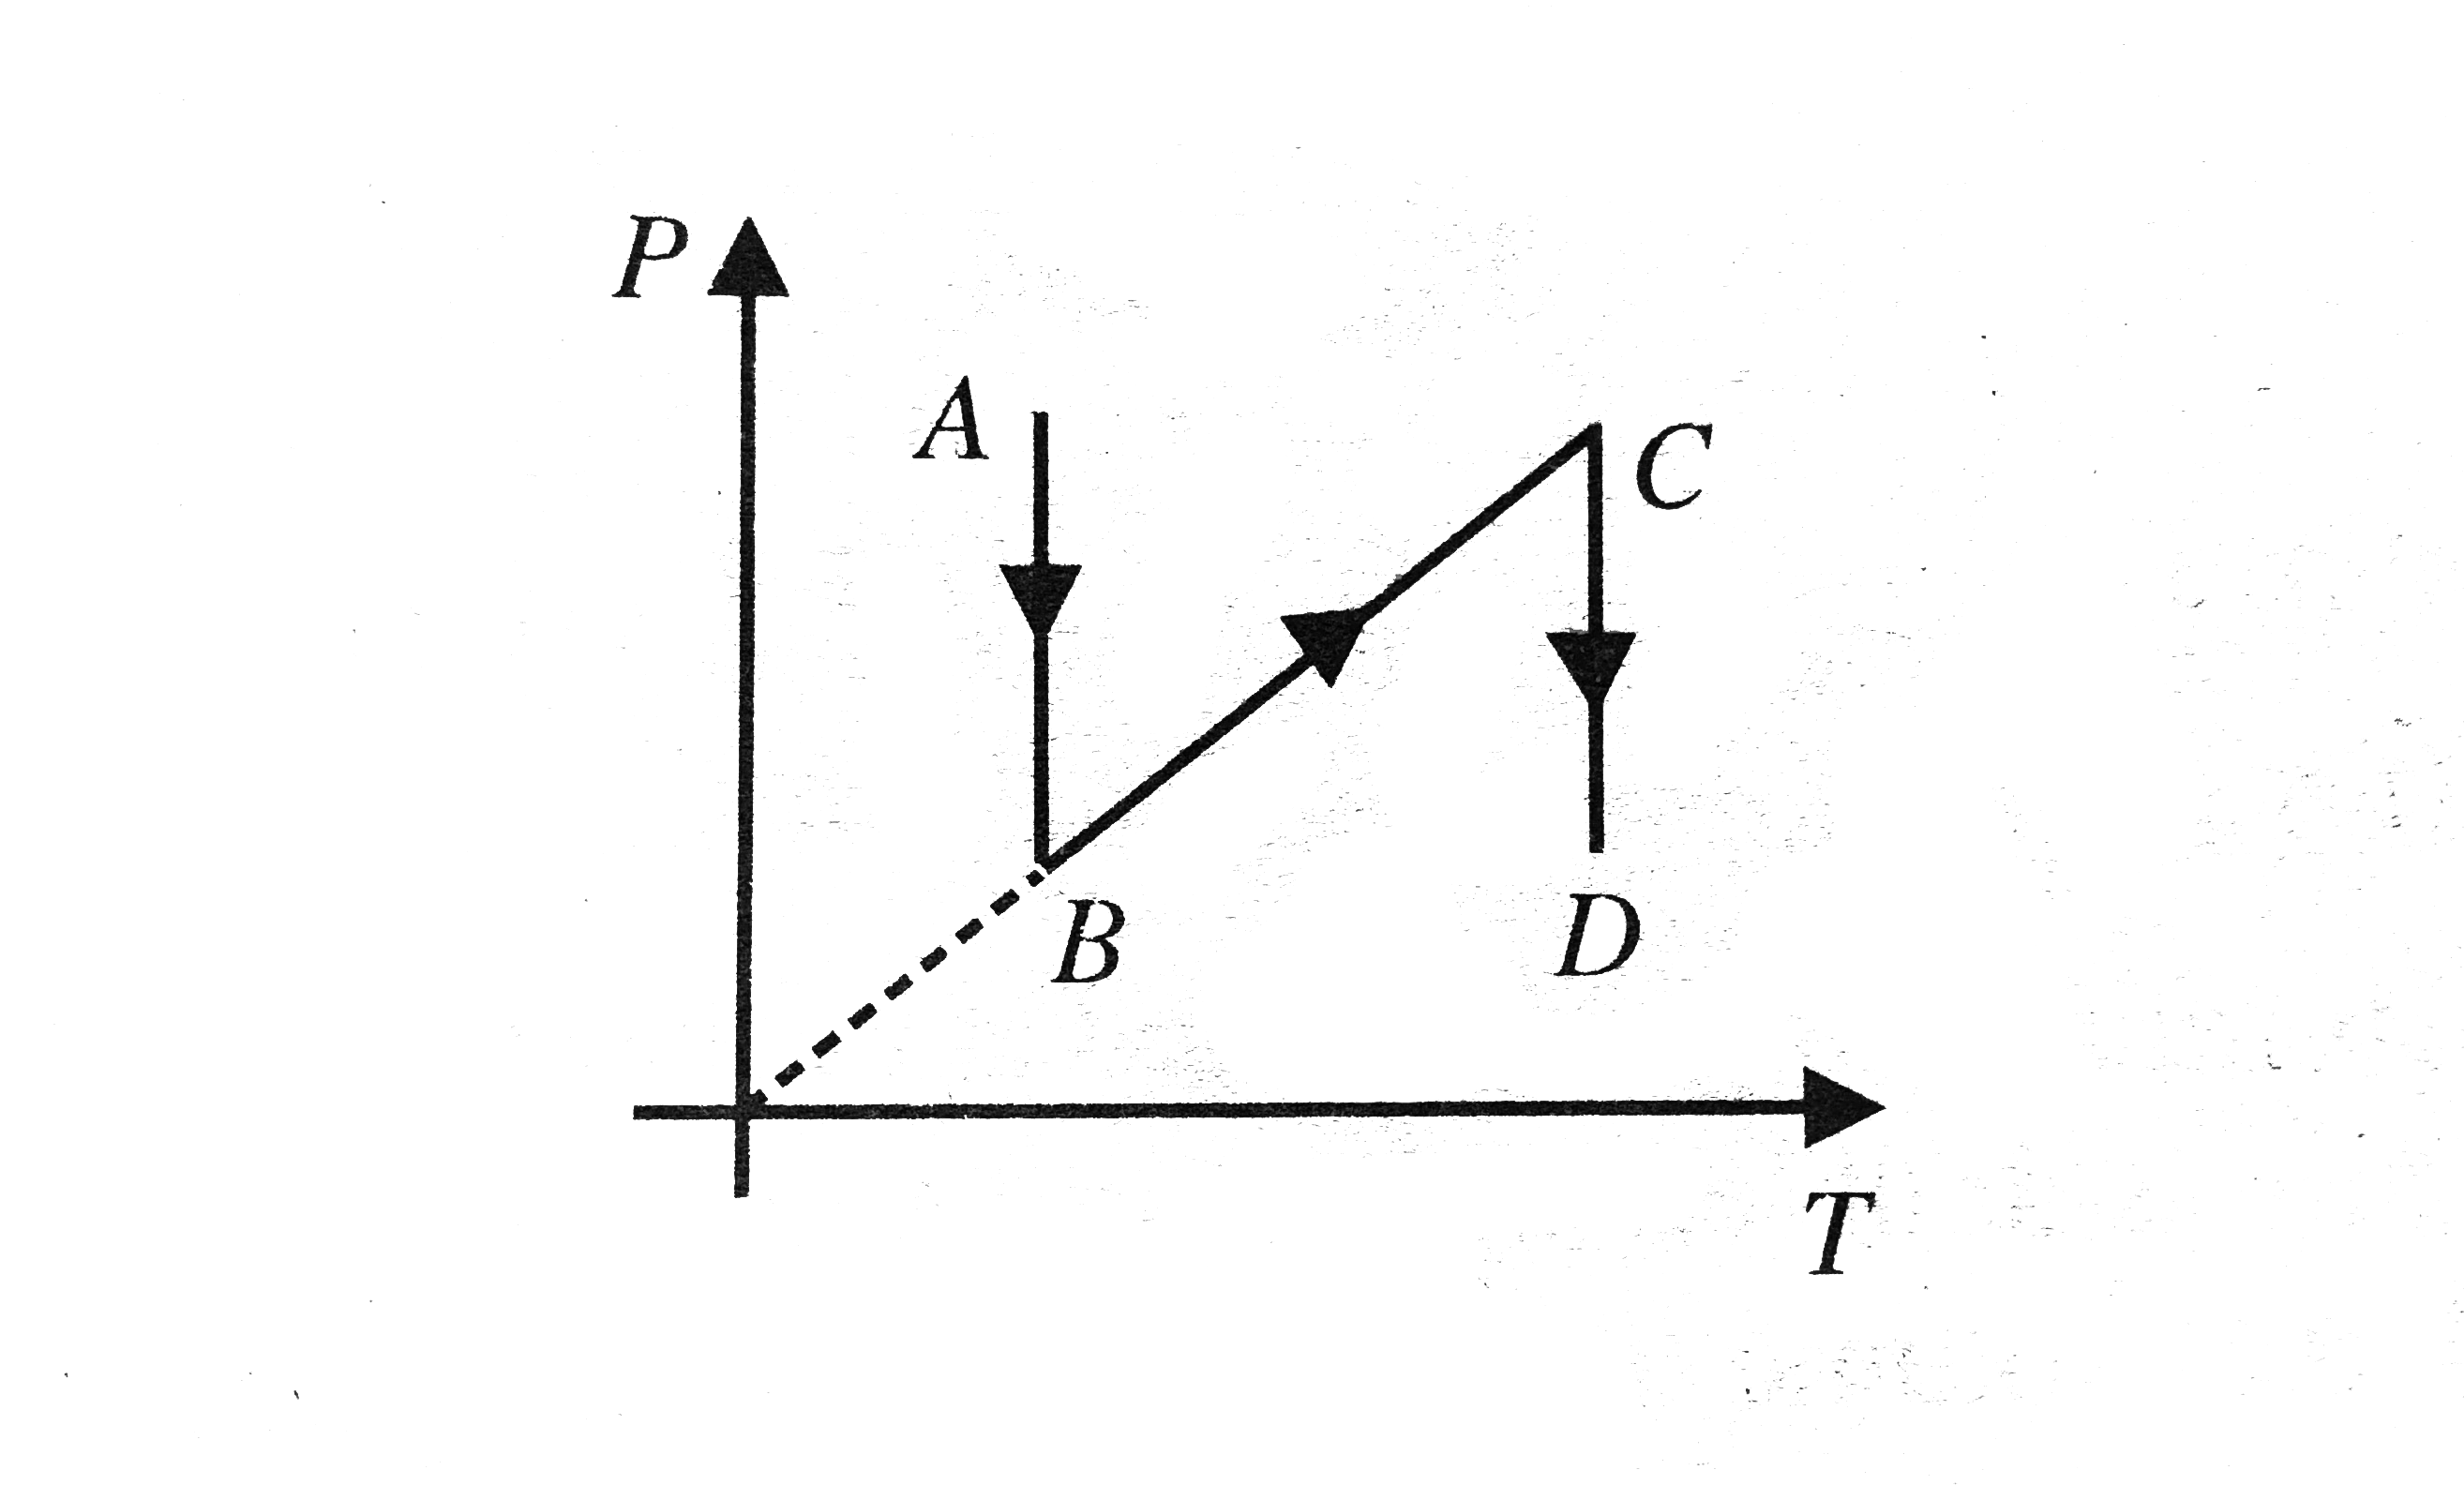
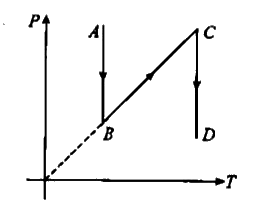
P−T diagram is shown in Fig. Choose the corresponding V−T diagram.
 A
A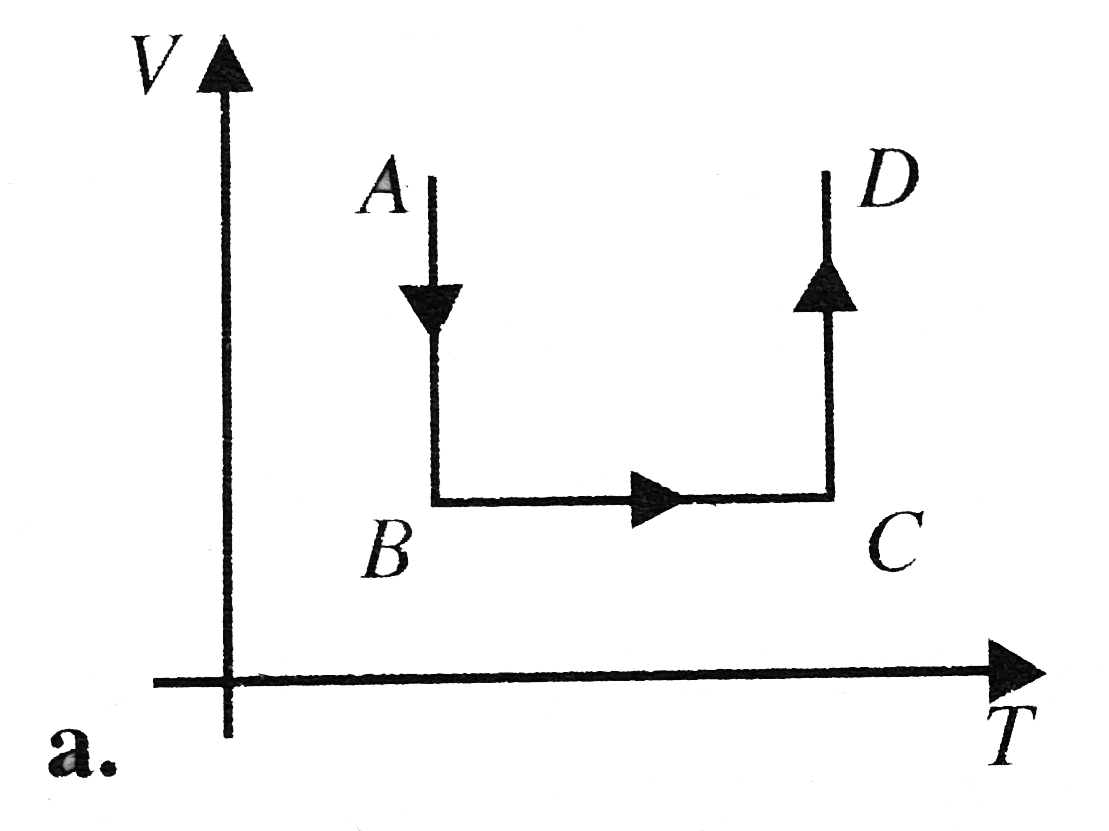 B
B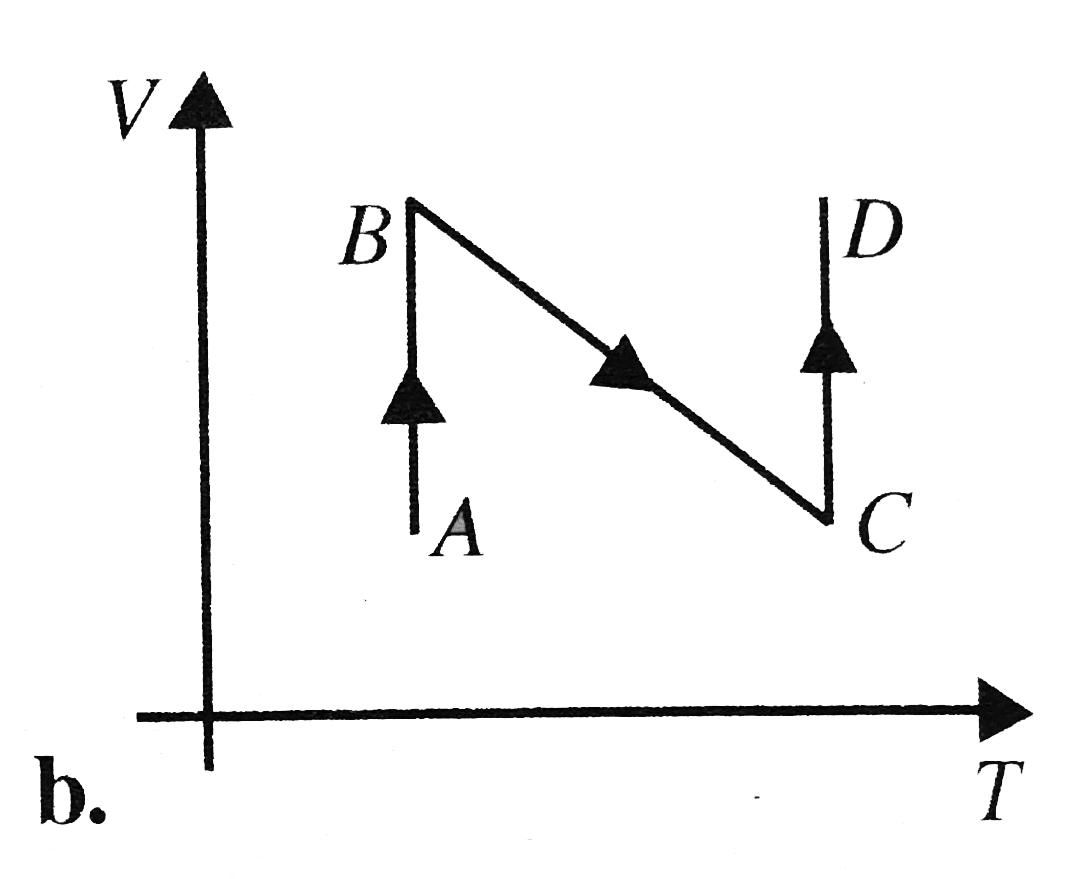 C
C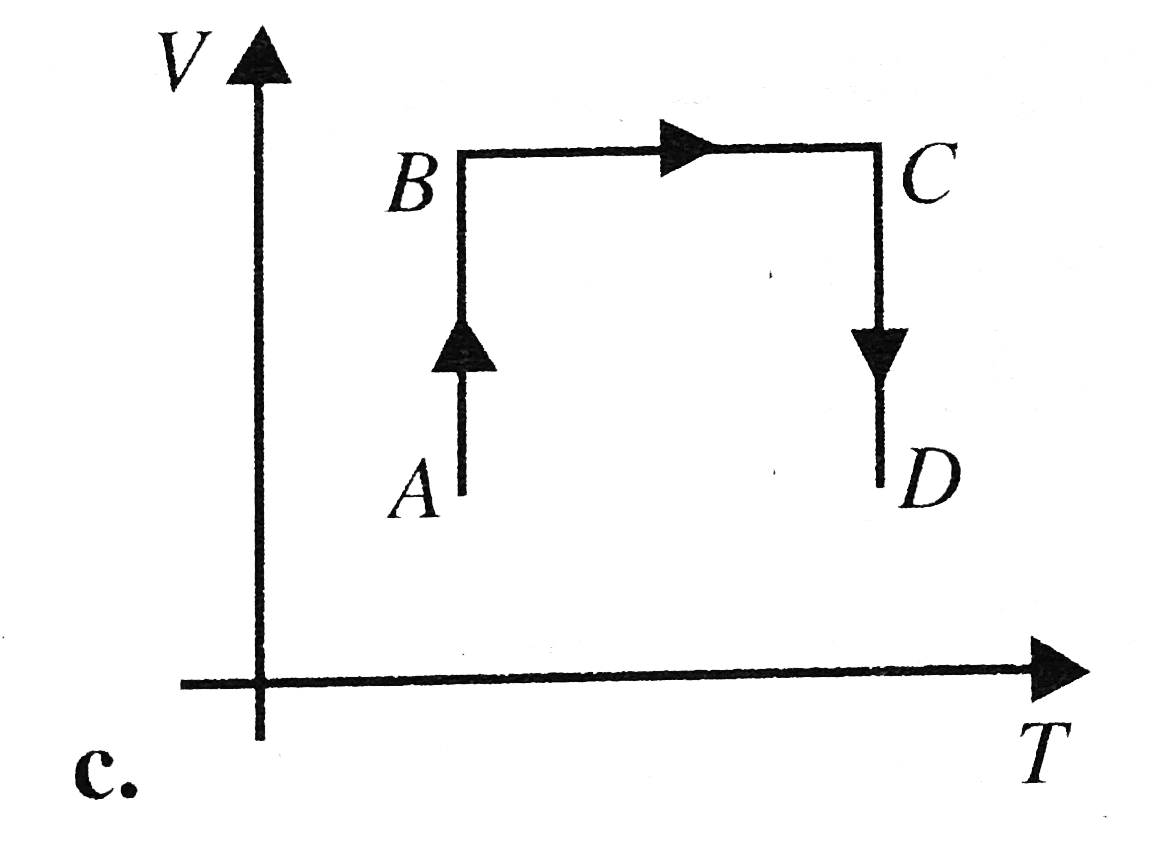 D
D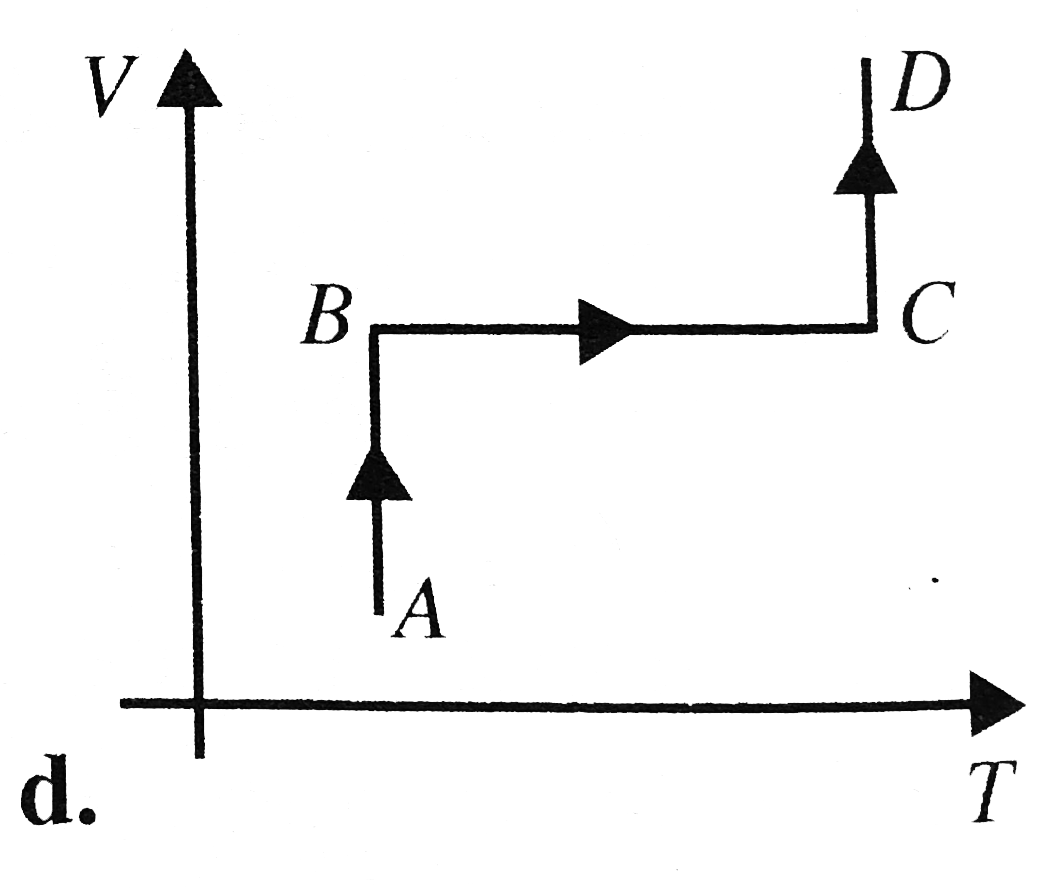
- Question 2 - Select One
V−T diagram for a process of given mass of ideal gas is as shown in fig. During the process pressure of the gas
_E01_072_Q01.png) AFirst increases then decreasesBFirst decreases then increasesCcontinously decreasesDcontinously increases
AFirst increases then decreasesBFirst decreases then increasesCcontinously decreasesDcontinously increases - Question 3 - Select One
Thermal coefficient of volume expansion at constant pressure for an ideal gas sample of n moles having pressure P0, volume V0, and temperature T0 is
ARP0V0BP0V0RC1T0D1nT0
P-T diagram is shown below then choose the corresponding V-T diagram
 View Solution
A Cycle process ABCA shown in V-T diagram Fig. is preformed with a constant mass of an ideal gas. Show the same process on a P-V diagram.
View SolutionAn ideal monoatomic gas indergoes a pressure pVn=constant. The adiabatic constant for gas is y. During the process, volume of gas increases from V0 to rV0 and pressure decreases for p0 to p02r Based on above information, answer the following questios :
The of n isView SolutionThe P-V diagram for an ideal gas is shown in figure.
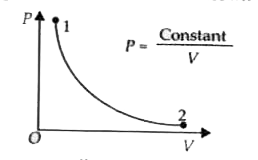
Out of the following diagrams which one represents the T-P diagram ?View SolutionPressure of an ideal gas is given by
P=P0=[1−12(V0V)2]View Solution

